Scuola di Dottorato di Ricerca in Scienze dell’Ingegneria Curriculum in Ingegneria Informatica, Gestionale e dell’Automazione
Human Behaviour Understanding
using Top-View RGB-D Data
Ph.D. Dissertation of:
Daniele Liciotti
Advisor:
Prof. Emanuele Frontoni
Curriculum Supervisor:
Prof. Francesco Piazza
Scuola di Dottorato di Ricerca in Scienze dell’Ingegneria Facolt`a di Ingegneria
Acknowledgments
Firstly, I would like to thank my supervisors Emanuele Frontoni and Primo Zingaretti who always offered valuable advise and insight, helped me along my journey as a PhD candidate. Especially Emanuele Frontoni always offered support, contributed very many good ideas. Thank you both for giving me this great opportunity and helping me along the way.
Secondly, I would like to express my gratitude to Prof. Tom Duckett and Prof. Nicola Bellotto for the ideas and suggestions received during the visiting period at University of Lincoln (UK).
I would like to thank everybody who made my time at university unforget-table. First and foremost, I want to thank Annalisa Cenci and Marina Paolanti for being the best laboratory mates. I consider you as sisters. We have done a great job together!
I am grateful to all the members of DII, in particular the actual and former members of VRAI (Vision, Robotics and Artificial Intelligence) team.
Finally, I would like to thank my parents, my brother with his family, and Laura. Everything would have been more difficult without your constant en-couragement.
Ancona, October 2017
Abstract
The capability of automatically detecting people and understanding their be-haviours is an important functionality of intelligent video systems. The interest in behaviour understanding has effectively increased in recent years, motivated by a societal needs.
This thesis is focused on the development of algorithms and solutions for different environments exploiting top-view RGB-D data. In particular, the addressed topics refer to Human Behaviour Understanding (HBU) in different research areas.
The first goal is to implement people detection algorithms in order to moni-tor the people activities. To this aim, a thorough study of the state of the art has been conducted to identify the advantages and weakness. An initial ap-proach, proposed in this thesis, is based on Computer Vision (CV) techniques, it regards the extraction the head of each person using depth data. Another approach is based on deep learning and is proposed to simplify the heads de-tection implementation in chaotic environments and in the presence of people with different heights. These solutions are validated with a specific dataset.
The second goal is to extract several feature from subject and to identify possible interactions that they have with the surrounding environment.
Finally, in order to demonstrate the actual contribution of algorithms for understanding the human behaviour in different environments, several use cases have been realized and tested.
Declaration
I, Daniele Liciotti, declare that this thesis and the work presented in it are my own and has been generated by me as the result of my own original research. I confirm that this work was done wholly while in candidature for a research degree at the Universit`a Politecnica delle Marche and that this thesis has not previously been submitted for a degree or any other qualification at this Uni-versity or any other institution. I also confirm that where I have consulted the published work of others, this is always clearly attributed and that where I have quoted from the work of others, the source is always given. With the exception of such quotations, this thesis is entirely my own work and I have acknowledged all main sources of help. I confirm that where the thesis is based on work done by myself jointly with others. Parts of this work have been published as:
• D. Liciotti, M. Contigiani, E. Frontoni, A. Mancini, P. Zingaretti, and V. Placidi. Shopper analytics: A customer activity recognition system using a distributed rgb-d camera network. In International Workshop on
Video Analytics for Audience Measurement in Retail and Digital Signage,
pages 146–157. Springer, Cham, 2014.
• D. Liciotti, E. Frontoni, A. Mancini, and P. Zingasretti. Pervasive system for consumer behaviour analysis in retail environments. In Video
Analyt-ics. Face and Facial Expression Recognition and Audience Measurement,
volume 2. 2017.
• D. Liciotti, E. Frontoni, P. Zingaretti, N. Bellotto, and T. Duckett. Hmm-based activity recognition with a ceiling rgb-d camera. In ICPRAM
(In-ternational Conference on Pattern Recognition Applications and Meth-ods), 2017.
• D. Liciotti, G. Massi, E. Frontoni, A. Mancini, and P. Zingaretti. Human activity analysis for in-home fall risk assessment. In Communication
Workshop (ICCW), 2015 IEEE International Conference on, pages 284–
289. IEEE, 2015.
• D. Liciotti, M. Paolanti, E. Frontoni, A. Mancini, and P. Zingaretti. Person re-identification dataset with rgb-d camera in a top-view con-figuration. In International Workshop on Face and Facial Expression
giani, and P. Zingaretti. Robust and affordable retail customer profiling by vision and radio beacon sensor fusion. Pattern Recognition Letters, 2016.
Contents
1. Introduction 1
1.1. Research problem . . . 1
1.2. Objectives and contributions . . . 2
1.3. Structure of the Thesis . . . 2
2. State of art 3 2.1. Human behaviour understanding . . . 3
2.1.1. Taxonomy . . . 4
2.2. RGB-D data from top-view . . . 4
2.3. Algorithms and approaches . . . 6
2.4. Challenges and opportunities in the research fields . . . 11
2.4.1. Datasets . . . 15
3. RGB-D data for top-view HBU: algorithms 19 3.1. Adopted metrics . . . 19
3.2. Image processing approaches . . . 20
3.2.1. Multi level segmentation . . . 20
3.2.2. Water-Filling . . . 21
3.2.3. Results and performance . . . 24
3.3. Semantic segmentation with deep learning approaches . . . 24
3.3.1. U-Net . . . 25
3.3.2. SegNet . . . 27
3.3.3. ResNet . . . 27
3.3.4. FractalNet . . . 28
3.3.5. Results and performance . . . 29
4. RGB-D data for top-view HBU: use cases and results 35 4.1. Video surveillance . . . 35
4.1.1. Re-identification . . . 35
4.2. Intelligent retail environment . . . 45
4.2.1. Shopper behaviour analysis . . . 45
4.3. Activities of daily living . . . 60
4.3.1. Activity recognition . . . 60
5. Conclusions and future works 77
5.1. Discussion . . . 77 5.2. Thesis contributions . . . 78 5.3. Open issues and future works . . . 79
A. Appendix 81
A.1. Semantic segmentation results . . . 81 A.2. User-shelf interaction results . . . 88
List of Acronyms
AAL Ambient Assisted Living ADLs Activities of Daily LivingCMC Cumulative Matching Characteristic CNN Convolutional Neural Network CRF Conditional Random Fields CT Computer Tomography
CV Computer Vision
DoS Degrees of Semantics
GMM Gaussian Mixture Models HBU Human Behaviour Understanding HMM Hidden Markov Model
HOG Histogram of Oriented Gradients IoU Intersection over Union
IRE Intelligent Retail Environments
LRN Local Response Normalization PSA Pixel State Analysis
RADiAL Recognition of Activity DAily Living Re-id Re-Identification
ReLU Rectified Linear Unit
ROC Receiver Operating Characteristic SVM Support Vector Machines
TOF Time of Flight TVHeads Top-View Heads
Chapter 1.
Introduction
This Thesis addresses the subject of HBU using top-view RGB-D data. The objective of the Thesis is described in this Chapter, together with the definition of the research problem, the main contributions, and the Thesis organization.
1.1. Research problem
In recent years, a lot of researchers have focused the attention on automatic analysis of human behaviour because of its important potential applications and its intrinsic scientific challenges. In several technological fields the awareness is emerging that a system can provide better and more suitable services to people only if it can understand much more about users’ preferences, personality, social relationships etc., as well as about what people are doing, the activities they have been concerned in the past, their life-styles and routines, etc.
CV and deep learning techniques are currently the most interesting solutions to analyse the human behaviour. In particular, if these are used in combination with RGB-D data that provide high availability, reliability and affordability.
Detection and tracking algorithms allow to generate motion descriptions of subjects which are used to identify actions or interactions. Consequently, it is possible to associate to a certain sequence of actions a particular behaviour. In this view, investigating technological solutions aimed at improving the en-vironments and adapting them to the specific user requirements, can be very useful.
The problem remains largely open due to several serious challenges, such as occlusions, change of appearance, complex and dynamic background. To counter these challenges, several studies adopt the top-view configuration be-cause it eases the task and makes simple to extract different trajectory features. This setup also introduces robustness, due to the lack of occlusions among in-dividuals.
Different domains are analysed in this Thesis, such as those of video surveil-lance, Intelligent Retail Environments (IRE) and Activities of Daily Living (ADLs).
1.2. Objectives and contributions
The objective of this Thesis is to understand the human behaviour in different real scenarios using CV techniques applied on RGB-D data in top-view con-figuration. To this aim, a thorough study of the literature will be presented, identifying advantages, challenges and issues related to the use of this partic-ular configuration. Furthermore, in order to support this research, several use cases will be presented. In particular, one of these was conducted during the five months of Ph.D. visiting period at Lincoln Centre for Autonomous Systems (LCAS) in the School of Computer Science at the University of Lincoln (UK).
1.3. Structure of the Thesis
The Thesis is organized in five Chapters, which describe and detail the different approaches and applications for human behaviour understanding using top-view RGB-D data. The Thesis has the following structure.
Chapter 2 reviews the state-of-the-art about the two main topics addressed: human behaviour analysis and RGB-D data from top-view.
In Chapter 3 are proposed some algorithms for people detection using RGB-D data in top-view configuration.
Chapter 4 describes different use cases, in particular are analysed applications on: video surveillance and analytics, intelligent retail environment, and ADLs. Finally, conclusions and discussion are drawn in Chapter 5 where, after clar-ifying the contribution of this work, some future research directions are identi-fied. Furthermore, this Chapter besides arguing over the possibilities that the proposed applications opens up in different topics, summaries also the chal-lenges, the open issues and the limitations that require further investigations.
Chapter 2.
State of art
The aim of this Chapter is to review and discuss the most relevant works on HBU using RGB-D data from top-view. An overview of techniques and solutions is provided, then, the discussion is focused on main scenarios and challenges.
2.1. Human behaviour understanding
Understanding human behaviours is a challenging problem in CV that has recently seen important advances. HBU combines image and signal processing, feature extraction, machine learning and 3D geometry. Application scenarios range from surveillance to indexing and retrieval, from patient care to industrial safety and sports analysis.
The capabilities of automatically detecting and tracking people, and of un-derstanding their behaviours are the crucial key functionalities of intelligent video systems. The interest in HBU has quickly increased in recent years, mo-tivated by a societal needs [13] that include security, natural interfaces, gaming, affective computing, and assisted living.
An initial approach can be the detecting and tracking of the subjects of interest, which in this case are the people. This way it is possible to generate motion descriptors which are used to identify actions or interactions.
Recognising particular behaviours requires the definition of a set of templates that represent different classes of behaviours. Nevertheless, in many scenarios not all behaviours can be characterised by a predefined number of classes nor can be known a priori. Alternatively, it is used the concept of anomaly, namely a deviation from the learned behaviours.
In the literature the use of terminology on HBU is ambiguous. In following paragraph a consistent definition of the terms used in HBU is proposed.
2.1.1. Taxonomy
The works of Moeslund et al. [82] and Borges et al. [17] have been used to create a taxonomy on HBU. Human activities can be categorized into four main groups, namely gesture, action, activity, and behaviour (figure 2.1).
• Gestures are movements of body parts that can be used to control and to manipulate, or to communicate. These are the atomic components describing the motion of a person.
• Actions can be seen as temporal concatenations of gestures. Actions represent voluntary body movements of an arbitrary complexity. An action implies a detailed sequence of elementary movements.
• Activities are a set of multiple actions that can be classified in order to understand human behaviours.
• Behaviours are the responses of subjects to internal, external, conscious, or unconscious stimuli. A series of activities may be related to a particular behaviour. Activity Action Gesture Behaviour DoS Time Frame
Figure 2.1.: HBU tasks - Classification.
Table 2.1 summarises the different Degrees of Semantics (DoS) considered by the taxonomy, along with some examples. Not only time frame and semantic degree grow at higher levels of this hierarchy, but also complexity and compu-tational cost lead to heavy and slow recognition systems, as each level requires most of the previous level tasks to be done too.
2.2. RGB-D data from top-view
Detecting and tracking people is an important and fundamental component for many interactive and intelligent systems. The problem remains largely open due to several serious challenges, such as occlusion, change of appearance, complex and dynamic background [70].
Table 2.1.: Classification of tasks according to the DoS involved
DoS Time lapse
Gesture frames, seconds Action seconds, minutes Activity minutes, hours Behaviour hours, days
Popular sensors for this task are RGB-D cameras because of their availability, reliability and affordability. Studies have demonstrated the great value (both in accuracy and efficiency) of depth camera in coping with severe occlusions among humans and complex background. The appearance of devices, such as Microsoft’s Kinect1 and Asus’s Xtion Pro Live2 Sensors motivates a
revolu-tion in CV and vision related research. The combinarevolu-tion of high-resolurevolu-tion depth and visual information opens up new challenges and opportunities for activity recognition and people tracking for many application fields. Reliable depth maps can provide valuable additional information to significantly im-prove tracking and detection results.
The task of detecting and tracking people in such image and sequences has proven very challenging although sustained research over many years has cre-ated a range of smart methods. Techniques involve extracting spatially global features and using statistical learning with local features and boosting, such as EOH [28], Histogram of Oriented Gradients (HOG) [22] and edgelet [117]. Other challenges such as high variation in human poses, self-occlusions and cross-occlusions make the problem even more complicated.
To counter these challenges, several research papers adopt the top-view con-figuration because it eases the task and makes simple to extract different tra-jectory features. This setup also introduces robustness, due to the lack of occlusions among individuals. Figure 2.2 depicts a people counting system from top-view configuration with an RGB-D camera.
The objective of this section is to provide a comprehensive overview of re-cent developments of people detection and tracking with RGB-D technologies from the top-view perspective, mainly published in the CV and machine intel-ligence communities. The criteria for topic selection arises from our previous experience with approaches with RGB-D cameras installed in a top-view con-figuration.
More specifically, this section includes person tracking and recognition, hu-man activity analysis, hand gesture recognition, and fall detection in different fields. The broad diversity of topics clearly shows the potential impact of
top-1https://developer.microsoft.com/en-us/windows/kinect/develop
(a) (b)
(c) (d)
Figure 2.2.: People counting system from top-view configuration with RGB-D camera.
view configuration in CV. I also summarize main paths that most approaches follow and point out their contributions. I categorize and compare the reviewed approaches from multiple perspectives, including information modality, repre-sentation coding, structure and transition, and feature engineering methodol-ogy, and analyse the pros and cons of each category.
2.3. Algorithms and approaches
Many vision techniques and algorithms for person detection and tracking have been proposed during the last years and these greatly restrict the generality of the approach in real-world settings. In this section, a survey of current methods, covering both early and recent literature related to algorithms and techniques applied for tracking and detecting humans from top view RGB-D data is presented. In particular, the approaches related to segmentation using background subtraction and statistical algorithms are reviewed.
Kouno et al. in [54] describe an image-based person identification task fo-cusing on an image from an overhead camera. The process is based on the background subtraction approach. They apply four features to the identifica-tion method, i.e. estimated body height, estimated body dimensions, estimated body size and depth histogram.
on stereovision. The processing chain corresponding to this counting system involves different steps dedicated to the detection, segmentation, tracking and counting. In fact, they have segmented the height maps for highlighting the passengers’ heads at different levels (i.e. adults, teenagers, children). The result is binary images that contain information related to the heads, called “kernels”. The extraction part attributes a number of parameters to the kernel such as, size of the kernel, shape, average grey level, average height level. Then, with the kernel information, a tracking procedure is applied to analyse the trajectories of the kernels.
The top-view camera setting is also adopted in [68]. In this paper, each depth image in a sequence is segmented into K layers as the Computer Tomography (CT) slides where the depth spacing between two adjacent layers is set to be a fixed value, distance and the number K is an a priori chosen parameter. After that, the region of each slide can be found based on the classic contour finding algorithm. Dynamic time warping algorithm is also applied to address the different sequence length problem. Finally, a Support Vector Machines (SVM) classifier is trained to classify the activities.
In another work the authors with methods of low-level segmentation and tracking develop a system that maps the customers in the store, detects the interactions with products on the shelves and the movement of groups of people within the store [67].
Another segmentation approach is the one proposed in [103]. In this pa-per, a pipeline verifies that only a single, authorized subject, can enter inside a secured area. Verification scenarios are carried out by using a set of RGB-D im-ages. They used an adaptive Gaussian mixture-based background/foreground segmentation method to exclude parts from the sample image that have the same texture as the background image.
Microsoft Kinect depth sensor is employed in [34] in an “on-ceiling” configu-ration based on the analysis of depth frames. Elements acquired in the depth scene are recognized by a segmentation algorithm, which analyses the raw depth data directly provided by the sensor. The system extracts the elements, and implements a solution to classify all the blobs in the scene. Anthropomet-ric relationships and features are used to recognize human subjects among the blobs. Once a person is detected, he is followed by a tracking algorithm between different frames.
Dittrich et al. [27] present an approach for low-level body part segmenta-tion based on RGB-D data. The RGB-D sensor is installed at the ceiling and observed a shared workspace for human-robot collaboration in the industrial domain. The object classes are the distinct human body parts: Head, Upper Body, Upper and Lower Arm, Hand, Legs and the background rejection. For the generation of data for the classifier training, they use a synthetic
represen-tation of the human body in a virtual environment, where synthetic sensors generate depth data. The features used for the description of the object class samples are based on the depth information only, and have been extracted by a centred pixel patch with constant size. As an innovation an optimized train-ing strategy allows a reduced number of traintrain-ing samples while preservtrain-ing the classification performance.
Further segmentation approach is [46]. Hernandez et al. have described a system that operates in troublesome scenarios where illumination conditions can suffer sudden changes. They have been focused on the people counting problem with Re-Identification (Re-id) and trajectory analysis.
A variant of classical segmentation is the one proposed by Tseng in [110]. In this paper, they present a real-time indoor surveillance system which installs multiple depth cameras from vertical top-view to track humans. The system with a framework tries to solve the traditional challenge of surveillance through tracking of multiple people, such as severe occlusion, similar appearance, illu-mination changes, and outline deformation. To cover the entire space of indoor surveillance scene, the image stitching based on the cameras’ spatial relation is also used. The background subtraction of the stitched top-view image has been performed to extract the foreground objects in the cluttered environ-ment. The detection scheme involves different phases such as the graph-based segmentation, the head hemiellipsoid model, and the geodesic distance map. Furthermore, the shape feature based on diffusion distance has been designed to verify the human tracking hypotheses within particle filter.
In [76], the processing of the combined depth image in multiple steps to iden-tify the location, orientation, and people formations is executed. The algorithm adopted in this case finds the highest point of all detected people identified in the previous step, and shifted the depth values of all remaining outlines of people by the difference in height.
An improvement of the classical segmentation techniques is the algorithm proposed by Kepski et al. [51]. The first step of the algorithm is nearest neigh-bor interpolation to fill the holes in the depth map and to get the map with meaningful values for all pixels. Then, the median filter with a 5 × 5 window on the depth array is executed to make the data smooth. The algorithm also extracts the floor and removes their corresponding pixels from the depth map. Given the extracted person in the last depth frame, the region growing is per-formed to delineate the person in the current frame. To confirm the presence of the tracked subject as well as to give head location a SVM based person finder is used. On the basis of the person’s centroid the pan-tilt head rotates the camera to keep the head in the central part of the depth map. Finally, a cascade classifier consisting of lying pose detector and dynamic transition detector is carried out.
An additional paper that describes a method for people counting in public transportation with a segmentation approach is [75]. Kinect sensor mounted vertically has been employed to acquire an images database of 1 − 5 persons, with and without body poses of holding a handrail. However, in this case the image is processed in blocks in order to find potential local maxima, which are subsequently verified to find head candidates. Finally, non-head objects have been filtered out, based on the ratio of pixels with similar and near-zero value, in the neighbourhood of the maxima.
In [116], the depth images acquired from Kinect camera have been anal-ysed for detecting moving objects using the background subtraction technique. The heads of person are identified by object segmentation in the U-disparity representation.
The approach in [9] investigates a real time people tracking system able to work even under severe low-lighting conditions. The system relies on a novel active sensor that provides brightness and depth images based on a Time of Flight (TOF) technology. This is performed by means of a simple background subtraction procedure based on a pixelwise parametric statistical model. The tracking algorithm is efficient, being based on geometrical constraints and in-variants. Experiments are performed under changing lighting conditions and involving multiple people closely interacting with each other.
The same technique is the one applied in [120]. In this paper, the method is composed by two behaviour estimators. The first one is based on height of hand with depth information the second instead on SVM with depth and Pixel State Analysis (PSA) based features and these estimators are used by cascading them.
A method to detect human body parts in depth images based on an active learning strategy is proposed in [12]. The approach is evaluated on two different scenarios: the detection of human heads of people lying in a bed and the detection of human heads from a ceiling camera. The proposal is to reduce both the training processing time and the image labelling efforts, combining an online decision tree learning procedure that is able to train the model incrementally and a data sampling strategy that selects relevant samples for labelling The data are grouped into clusters using as features the depth pixel values, with an algorithm such as k-means.
Tian et al., in [109] have adopted the median filtering to noise removal, because it could well filter the depth image noise obtained by Kinect, and at the same time could protect edge information well. A human detection method using HOG features, that are local descriptors, of head and shoulder based on depth map and detecting moving objects in particular scene is used. SVM classifier has isolated regions of interest (features of head and shoulder) to achieve real-time detection of objects (pedestrian).
A method for human detection and tracking in depth images captured by a top-view camera system is presented in [97]. They have introduced feature de-scriptor to train a head-shoulder detector using a discriminative class scheme. A separate processing step has ensured that only a minimal but sufficient num-ber of head-shoulder candidates is evaluated. A final tracking step reliably propagated detections in time and provides stable tracking results. The qual-ity of the method has allowed to recognise many challenging situations with humans tailgating and piggybacking.
An interesting binary segmentation approach is the one proposed by Wu et
al. [117] that have used a Gaussian Mixture Models (GMM) algorithm and
re-duced depth-sensing noise from the camera and background subtraction. More-over, the authors have smoothed the foreground depth map using a 5 by 5 median filter. The real-time segmentation of a tracked person and their body parts has been the first phase of the EagleSense tracking pipeline.
In [45] authors described and evaluated a vision-based technique for tracking many people with a network of stereo camera sensors. They have modelled the stereo depth estimation error as Gaussian and track the features using a Kalman filter. The feature tracking component starts by identifying good features to track using the Harris corner detector. It has tracked the left and right image features independently in the time domain using Lucas-Kanade-Tomasi feature tracking. The approach has been evaluated using the MOTA-MOTP multi-target tracking performance metrics on real data sets with up to 6 people and on challenging simulations of crowds of up to 25 people with uniform appearance. This technique uses a separate particle filter to track each person and thus a data association step is required to assign 3D feature measurements to individual trackers.
Migniot in papers [80] and [79] has addressed the problem of the tracking of 3D human body pose from depth image sequences given by a Xtion Pro-Live camera. Human body poses have been estimated through model fitting using dense correspondences between depth data and an articulated human model. Two trackers using particle filter have been presented.
A CV algorithm adopted by many researchers in case of RGB-D cameras placed in top-view configuration is Water filling.
Zhang et al. [122] have built a system with vertical Kinect sensor for peo-ple counting, where the depth information is used to remove the effect of the appearance variation. Since the head is closer to the Kinect sensor than other parts of the body, people counting task found the suitable local minimum regions. The unsupervised water filling method finds these regions with the property of robustness, locality and scale-invariance.
Even in [1] and in [21], the authors have presented a water filling people counting algorithm using depth images acquired from a Kinect camera that
is installed vertically, i.e., pointing toward the floor. The algorithm in [1] is referred to as Field seeding algorithm. The people head blobs are detected from the binary images generated with regard to the threshold values derived from the local minimum values. In [21] the approach called as people tracking increases the performance of the people counting system.
2.4. Challenges and opportunities in the research
fields
In this section, the main motivating factors for the installation of RGB-D cam-eras in top-view configuration are presented. I will discuss the reliable and occlusion free counting of people that is crucial to many applications.
Most of previous works can only count moving people from a single camera, which can fail in crowded environment where occlusions are very frequent. This Thesis focuses the attention on the works with RGB-D data in top-view configuration in three particular fields of research:
• Video surveillance;
• Intelligent retail environment; • Activities of daily living;
Applications here described cover several fields such as the ones listed below. Datasets collected with RGB-D camera in top-view configuration are reported in 2.4.1.
Video surveillance
Applications developed in this field are related to safety and security in crowded environments, people flow analysis and access control as well as counting. Ac-tual tracking accuracy of top-view cameras over-performs all other point of view in crowded environments with accuracies up to 99%. When there are spe-cial security applications or the system is working in usually crowded scenarios the proposed architecture and point of view are the only suitable.
In [15], authors focus their approach on the development of an embedded smart camera network dedicated to track and count people in public spaces. In the network, each node is capable of sensing, tracking and counting people while communicating with the adjacent nodes of the network. Each node uses a 3D-sensing camera positioned in a downward-view. This system has per-formed background modelling during the calibration process, using a fast and lightweight segmentation algorithm.
A vision based method for counting the number of people which cross a vir-tual line is presented in [25]. The method analyses the video stream acquired by a camera mounted in a zenithal position with respect to the counting line, allowing to determine the number of people that cross the virtual line, and providing the crossing direction for each person. This approach was designed to achieve high accuracy and computational efficiency. An extensive evaluation of the method has been carried out taking into account the factors that may impact on the counting performance and, in particular, the acquisition tech-nology (traditional RGB camera and depth sensor), the installation scenario (indoor and outdoor), the density of the people flow (isolated people and groups of persons), the acquisition frame rate, and the image resolution. They also analysed the combination of the outputs obtained from the RGB and depth sensors as a way to improve the counting performance.
Another work for people counting discussed in [31]. An algorithm by mul-timodal joint information processing for crowd counting is developed. In this method, the authors have used colour and depth information along with an ordinary depth camera (e.g. Microsoft Kinect). First, they have detected each head of the passing or still person in the surveillance region using an adaptive modulation approach when the depth scenes vary. Then, they have tracked and counted each head detected in the colour data.
An image-based person identification task is performed by Kouno et al. [54]. They have adopted an overhead camera, because of the restriction reduction of the installation location of a camera and the problem solution of occluded images.
The approach in [9] is a real time people tracking system able to work even under severe low-lighting conditions. The system is based on a novel active sensor that provides brightness and depth images based on a TOF technology. Human detection and tracking is also the main goal in [97].
In order to guarantee security in critical infrastructure a pipeline is presented in [103]. It verifies that only a single, authorized subject can enter a secured area. Verification scenarios are carried out by using a set of RGB-D images. Features, invariant to rotation and pose, are used and classified by different metrics to be applied in real-time.
Even, in security field, Tian et al. [109] have proposed a human detection method using HOG features of head and shoulder based on depth map and detecting moving objects.
Another people counting application is the technique that uses the mixture of colour and depth images from top-view camera [122]. The U-disparity as depth image projection is introduced in order to increase the accuracy of counting number [116].
analysis is faced in [46]. They have extracted useful information using depth cameras. The Re-id task is studied by [71]. Authors have introduced a study on the use of different features exclusively obtained from depth images captured with top-view RGB-D cameras. Top-View Person Re-Identification (TVPR) is the dataset for person Re-id with an RGB-D camera in a top-view configuration. The registrations are made in an indoor scenario, where people pass under the camera installed on the ceiling [66].
Intelligent retail environment
Another important research field is represented by the detection of the inter-action between people and environment. More precisely, in the following I will discuss the IRE and intelligent shelf, such as Shopper Analytics systems. [61]. The author of this work presented a low cost integrated system consisted of a RGB-D camera and a software able to monitor shoppers. The camera installed above the shelf detects the presence of people and uniquely identifies them. Through the depth frames, the system detects the interactions of the shoppers with the products on the shelf, and determines if a product is picked up or if the product is taken and then put back, and, finally, if there is not contact with the products.
The same authors, in [63] have described the monitoring of consumer be-haviours. The autonomous and low cost system employed is based on a soft-ware infrastructure connected to a video sensor network, with a set of CV algorithms, embedded in the distributed RGB-D cameras.
GroupTogether is another system that explores cross-device interactions us-ing two sociological constructs [76]. It supports fluid, minimally disruptive techniques for co-located collaboration by leveraging the proximity of people as well as the proximity of devices.
Migniot et al. have explored the problem of people tracking with a robust and reliable markerless camera tracking system for outdoor augmented reality using only a mobile handheld camera. The method was particularly efficient for partially known 3D scenes where only an incomplete 3D model of the outdoor environment was available [79].
Activities of daily living
ADLs recognition is another research field that may widely benefit from RGB-D data top view configuration. In this field the application range goes from high reliability fall detection to occlusion free HBU at home for elders in Ambient Assisted Living (AAL) environments. All these applications have relevant out-comes form the current research with the ability to identify users while perform-ing trackperform-ing, interaction analysis, or HBU. Furthermore, all these application
scenarios, can gather data using low cost sensors and processing units. An example is the system for real-time human tracking and predefined human gestures detection that uses depth data acquired from Kinect sensor installed right above the detection region described in [8]. The tracking part is based on fitting an articulated human body model to obtained data using particle filter framework and specifically defined constraints which originate in physiological properties of the human body. The gesture recognition part has used the timed automaton conforming to the human body poses and regarding tolerances of the joints positions and time constraints.
In [12], a method to detect human body parts in depth images that is based on an active learning strategy is presented. The goal is to build an accurate classifier using a reduced number of labelled samples in order to minimize the training computational cost as well as the image labelling cost. The authors have validated the approach on two different scenarios: the detection of human heads of people lying in a bed and the detection of human heads from a ceiling camera.
The work proposed in [68] describes a feature for activity recognition from vertical top-view depth image sequences. The approach performance were ver-ified on Top-View 3D Daily Activity Dataset.
For advanced analysis of human behaviours, the authors of [62] have devel-oped a highly-integrated system. The video framework exploits vertical RGB-D sensors for people tracking, interaction analysis, and users activities detection in domestic scenarios. The depth information has been used to remove the effect of the appearance variation and to evaluate users activities inside the home and in front of the fixtures. In addition, group interactions have been monitored and analysed. The audio framework has recognised voice commands by continuously monitoring the acoustic home environment.
As previously stated, another important issue to monitor and evaluate during the people tracking is the fall detection, as reported for example in [65, 51, 52, 34]. The solutions implemented in these papers with RGB-D camera in a top-view configuration are suitable and affordable for this aim.
An automated RGB-D video analysis system that recognises human ADLs activities, related to classical daily actions is described in [64]. The main goal is to predict the probability of an analysed subject action. Thus, abnormal be-haviours can be detected. The activity detection and recognition is performed using an affordable RGB-D camera. Action sequence recognition is then han-dled using a discriminative Hidden Markov Model (HMM).
2.4.1. Datasets
The most relevant available datasets with RGB-D data installed in a top-view configuration are listed below.
TST Fall detection dataset v13[34]
It stores depth frames collected using Microsoft Kinect v1 in top-view configu-ration. Four volunteers, aged between 26 − 27 years and height in 1.62 − 1.78m, have been recruited for a total number of 20 tests. The dataset is separated in two main groups: Group A (test 1-10): two or more people walk in the moni-tored area; Group B (test 11-20): a person performs some falls in the covered area (figure 2.3).
Figure 2.3.: ST Fall detection dataset v1. Image taken from [34]
TST Intake Monitoring dataset v14[33]
It is composed of food intake movements, recorded with Kinect V1, simulated by 35 volunteers for a total of 48 tests. The device is located on the ceiling at a 3m distance from the floor. The people involved in the tests are aged between 22 and 39 years, with different height and build (figure 2.4).
Figure 2.4.: TST Intake Monitoring dataset v1. Image taken from [33]
3http://www.tlc.dii.univpm.it/blog/databases4kinect#IDFall1
UR Fall Detection Dataset5[52]
It contains 70 (30 falls + 40 activities of daily living) sequences. Fall events are recorded with 2 Microsoft Kinect cameras (parallel to the floor and ceiling mounted) and corresponding accelerometric data (figure 2.5).
Figure 2.5.: UR Fall Detection Dataset. Image taken from [52]
Depthvisdoor6[46]
It is a database of images captured by a single and stationary Kinect camera covering, from a top view, the entrance of a classroom at the University of Las Palmas de Gran Canaria. Two sessions have been recorded per day in 3 different days, with a one week gap every two recording sessions. For each of the 6 recordings, the Kinect sensor is located roughly at a similar location, approximately 2.7m height, looking at the scenario floor (figure 2.6). The illumination conditions change from one day to another and even within the same day due to the two hours of difference between the start and the end of the class, and the sensor makes use of its auto adjustment. The database has been used to develop, test, and evaluate people counting, description and Re-id algorithms.
5
http://fenix.univ.rzeszow.pl/˜mkepski/ds/uf.html
Figure 2.6.: Depthvisdoor Dataset.
TVHeads Dataset7
The Top-View Heads (TVHeads) dataset contains depth images of people from top-view configuration. In particular, the purpose of this dataset is to localize the heads of people who are present below the camera. It contains a total of 1815 depth images (16 bit) with a dimension of 320 × 240 pixels. Furthermore, after an image preprocessing phase, the depth images are also converted, with an appropriate scaling, in order to obtain an images (8 bit) where the heads silhouette is highlighted by improving image contrast and brightness. The ground truth was manually labelled by 6 human annotators. Figure 2.7 shows an example of a dataset instance that includes the three images described above.
(a) 16 bit Depth image. (b) 8 bit Depth image. (c) Ground truth.
Figure 2.7.: TVHeads Dataset.
CBSR8
The dataset includes a total of 3884 images with 6094 heads. It contains depth images after background subtraction and in the groundtruth the heads are manually painted as red colour.
7http://vrai.dii.univpm.it/tvheads-dataset
(a) (b)
Figure 2.8.: CBSR Dataset.
TVPR Dataset9[66]
The 100 people of TVPR were recorded in 23 registration session. The record-ing time for the session and the number of persons of that session are reported in the following table. Each of the 23 folders contains the video of one reg-istration session. Acquisitions have been performed in 8 days and the total recording time is about 2000 seconds. Registrations are made in an indoor scenario, where people pass under the camera installed on the ceiling. More details will be provided in the following Chapter.
Chapter 3.
RGB-D data for top-view HBU:
algorithms
This Chapter describes several solutions and main contributions for people detection using RGB-D data from top-view configuration. The algorithms are based on CV techniques and these will be used in the Chapter 4 for every use case. The problem of people detection has been simplified in order to find only the head of each subject. From top-view configuration, the head is the part of body that hardly has contact with objects and people. This facilitates the tracking procedure.
In section 3.2 are illustrated two important image processing algorithms, while in section 3.3 different semantic segmentation approaches based on deep learning techniques are presented. The most important metrics used for seg-mentation problems are reported in section 3.1.
3.1. Adopted metrics
Typically, to measure the segmentation accuracy and performance, different types of metrics are used. In particular, in this section, a two stages process is adopted: the first metrics measure how much the system is able to separate the heads from the background, whereas the second metric measures the ability of the system to correctly classify the heads.
One of the first metrics is the Jaccard index, also known as Intersection over Union (IoU), measures similarity between finite sample sets, and defined as the size of the intersection divided by the size of the union of the sample sets:
IoU = truepos
truepos+ f alsepos+ f alseneg
(3.1)
is the most used metric in semantic segmentation, and is computed as:
Dice = 2 · truepos
2 · truepos+ f alsepos+ f alseneg
(3.2)
where the positive class is the heads and the negative is all the rest. The second set of metrics is composed by the average accuracy, precision, recall, and f 1 score averaged across all the test images. These metrics are evaluated just on the heads pixels. The metrics are thus computed as:
accuracy = truepos+ trueneg
truepos+ trueneg+ f alsepos+ f alseneg
(3.3)
precision = truepos truepos+ f alsepos
(3.4)
recall = truepos truepos+ f alseneg
(3.5)
f 1 score = 2 × precision × recall
precision + recall (3.6)
3.2. Image processing approaches
In this section are reported two innovative algorithms based on image process-ing techniques usprocess-ing RGB-D data in top-view configuration.
3.2.1. Multi level segmentation
Multi level segmentation algorithm is explained in detail in the pseudo-code Al-gorithm 1. The MultiLevelSegm function has in input the foreground image (f (x, y)). First of all, FindPointMax function calculates the highest point of whole image (max) and its coordinates (pointmax). In line 3, the level counter
assumes the threshold value, that is a fixed value corresponding to average height of a human head (we adopted the value 10cm). So, the number of segmentations is strictly related to the height of the tallest person.
The output condition of the while loop is verified when the segmentation level becomes negative (above the floor). In line 5 there is a segmentation function that yields in output a binary image with blobs representative of moving objects that are above the segmentation level (max − level). This binary image is the input of FindContours, an OpenCV function that returns a vector of points for each blob. Then, the FilterContours function deletes noise (blobs with a little dimension and/or a bad shape).
The for loop from line 8 to line 14 inserts in the vector points the highest point/depth value (FindPointMax function) of each blob identified by means
of the FilterMask function. Finally, MultiLevelSegm function returns a vector with all maximum local points. The length of this vector indicates the number of people that are in the image.
Algorithm 1 Multi level segmentation algorithm
1: function multiLevelSegm(f (x, y))
2: (max, pointmax) = findPointMax(f (x, y))
3: level = threshold
4: while (max − level) > 0 do
5: flevel(x, y) = f (x, y) > (max − level) 6: contours = findContours(flevel(x, y))
7: filterContours(contours) 8: for each contour i ∈ contours do
9: fmask(x, y) = filterMask(flevel(x, y), i)
10: vmax, pmax = findPointMax(fmask(x, y))
11: if pmax ∉ points then
12: points.pushBack(pmax)
13: end if
14: end for
15: level = level + threshold 16: end while
17: return points 18: end function
The multi level Segmentation algorithm overcomes the limitations of the bi-nary segmentation method proposed in [61] in case of collisions among people. In fact, using a single-level segmentation, in case of a collision, two people become a single blob (person), without distinguishing between head and shoul-ders of the person. By using this approach, when a collision occurs, even if two people are identified with a single blob, the head of each person is anyway detected, becoming the discriminant element. Figure 3.1 highlights the head of each person obtained by the multi level segmentation algorithm: different colours highlight the head of a person detected by the camera. In case of col-lisions (Figures 3.1a and 3.1b), the yellow blob contains two people and both heads are detected.
3.2.2. Water-Filling
A further algorithm for people detection, using an RGB-D sensor in vertical position, is proposed by Zhang et al. in [122] and it is called “Water Filling”. In this paragraph an improvement of this algorithm is suggested.
It finds, in a depth image, the local minimum regions simulating the rain and the flooding of ground. According to an uniform distribution, it simulates the rain with some raindrop. The algorithm moves the raindrops towards the local
(a) RGB image. (b) Segmented image.
Figure 3.1.: Multi level segmentation algorithm. Head recognition (3.1b): dif-ferent colours of the blob highlight the head of the people detected in the scene (3.1a).
minimum points, but if a point is wet, it wets the point of the higher level. Then, puddles are formed because the water flows to some local minimum regions. It computes the contour lines considering the distance from the local minimum as a function of the total raindrops.
It is possible to consider the depth image as a function f (x, y) that can be non-derivable or even discontinuous, due to the noise of depth sensor. Finding people in depth image equals to finding local minimum regions in f . Math-ematically, the problem can be defined as finding the region A and N that satisfy the following constraint:
EA(f (x, y)) + η ≤ EN \A(f (x, y)) (3.7)
where A ∈ N , A is the local region and N is its neighbourhood, both can be of arbitrary shape, E(·) is an operation to pool the depth information in the region to a real value that reflects the total depth information in the region.
η is a pre-defined threshold to ensure that depth in A should lower than N \A
with a margin.
In order to solve effectively the problem and be robust to noise, can be mathematically defined an additional measure function g(x, y) as:
Definition 1. g(x, y) is a measure function of f (x, y) if and only if ∃ ϵ >
0, ∀ (x1, y1), (x2, y2), s.t. (x1− x2)2+ (y1− y2)2 < ϵ, if f (x1, y1) ≤ f (x2, y2) f (x1, y1) + g(x1, y1) ≤ f (x2, y2) + g(x2, y2) (3.8) g(x1, y1) ≥ g(x2, y2) g(x1, y1) ≥ 0, g(x2, y2) ≥ 0
The form of g(x, y) can be trivial, for example a zero function. The use of
In this context, it is not important to get a general solution of g(x, y), but proper non-trivial form it is acceptable.
The form of function f (x, y) can be seen as a land with humps and hollows. The raindrop in the hump will flow directly to the neighbourhood hollow under force of gravity. Little by little, the hollow region will gather a lot of raindrops. The function g(x, y) reflects the quantity of raindrop at point (x, y). After the rain stops, the regions with a lot of rain drop can be classified as a hollow.
The algorithm 2 is an improved version of original proposed in [122]. In particular, the drops are chosen according to the segmentation of foreground image (line 4). This procedure improves the execution time of the algorithm.
Algorithm 2 Water Filling algorithm
1: function WaterFilling(f (x, y), T, K) 2: g(x, y) = 0
3: M, N = size(f (x, y))
4: f g(x, y) = (bg(x, y) − f (x, y)) > T 5: for k = 1 : K do
6: x = rand(1, M ), y = rand(1, N ) with (x, y) ∈ f g(x, y) 7: while T rue do
8: d(xn, yn) = f (xn, yn) + g(xn, yn) − (f (x, y) + g(x, y)) where
(xn, yn) is the neighbourhood of (x, y).
9: (x∗, y∗) = arg min d(xn, yn) 10: if d(x∗, y∗) < 0 then 11: x = x∗, y = y∗ 12: else 13: g(x, y) = g(x, y) + 1 14: break 15: end if 16: end while 17: end for 18: return g(x, y) > T 19: end function
The total number of raindrops is K = tM N , where t is usually set to be 100. At every loop (line 5), (x, y) is randomly generated through a discrete uniform distribution (line 6). If there is a point (x∗, y∗) in the neighbourhood of (x, y) that satisfies Equation 3.8 then the raindrop in (x, y) flows towards to (x∗, y∗) and restart the loop until a local minimum is reached. When this is reached, the measure function g(·) is increased (line 13). After all the K raindrops find their stable place, measure function g(x, y) is calculated and, by applying a threshold T , it is possible to extract the heads of people that pass under the RGB-D sensor (line 18).
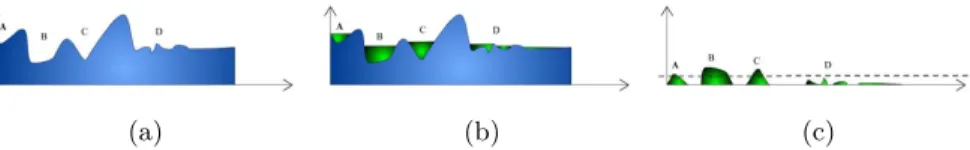
(a) (b) (c)
Figure 3.2.: The main characteristics water filling algorithm. A, B, C corre-spond to three people respectively and D is a noise region (fig-ure 3.2a). Region A has smaller scale compared with B and C, and the absolute height of A is larger than noise region D. After the water filling process (figure 3.2b), the measure function g(x, y) which reflects the property of f (x, y) is obtained (figure 3.2c). Fi-nally the people are detected by a threshold operation on measure function g(x, y). Images taken from [122]
3.2.3. Results and performance
In order to test the performance of multi level segmentation and water filling algorithms, a restricted part of CBSR Dataset is used. Table 3.1 shows the results of algorithms in term of precision, recall and, f1-score.
The algorithms reach high values of performances, but often fail when the heads are along the edge of image. Multi level segmentation algorithm looks more accurate than water filling algorithm.
Table 3.1.: Image processing algorithms performances.
Algorithm Precision Recall F1-Score
Multi level segmentation 0.9390 0.9872 0.9625
Water filling 0.9365 0.7564 0.8369
3.3. Semantic segmentation with deep learning
approaches
Nowadays, one of the key problems in the field of CV is the semantic segmen-tation that is applied to 2D images, video, and even 3D data. Looking at the big picture, semantic segmentation is one of the high-level task that paves the way towards complete scene understanding.
Scene understanding started with the goal of building machines that can see like humans to infer general principles and current situations from imagery, but it has become much broader than that. Applications such as image search engines, autonomous driving, computational photography, vision for graphics, human machine interaction, were unanticipated and other applications keep
arising as scene understanding technology develops [32]. As a core problem of high level CV, while it has enjoyed some great success in the past 50 years, a lot more is required to reach a complete understanding of visual scenes.
In the past, such a problem has been addressed using different traditional CV and machine learning techniques. Despite the popularity of those kind of methods, the deep learning marked a significant change so that many CV prob-lems are being tackled using deep architectures, usually convolutional neural networks, which are surpassing other approaches by a large margin in terms of accuracy and sometimes even efficiency.
This section presents a particular case study describing five approaches from literature based on Convolutional Neural Network (CNN) architectures and implementation methods for semantic segmentation. Furthermore, a novel ap-proach with better performances is presented.
3.3.1. U-Net
U-Net architecture proposed in [99] is shown in figure 3.3. It is composed of two main parts:
• contracting path (left side); • expansive path (right side).
The first path follows the typical architecture of a convolutional network. It consists of the repeated application of two 3 × 3 convolutions (unpadded con-volutions), each followed by a Rectified Linear Unit (ReLU) and a 2 × 2 max pooling operation with stride 2 for downsampling. At each downsampling step, the number of feature channels is doubled. Every step in the expansive path consists of an upsampling of the feature map followed by a 2 × 2 convolution (“up-convolution”) that halves the number of feature channels, a concatenation with the correspondingly cropped feature map from the contracting path, and two 3 × 3 convolutions, each followed by a ReLU. At the final layer a 1 × 1 convolution is used to map each 32-component feature vector to the desired number of classes.
Similarly, the authors of [98] revisited the classic U-Net by removing two lev-els of max polling and changing the ReLU activation function with a LeakyReLU (figure 3.4).
Another U-Net architecture is proposed in this Thesis. The structure re-mains largely the same, but some changes are made at the end of each layer. In particular a batch normalisation is added after the first ReLU activation function and after each max polling and upsampling functions (figure 3.5).
Figure 3.3.: U-Net architecture.
Figure 3.4.: U-Net2 architecture.
3.3.2. SegNet
SegNet, presented by Vijay et al. in [3], is shown in Figure 3.6. The archi-tecture consists of a sequence of non-linear processing layers (encoders) and a corresponding set of decoders followed by a pixelwise classifier. Typically, each encoder consists of one or more convolutional layers with batch normalisation and a ReLU non-linearity, followed by non-overlapping max pooling and sub-sampling. The sparse encoding, due to the pooling process, is upsampled in the decoder using the max pooling indices in the encoding sequence. One key ingredient of the SegNet is the use of max pooling indices in the decoders to perform upsampling of low resolution feature maps. This has the important advantages of retaining high frequency details in the segmented images and also reducing the total number of trainable parameters in the decoders. The entire architecture can be trained end-to-end using stochastic gradient descent. The raw SegNet predictions tend to be smooth even without a Conditional Random Fields (CRF) based post-processing.
Figure 3.6.: SegNet.
3.3.3. ResNet
He et al. in [44] observed that deepening traditional feedforward networks often results in an increased training loss. In theory, however, the training loss of a shallow network should be an upper bound on the training loss of a corresponding deep network. This is due to the fact that increasing the depth by adding layers strictly increases the expressive power of the model. A deep network can express all functions that the original shallow network can express by using identity mappings for the added layers. Hence a deep network should perform at least as well as the shallower model on the training data.
The violation of this principle implied that current training algorithms have difficulties in optimizing very deep traditional feedforward networks. He et
al. proposed residual networks that exhibit significantly improved training characteristics, allowing network depths that were previously unattainable. A
xn − 1 F (xn − 1; Wn) + xn
Figure 3.7.: Residual Unit.
ResNet is composed of a sequence of residual units shown in Figure 3.7. The output xn of the n − th RU in a ResNet is computed as:
xn= xn−1+ F (xn−1; Wn) (3.9)
where F (xn−1; Wn) is the residual, which is parametrized by Wn. In this way,
instead of computing the output xn directly, F only computes a residual that
is added to the input xn−1. This design can be referred as skip connection,
since there is a connection from the input xn−1 to the output xn that skips
the actual computation F . It has been empirically observed that ResNets have superior training properties over traditional feedforward networks. This can be explained by an improved gradient flow within the network.
3.3.4. FractalNet
Fractal network is introduced by Larsson et al. in [59]. Let C denotes the index of a truncated fractal fC(·) (i.e., a few stacked layers) and the base case of a
truncated fractal is a single convolution:
f1(z) = conv(z)
According to the expansion rule:
z′= conv(z)
fC+1(z) = conv(conv(z′) ⊕ fC(z′))
can be defined recursively the successive fractals, where ⊕ is a join operation and conv(·) is a convolution operator. Two blobs are merged by the join opera-tion ⊕. As these two blobs contain features from different visual levels, joining them can enhance the discrimination capability of our network. Generally, this operation can be summation, maximization and concatenation.
In order to enlarge the receptive field and enclose more contextual informa-tion, downsampling and upsampling operations are added in the above expan-sion rule. In particular, a max pooling with a stride of 2 and a deconvolution also with a stride of 2 are added. After the downsampling operation, the re-ceptive field of a fractal becomes broader. When combining different rere-ceptive fields through the join operation, the network can harness multi-scale visual
cues and promote itself in discriminating.
The Fractal Net used in this section is depicted in figure 3.8.
Figure 3.8.: FractalNet.
3.3.5. Results and performance
This paragraph presents the results from several CNN architectures. Graphs and tables show the cost and performance during training and validation for heads detection task on TVHeads dataset. Each CNN implementation is trained with two types of depth images:
• 16-bit: original images acquired by depth sensor;
• 8-bit: scaled images in order to highlight the heads silhouette, improving the images contrast and brightness.
The general procedure for training neural network based models is to take the dataset and split it into three parts: training, validation, and test. In this case, train, test and validation are chosen respectively to learn model parameters. Once this is complete, the best model is also evaluated over the never before seen test set.
In following experiments, 70%, 10% and 20% of dataset are chosen respec-tively for train, test, and validation. Furthermore, different combinations of hyperparameters are tested, but a learning rate equal to 0.001 and an Adam optimization algorithm have been used.
Quantitative Evaluation
Semantic segmentation performances are divided into two different tables. Ta-bles 3.2 shows Jaccard and Dice indices for training and for validation respec-tively. While, Table 3.3 reported the results in term of accuracy, precision, recall and f1-score. Both tables refer to a learning process conducted during 200 epochs.
Table 3.2.: Jaccard and Dice indices of different CNN architectures.
Net Bit Jaccard Jaccard Dice Dice
Train Validation Train Validation
Fractal [59] 8 0.960464 0.948000 0.979833 0.973306 16 0.961636 0.947762 0.980443 0.973180 U-Net [99] 8 0.896804 0.869399 0.945595 0.930138 16 0.894410 0.869487 0.944262 0.930188 U-Net2 [98] 8 0.923823 0.939086 0.960403 0.968586 16 0.923537 0.938208 0.960249 0.968119 U-Net3 8 0.962520 0.931355 0.980902 0.964458 16 0.961540 0.929924 0.980393 0.963690 SegNet [3] 8 0.884182 0.823731 0.938531 0.903347 16 0.884162 0.827745 0.938520 0.905756 ResNet [44] 8 0.932160 0.856337 0.964889 0.922609 16 0.933436 0.848240 0.965572 0.917889
In Table 3.2, the best CNN architecture is the U-Net3 8-bit version. Indeed, Jaccard index reaches a value equal to 0.962520. The second best is Fractal Net 16-bit version also obtaining higher values as regards validation performances. For each network is highlighted in red colour the best bit version model.
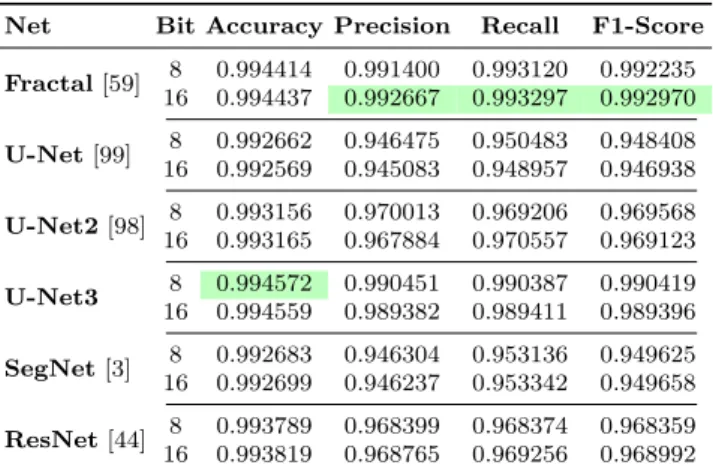
Table 3.3.: Semantic segmentation results of different ConvNet architectures.
Net Bit Accuracy Precision Recall F1-Score
Fractal [59] 8 0.994414 0.991400 0.993120 0.992235 16 0.994437 0.992667 0.993297 0.992970 U-Net [99] 8 0.992662 0.946475 0.950483 0.948408 16 0.992569 0.945083 0.948957 0.946938 U-Net2 [98] 8 0.993156 0.970013 0.969206 0.969568 16 0.993165 0.967884 0.970557 0.969123 U-Net3 8 0.994572 0.990451 0.990387 0.990419 16 0.994559 0.989382 0.989411 0.989396 SegNet [3] 8 0.992683 0.946304 0.953136 0.949625 16 0.992699 0.946237 0.953342 0.949658 ResNet [44] 8 0.993789 0.968399 0.968374 0.968359 16 0.993819 0.968765 0.969256 0.968992
As in the previous case, also in the Table 3.3 the best CNN architecture, in terms of accuracy, is U-Net3 8-bit version. While, Fractal Net 16-bit version exceeds slightly in precision, recall and f1-score metrics.
In Figure 3.9 is shown for each CNN the trend of Jaccard index during the fit procedure. It is easy to see how the Fractal Net and the ResNet reach high values immediately after a few epochs. Instead, the U-Net3 increases its value more slowly. The classic U-Net is always below all other networks.
0 20 40 60 80 100 120 140 160 180 200 Epochs 0 0.1 0.2 0.3 0.4 0.5 0.6 0.7 0.8 0.9 1 Jaccard Index JU-Net316 JU-Net38 JFractalNet16 JFractalNet8 JResNet16 JResNet8 JSegNet16 JSegNet8 JU-Net216 JU-Net28 JU-Net16 JU-Net8
Figure 3.9.: Jaccard index trends.
In a similar way, in Table 3.10, for each network is shown the Jaccard index trend also during the validation period.
Qualitative Evaluation
Table 3.4 presents qualitative semantic segmentation results. The table shows the predicted images for each architecture. The best results are obtained by using the U-Net3 (8 and 16 bit). While, typical U-Nets and SegNet provide shapes of heads more smooth and rounded.
Table 3.4.: Qualitative result of prediction.
8-bit 16-bit Label
FractalNet [59] U-Net [99] U-Net2 [98] U-Net3 SegNet [3] ResNet [44]
0 50 100 150 200 Epochs 0 0.1 0.2 0.3 0.4 0.5 0.6 0.7 0.8 0.9 1 Jaccard Val JaccardFractal8 Train JaccardFractal
8
(a) Fractal Net 8-bit.
0 50 100 150 200 Epochs 0 0.1 0.2 0.3 0.4 0.5 0.6 0.7 0.8 0.9 1 Jaccard Val JaccardFractal16 Train JaccardFractal
16
(b) Fractal Net 16-bit.
0 50 100 150 200 Epochs 0 0.1 0.2 0.3 0.4 0.5 0.6 0.7 0.8 0.9 1 Jaccard
Val JaccardU-Net 8 Train JaccardU-Net8 (c) U-Net 8-bit. 0 50 100 150 200 Epochs 0 0.1 0.2 0.3 0.4 0.5 0.6 0.7 0.8 0.9 1 Jaccard
Val JaccardU-Net 16 Train JaccardU-Net16 (d) U-Net 16-bit. 0 50 100 150 200 Epochs 0 0.1 0.2 0.3 0.4 0.5 0.6 0.7 0.8 0.9 1 Jaccard
Val JaccardU-Net2 8 Train JaccardU-Net28
(e) U-Net2 8-bit.
0 50 100 150 200 Epochs 0 0.1 0.2 0.3 0.4 0.5 0.6 0.7 0.8 0.9 1 Jaccard
Val JaccardU-Net2 16 Train JaccardU-Net216
(f) U-Net2 16-bit. 0 50 100 150 200 Epochs 0 0.1 0.2 0.3 0.4 0.5 0.6 0.7 0.8 0.9 1 Jaccard Val JaccardU-Net38 Train JaccardU-Net38 (g) U-Net3 8-bit. 0 50 100 150 200 Epochs 0 0.1 0.2 0.3 0.4 0.5 0.6 0.7 0.8 0.9 1 Jaccard Val JaccardU-Net316 Train JaccardU-Net316
(h) U-Net3 16-bit. 0 50 100 150 200 Epochs 0 0.1 0.2 0.3 0.4 0.5 0.6 0.7 0.8 0.9 1 Jaccard Val JaccardSegNet8 Train JaccardSegNet8
(i) SegNet 8-bit.
0 50 100 150 200 Epochs 0 0.1 0.2 0.3 0.4 0.5 0.6 0.7 0.8 0.9 1 Jaccard Val JaccardSegNet16 Train JaccardSegNet16 (j) SegNet 16-bit. 0 50 100 150 200 Epochs 0 0.1 0.2 0.3 0.4 0.5 0.6 0.7 0.8 0.9 1 Jaccard Val JaccardResNet8 Train JaccardResNet
8 (k) ResNet 8-bit. 0 50 100 150 200 Epochs 0 0.1 0.2 0.3 0.4 0.5 0.6 0.7 0.8 0.9 1 Jaccard Val JaccardResNet16 Train JaccardResNet
16
(l) ResNet 16-bit.

![Figure 2.5.: UR Fall Detection Dataset. Image taken from [52]](https://thumb-eu.123doks.com/thumbv2/123dokorg/2970312.27249/32.680.184.496.207.515/figure-ur-fall-detection-dataset-image-taken.webp)


![Table 4.2.: Time [s] of registration for each session and the number of people of that session.](https://thumb-eu.123doks.com/thumbv2/123dokorg/2970312.27249/57.680.127.554.138.353/table-time-s-registration-session-number-people-session.webp)


