Electronics 2019, 8, 1180; doi:10.3390/electronics8101180 www.mdpi.com/journal/electronics
Article
A Real-Time Decision Platform for the Management
of Structures and Infrastructures
Massimo Merenda 1,2,*, Filippo Giammaria Praticò 1, Rosario Fedele 1, Riccardo Carotenuto 1
and Francesco Giuseppe Della Corte 1,2
1 Department of Information Engineering, Infrastructure and Sustainable Energy (DIIES),
Università Mediterranea di Reggio Calabria, Via Graziella Loc. Feo di Vito, 89124 Reggio Calabria, Italy; [email protected] (F.G.P.); [email protected] (R.F.); [email protected] (R.C.);
[email protected] (F.D.C.)
2 HWA srl-Spin Off dell’Università Mediterranea di Reggio Calabria, Via Reggio Campi II tr. 135,
89126 Reggio Calabria, Italy
* Correspondence: [email protected]; Tel.: +39-0965-1693-441
Received: 30 September 2019; Accepted: 15 October 2019; Published: 17 October 2019
Abstract: Natural disasters and the poor management of civil engineering structures and
infrastructures require timely action and new tools such as specially designed structural health monitoring platforms. This paper proposes an innovative platform based on a network of wirelessly connected, low-power, and renewable-energy-fed sensor units. The platform is a multipurpose tool for diagnostics, maintenance, and supervision, capable of simultaneously carrying out damage detection, localization, identification, and “multiclass” and “multi-material” level quantification of different types of failures. In addition, it works as a decision support tool for emergency management and post-disaster assessment, here tailored for an Italian theme park. The platform uses innovative algorithms based on the concept of the vibro-acoustic signature of the asset monitored. The vibro-acoustic signatures of the monitored assets are gathered by the microphones and accelerometers of the platform’s sensor units. Then, almost simultaneously, they are analyzed using specifically designed wavelet-based and convolutional-neural-network-based algorithms, which are able to extract crucial information about the structural and environmental conditions of both the asset and the areas of the thematic park. In addition, the platform shows escape routes during an emergency, indicating meeting points and helping people to proceed safely along a recognizable escape route to a safe place, as demonstrated by the simulations.
Keywords: decision platform; emergency management; sensors network; structural health
monitoring; theme park
1. Introduction
Emergencies caused by interaction between catastrophic and accidental natural events, such as earthquakes, sudden floods or fires, and deficiencies in appropriate management activities, increasingly affect structures and infrastructures.
On the one hand, in order to manage these particular events, a high level of attention should be paid during the design and management of the abovementioned assets. Such a level of attention should be exponentially increased when highly populated areas, such as urban contexts (e.g., underground station; see [1]), occasional gathering points for crowds where safety drills cannot be taught and prepared [2], or theme parks [3], are involved.
On the other hand, it is difficult to find real applications for complex technologies such as sensor-based monitoring platforms which are (i) included during the assets’ design; (ii) installed on existing
assets to monitor their structural conditions; and (iii) designed to provide specific information that can be a decisive support during emergency situations [4,5], e.g., enhancing evacuee safety in order to reduce the number of injuries and deaths [6] or increasing the efficiency of the post-disaster operations (e.g., search and rescue operations; see [7]). Furthermore, future smart cities will need integrated monitoring and decision platforms to obtain smart infrastructures ensuring [8] high levels of (a) comfort; (b) efficiency; (c) sustainability; and (d) autonomy (i.e., less dependent on or independent from the management activities). In order to ensure this performance, some perspective changes are needed. A good starting point could be the transition from fault-based maintenance to predictive maintenance [9]. From this point of view, the traditional methods and technologies that assess the conditions of the assets, which are the focus of failure-based maintenance, should be replaced with innovative methods that provide useful information for predictive maintenance and define the proper budget for maintenance interventions [10].
As is well known, destructive and test-based methods are commonly used to assess the “state of health” of a structure. Even though this is a well-established and accurate approach, it is possible to state that it can be now considered unsustainable because of its main drawbacks, i.e., (i) it needs energy and resources to extract samples (e.g., cores); (ii) it provides local (i.e., sample-based) or incomplete (i.e., visual-based) information; (iii) it lacks efficiency, simplicity, and attractiveness (in terms of costs and applicability); (iv) samples are sent to landfill after the analyses; and (v) it does not offer a holistic approach to overcome problems of different nature, i.e., related to different structures, materials, and conditions [4].
Based on the drawbacks mentioned above, different new systems have been developed and presented in the last decades to carry out the structural health monitoring (SHM) of civil engineering structures and infrastructures, like buildings, bridges, and roads [11,12]. The systems mentioned above have the following main characteristics: (i) they use nondestructive tests (NDTs) to carry out the measurements and to collect data that represent the assets’ structural health conditions; and (ii) they implement smart technologies to carry out more efficient and sustainable measurements and analyze the data collected (often big data) during the measurements (e.g., information and communication technologies, Internet of Things solutions, artificial intelligence, cloud computing, etc.; see [8,13]).
Despite the high number of NDT-SHM solutions proposed in recent years, none of these has a sufficient level of development that allows for performing, at the same time, damage detection, location, type identification, and level quantification (i.e., all the purposes of the SHM; see [14]). Furthermore, they cannot be defined as “multiclass” or “multi-material”, i.e., they are not able to monitor different types of failures (e.g., delamination and vertical cracks, or concealed and surface, etc., [15,16]) or materials (e.g., asphalt concrete and cement concrete; see [4]).
Based on the above, in the study presented here, we propose an innovative NDT-SHM platform, specially designed to be implemented in a theme park and aimed at providing crucial information on the structural health status of the various types of structures. From the information gathered through the platform, it is possible to effectively support the park's emergency management, i.e., to identify escape routes during an emergency, to deal with a predetermined emergency through well-designed action plans, and to indicate the safe locations available after the disaster or collection points for the crowds in the theme park. In order to ensure sustainability, efficiency, and reliability, the platform was designed to include wireless low-power sensors powered by renewable energy (i.e., gathered though a photovoltaic system). Appropriate algorithms for data processing were developed to extract crucial information from the raw data collected by the sensors.
The main requirements of the following official regulations were taken into account during the platform design: (i) Decision 1313/2013/EU (improvement of the civil protection systems for preventing, preparing for, and responding to natural and man-made disasters); (ii) Regulation 525/2013/EU (greenhouse gas emissions and climate change monitoring); (iii) Directives 2015/996/EC and 2002/49/EC (assessment and control of environmental noise); and iv) Directive 2018/0129/EC (road infrastructure safety management).
Finally, the proposed platform shares some points with the European project SIBYL (which is related to the seismic monitoring and vulnerability framework for civil protection; see [17]) and with the Italian project PRIN2017XYM8KC (“Urban safety, sustainability, and resilience: 3 paving solutions, 4 sets of modules, 2 platforms.” Acronym: USR342.). Furthermore, it strongly complies with the Italian regional project SICURVIA (in progress).
2. Platform Description
2.1. Objectives and Motivations
This section presents an innovative modular platform NDT-SHM specially customized to adapt to the characteristics of a specific Italian theme park. It aims at minimizing the risks related to different emergency scenarios (for example, earthquakes, fires, landslides, displacements, flash floods, excess environmental warning thresholds, etc.) providing data and information of different nature in real time, such as:
1. type, position, and possible extension of the potential failure or event occurred; 2. environmental conditions of the area involved in the emergency;
3. number of people probably involved (i.e., probably present in the area of interest);
4. safest and quickest predefined escape routes (e.g., roads and bicycle and pedestrian paths for outdoors, stairs for indoors) that people involved should follow;
5. positions and sizes of predefined meeting points and places of ultimate or total safety (e.g., buildings, external space, etc.);
6. places where rapid and efficient first aid is needed; 7. safest and quickest routes for first aid;
8. access routes (internal and external) still available;
9. functioning status and performances of each platform’s component (self-diagnostic); 10. smoke alarms actually involved;
11. escape directions, primary exits, alternative exits, evacuation diagrams, main streets, main tenancies available, and main assembly points available.
Several stakeholders were considered as the target of the information provided by the platform, such as the workers of the park, the visitors, the authorities, and the civil protection agencies (according to the current standard and regulations).
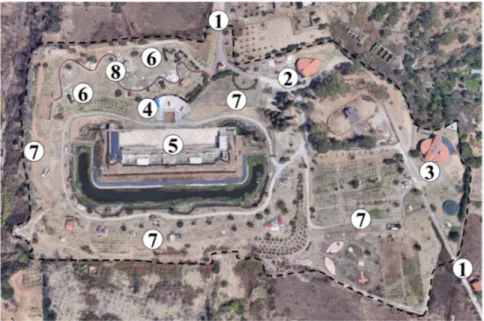
The specific theme park under consideration (named “Ecolandia”, located in Reggio Calabria, Italy) is a complex system to monitor because it includes structures of different nature and scope. In more detail (see Figure 1), it consists of (1) two different access routes (south and northeast); (2) several buildings used as offices; (3) one building used as a restaurant; (4) one amphitheater used to host events and concerts; (5) one historical military fortress, which is surrounded by a moat filled with water and is used for educational purposes through rooms that contain instruments and expensive devices; (6) different recreational areas for children; (7) several green areas; and (8) one bicycle path.
It is important to stress that the park lacks a system that is able to manage the crowd, especially during an emergency, taking into account the high complexity of the park. Furthermore, the park has been selected by the authorities as gathering point in case of disaster.
Figure 1. Satellite image of the theme park. Note the boundaries of the park (dotted line) and the different areas, i.e., (1) access roads, (2) offices, (3) restaurant, (4) amphitheater, (5) military fortress, (6) area for children, (7) green areas, and (8) bicycle path.
2.2. Component Description
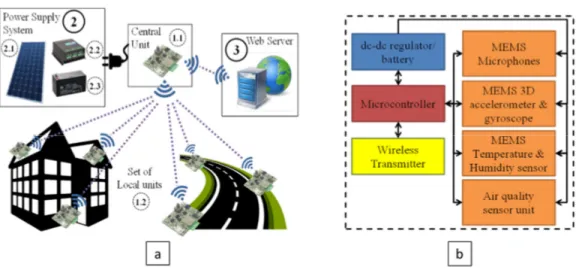
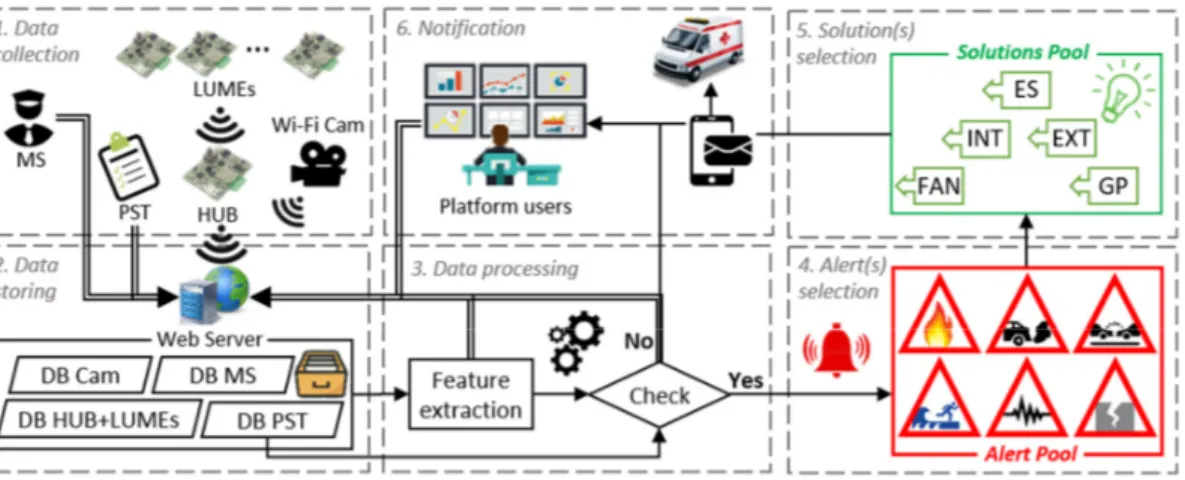
Figure 2 provides a schematic representation of the main components of the platform. In particular, each module of the platform consists of one central control unit (herein called HUB) and several local units (herein called LUMEs). The wireless network of the LUMEs is controlled by the HUB. It is important to underline that the HUB unit acts like an airplane’s flight recorder, and for this reason it is located in a safe site. It is able to temporarily store (by means of a solid-state memory) both the data collected and sent by each LUME and the data collected by its own sensor devices. In fact, the HUB contains the same sensors as a LUME unit (see Figure 2) and it is equipped with a camera which allows automatic video streaming in case of emergency. Further details about the single units are provided in the following.
The number of LUME units is determined on a case-by-case basis by the characteristics of the structure to monitor. Based on the most relevant areas of the park, we planned to use at least eight HUBs. To define the strategic points in which they should be installed, the following provisional locations were taken into consideration: (i) the points where damage or breakdown of the structure is most likely to occur; (ii) the main escape routes; and (iii) the meeting points.
Each module of the platform is powered through the same power supply system that consists of (a) one photovoltaic solar panel; (b) one recharging circuit; and (c) one battery.
As shown in Figure 2, each sensor unit contains (a) one dc–dc regulator; (b) one microcontroller used to manage sensors; and (c) different sensors, e.g., temperature and humidity sensor, air quality sensor, 3D accelerometer and gyroscope, and a microphone. Note that the schematic of the sensor units contained in both HUB and LUME is shown in Figure 2. Figure 2a illustrates the HUB (1.1), the LUMEs (1.2; along the main routes and in the buildings), and the power supply system (2) of the HUB. This latter consists of a photovoltaic panel (2.1), a recharging circuit (2.2), and a battery (2.3). The Web server (3) and the power supply system are depicted. Figure 2b refers to the content of each sensor unit (i.e., HUB and LUMEs), where the dc–dc regulator is included in the HUBs because it is connected to the power supply system, while the battery powers the LUME.
Figure 2. Schematic representation of the main parts of the nondestructive test–structural health monitoring (NDT-SHM) platform: (a) main components of the system; (b) main components of each sensor unit, based on Micro-Electro-Mechanical Systems (MEMS) sensors.
The motivations behind the choice of each component of the platform are as follows.
1. Power supply system: The theme park has its own photovoltaic system, and having a power supply system in the platform (to power the HUBs) contributes to obtaining a more sustainable, efficient, and reliable platform. The power consumption of the platform was estimated by considering the sampling frequency of the sensors used, the duty cycle of operation of the sensors, the microcontroller, and the wireless transmitter used. In more detail, each sensor unit needs about 1 Wh per day (see [18]). This was estimated by considering the following operational conditions: (i) a sampling frequency of 1 kHz for 3D accelerometers and gyroscopes, 44 kHz for microphones, and 0.1 kHz for temperature–humidity sensors and air quality sensors; (ii) the microcontroller works at 1 MHz; and (iii) 1%, 10%, and 10% are the operation duty cycles of the microcontroller, the sensors, and the transmitter, respectively. In addition, the average solar radiation on the areas of the theme park is about 5000 Wh/m2/day, and under the hypotheses of using a photovoltaic (PV) panel with an
efficiency of about 14% connected using a cable with an efficiency of about 85%, a PV panel of at least 10 × 15 cm2 should be used to collect the energy required to power one sensor unit. The HUB requires
an extra amount of energy of about 4–5 Watts when also equipped with a camera [19]. Furthermore, the power supply system requires a recharging circuit (consisting of an off-the-shelf electronic board) in order to efficiently convert the variable voltage obtained from the solar panel (during the operating time) to a fixed voltage (or fixed current, depending on the type of recharge) for optimal recharge of the battery. Nevertheless, the recharging circuit is also deputed to the charge control of the batteries to avoid overcharging and undesirable issues. Finally, the HUBs are powered using a power supply system that was dimensioned by considering the daily energy consumption of each sensor unit (i.e., 1 Wh/day); under the hypotheses of using a battery with a maximum depth of discharge of 50% and an efficiency of 80%, and to obtain a system with an autonomy of 15 days, a battery with a nominal voltage of 12 V and a capacity of 3 Ah was selected from different possibilities. The LUMEs are powered using button or coin cell batteries, e.g., CR2032.
2. Sensors: (a) The temperature and humidity sensors [20] were included because they allow for detecting variation in environmental conditions; (b) a Micro-Electro-Mechanical Systems (MEMS) 3D accelerometer [21] was included to monitor seismic waves travelling into the structures (vibrational signature), which are generated by different sources such as running crowds, vehicles passing by, or earthquakes; nevertheless, thanks to the DC response accelerometer used, the inclination can be inferred from the gravity acceleration projections on the three axes by using proper trigonometric functions; (c) a MEMS 3D gyroscope [21] was included to monitor the angular displacements of the structures monitored; (d) two MEMS microphones [22] were included to monitor the sound waves travelling through the structures (acoustic signature) and the airborne noise
(noise pollution); and (e) air quality sensor units [23,24] were included to detect the presence of unpleasant gasses and volatile substances (e.g., smoke or particulate matter) that can be used to identify the occurrence of fire or the exceeding of risk thresholds (air pollution).
Furthermore, the weather conditions are also monitored using, as a support, several websites which provide weather-related data in different formats (e.g., JSON, HTML, etc.) that are periodically and automatically downloaded by the platform. These data are used by the platform to provide additional information related, for example, to wind direction, speed (particularly useful during a fire or if smoke or unhealthy substances are present in the air), the probability of occurrence of flash flood, and of high temperatures in summer.
Note that the algorithms we employed implement an innovative method that allows for deriving the structural health conditions of the structures from their vibro-acoustic response [25,26].
3. Microcontroller: This component is devoted to executing software routines, reading
sensors, data gathering, data transmission, and the management of logical and power states. The operations of every single HUB and LUME are supervised by a different microcontroller that interacts with the others in the wireless sensor network (WSN) data exchange. The LUME and the HUB feature a D51 module (Dynastream Innovations, Cochrane, Alberta, Canada) that includes a nRF51422 chip (Nordic Semiconductor ASA, Oslo, Norway), equipped with a 16 MHz ARM Cortex M0 processor, and a radio that supports 2.4 GHz communication protocol ANT or Bluetooth, which will be introduced in the next paragraph.
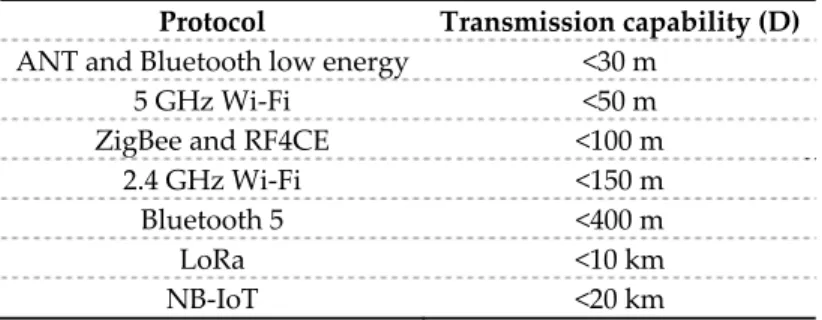
4. Wireless Transmitter: In order to obtain an efficient and reliable monitoring system in terms of high-speed data transmission, the following points should be carefully analyzed during the design process [27]: (i) devices with high power transmission and high sensitivity (i.e., high signal-to-noise ratio, SNR) should be chosen; (ii) the real operating environment should be carefully analyzed (e.g., considering any obstacles that may affect the transmission distance); (iii) the frequency of the RF carrier should be taken into account; and iv) design layout, mechanics, and coding schemes to the application should be customized case by case [28–32]. Recent protocols for low-power, long-distance data transmission include i) several low-power wireless protocols (LPW; see [27]), i.e., ANT, 2.4 and 5 GHz Wi-Fi, ZigBee, Radio Frequency for Consumer Electronics (RF4CE), Bluetooth low energy, and Bluetooth 5, where ANT is a wireless personal network protocol; (ii) two low-power wide-area networks (LPWAN; see [33]), i.e., narrow-band Internet of Things (NB-IoT) and long-range, low-power wireless platform (LoRa). Frequency band(s), network topology support, data transmission rate, range or transmission capability, and coexistence must be considered to select the more suitable protocol [27,34], bearing in mind that a trade-off between power consumption, bandwidth occupation, and range leads to finding the best solution. Focusing on the transmission capability, in terms of distance D between LUME and HUB or HUB and server, the limits in Table 1 can be considered for the selection of the protocol suitable for each application.
Table 1. Transmission capabilities of the protocols suitable for each application.
Protocol Transmission capability (D)
ANT and Bluetooth low energy <30 m
5 GHz Wi-Fi <50 m
ZigBee and RF4CE <100 m
2.4 GHz Wi-Fi <150 m
Bluetooth 5 <400 m
LoRa <10 km
NB-IoT <20 km
In more detail, the HUB was designed to be able to provide higher performance in comparison with the LUME units. This performance especially relates to the transmission of the data gathered and received from the LUMEs to the Web server. In particular, the HUB is equipped with a Wi-Fi transmitter (2.4 GHz Wi-Fi) while the LUMEs are equipped with devices with lower transmission capability (ANT or Bluetooth low energy) than those installed in the HUBs.
The proposed platform uses a Web server to perform data processing in real time with innovative and customized algorithms. These algorithms were developed to easily detect changes in environmental (e.g., air pollution level), functional (e.g., inaccessible road), and structural conditions (e.g., structural failure) for the park. The information extracted during the data processing is then transmitted at high frequency to the users of the platform by a specially designed dashboard that is accessible from the Web (i.e., through any PC, smartphone, tablet, etc.). The algorithms employed, their descriptions, and their functions in the platform are discussed in the following section.
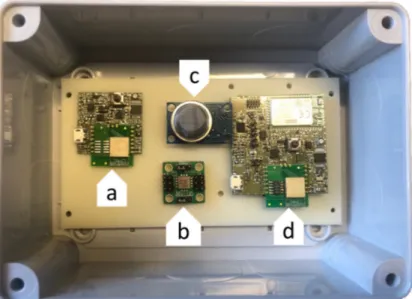
Figure 3 shows the main electrical components and boards of LUMEs and HUBs, which are contained in a IP65 electrical enclosure for outdoor applications.
Figure 3. Electronic components and boards of the local and central control units herein called “LUME” and “HUB” inside an outdoor IP65 electrical enclosure: (a) LUME board; (b) accelerometer; (c) air quality sensor; (d) HUB board.
3. Software Platform
3.1. Platform Server Specifications
A well-designed monitoring platform should carefully consider where the data need to be processed and how the data transmission process can be kept secure. It is preliminarily required to consider if it is better to process data locally or to store and query the data remotely. Consequently, each operation should be carefully analyzed, and a trade-off between local and remote operations should be defined. Possible trade-off solutions include the following: (i) to minimize the amount of data exchanged on the network (e.g., preferring local data processing or reducing the sampling frequency of the sensors); (ii) to offload burdensome and important tasks to a more powerful machine (e.g., a remote server), saving time and energy (otherwise locally required by the sensor units); and (iii) to use custom developed application programming interfaces (APIs) that allow safe data transmission, especially to the platform users and all the stakeholders.
For instance, using a cloud server to process the acoustic data collected by the microphones of the platform, the following benefits can be obtained: (1) the power consumption of the battery-powered local module is reduced; (2) it is possible to use more powerful computational hardware and better-performing software; and (3) each local unit, instead of consuming power in calculations, will continue running smoothly, staying focused on quickly collecting data. Meanwhile, with the exception of the occurrence of an alert condition, the environmental data (e.g., the air temperature) are processed locally with a low frequency, and this will reduce the data flow in the network.
In order to provide more information about the design of the APIs, the terms REST and JSON are defined. REST stands for representational state transfer [35] and is a widespread style used to design APIs. REST relies on stateless, client–server, cacheable communications. RESTful services (i.e., the REST applications; see [35]) use HTTP requests to carry out the four CRUD (create/read/update/delete) operations, i.e., POST = create, PUT = create and/or update, GET = e.g., make queries, and DELETE = delete data. JSON stands for JavaScript object notation and is a language-independent format (lightweight text-based open standard) used for serializing and transmitting structured human-readable data over a network connection [36], mainly designed for server–Web applications and communications. Consequently, in this application, the JSON format was used to provide public data using Web services and APIs.
Finally, specific needs in terms of performance, scalability, administrative features, resources scaling, costs, migration features, data protection, and data export should be considered to select the best-fitting server. Bearing in mind all the considerations defined above, a cloud-hosted solution with proper scaling and migration features at a reasonable cost (guaranteed by the provider) was selected in this application, fulfilling the project’s requirements.
3.2. Platform Architecture and Tasks
In this section, the architecture (see Figure 4) and the main tasks carried out by the platform are defined and explained. Each module of the platform (i.e., several LUMEs wirelessly connected to one HUB) was designed to carry out the following tasks:
1. Recording of the raw data detected by the sensor units of the each LUME in the solid-state memory of the HUB;
2. Recording, in the solid-state memory of the HUB, of the data detected by the sensor units and the cameras of the HUB;
3. Sending, wirelessly, in JSON format, the data previously collected in the HUB to the dedicated Web server;
4. Saving the data sent by the HUB in a specific database of the cloud server (i.e., DB
LUMEs+HUB, where DB stands for database);
5. Storing (in a specific database of the server, i.e., DB MS), the data collected by the current management system (MS) of the park (e.g., number of visitors in a given area of the park); 6. Storing, in a specific database of the cloud server (i.e., DB Cam), the data collected by the
cameras mounted on the HUB;
7. Storing, in a specific database of the cloud server (i.e., DB PST), the data collected during periodical simulations and tests (PST). These tests will be carried out, from time to time, to assess the conditions of each module of the platform and to simulate probable and dangerous events that might occur in the park (e.g., fire, air pollution, accident along the access roads, passage of heavy vehicles, flood, induced structural failure);
8. Defining specific sets and sequences of thresholds for each probable and dangerous event
using the data of the DB PST. More details about this task are provided in the following;
9. Processing the data contained in the DB LUMEs+HUB (sensor data), DB Cam (video frames),
and DB MS (miscellaneous data), to extract predefined parameters (e.g., features such as the mean value or the root-mean-square value, etc.) that represent the information content of the data stored in the three DBs. More details about this task are provided in the following; 10. Comparing, in real time, the extracted parameters with the thresholds mentioned above (i.e.,
data stored in DB PST). This is the core task of the platform. Through this comparison, it is possible to understand if the platform is detecting regular conditions (Check = No; see Figure 4) or the occurrence of one or more emergency events (Check = Yes; see Figure 4), which are selected among a set of predefined probable events (alert pool). More details about this task are provided in the following;
11. Providing in real-time, in case of regular conditions (Check = No), the results of the comparison above to the platform users by means of a specifically designed platform dashboard. Furthermore, the dashboard provides, in real time, the data collected by each sensor units and by the current management system;
12. Carrying out in real time, in case of emergency (Check = Yes), the following subtasks:
i. Making a classification of the occurred event(s) as recurrent or complex problem(s), using a set of alerts that includes six events, i.e., fire, air pollution, route(s) not available, flood, excessive vibration/noise pollution, and structural failure (see triangles in Figure 4); ii. Triggering several alerts (set of alerts);
iii. Identifying the most effective solutions (i.e., the ones that minimize the risks) to the emergency event(s) identified above among a set of predefined (easy) solutions (ES), or complex solutions (INT+EXT+FAN+GP, see Figure 4), which include the indication of more appropriate first aid needed (first aid needed, FAN);
iv. Sending one predefined alert message to the platform users, together with the most effective solution to follow (notification);
v. Alerting the most appropriate first aid (FAN).
Figure 4. Platform architecture.
3.2.1. Periodic Simulations
In order to provide more details about the periodic simulations and tests (PST), it is possible to state that thresholds used during the data processing are defined based on the PST results. PST are carried out to reproduce conditions related to unusual events. These events can produce light or heavy effects on the structures and the areas of the park. Light effects (associated with low risks and easy solutions) are, for example, (1) obstacles or car accidents on the access roads of the park, (2) high-intensity rain, (3) sudden illness of a visitor to the park, etc. To this end, periodical simulations are carried out, e.g., by (1) placing cars along the roads, (2) using hydrants, etc. This allows for evaluating the response time of the platform and of first aid (according to the authorities). Meanwhile, high effects (associated with high risks and complex solutions) may be (a) structure failures, (b) fires, (c) earthquakes, or (d) flash floods. These occurrences are periodically simulated, e.g., by (a) generating controlled and restorable cracks on the structures (i.e., roads, building, stairs of the amphitheater, walls of the historical fortress, etc.); (b) lighting a controlled fire; (c) using a tapping machine, a running crowd, or the passing-by of a heavy vehicle to simulate high-intensity vibrations; (d) pouring
large volumes of water in areas subject to flood, etc. The thresholds related to predefined events (set of alerts; see Figure 4) and their possible sequences or combinations are determined using the data collected during the simulations above, the innovative SHM method, and the two approaches (feature-based and machine-learning-based) illustrated in the following.
3.2.2. Data Analysis
It is important to underline that the above platform is able to apply an innovative SHM method [18,26,37]. This method aims at identifying and monitoring the structural conditions (e.g., occurrence and propagation of structural damage) of an asset through specific analyses of the vibro-acoustic signature of the monitored asset. In greater detail, the vibro-acoustic signature of a structure refers to the seismic and acoustic signals that are generated by a source (for example, a car on a road or a crowd of people on stairs), are transmitted by the structure, and are received by an accelerometer or a microphone attached to the surface of the structure. The aforementioned method considers the structure monitored as a filter of mechanical waves and associates the variation over time of the structure's ability to filter the waves with the deterioration of the structural health status of the structure under examination. Figure 5 reports examples of signals recorded using the sensor units during the in-lab system setup.
Figure 5. Typical signals (AR = Acoustic response) recorded by the sensor units: by the accelerometer (b) and the microphone (c) after the controlled impulse load (a) used during the in-lab setup of the system.
To recognize variations in the structural, environmental, and functional conditions of the theme park, a combination of two different approaches is used by the platform algorithms. The first approach is a feature-based approach (see feature extraction; Figure 4). Every time a set of data arrives at the Web server, these data are analyzed in three different domains (i.e., time domain, frequency domain using fast Fourier transform, and time–frequency domain using the continuous wavelet transform). This analysis aims at recognizing and extracting a set of meaningful features (i.e., parameters able to represent the variations of the signals over time). These features were selected during the preliminary tests that were carried out to set up the algorithms of the platform. In particular, the abovementioned tests aimed at recreating expected structural and environmental scenarios or events, such as the generation of cracks in the road pavement due to the repeated passages of vehicles. In more detail, road pavement with the same characteristics as the access routes of the park was progressively damaged (i.e., three lines of holes were drilled in the bituminous layers of the road pavement), and a suitable number of acoustic signals (4000 signals at the sampling frequency of about 1.9 kilo samples/second) was recorded using one sensor unit during the passage of different vehicles (used as a mechanical source of noise and vibrations). The acoustic signals represent the acoustic responses (ARs) of the road pavement to the vehicle loads.
Subsequently, the ARs were analyzed in order to recognize a suitable number of features that were able to represent the variation in the vibro-acoustic signature of the road [38]. In particular, the following features were selected for the monitoring of the road pavement structural conditions: i) in the time domain, the differences between the amplitudes (herein called Δa) and the arrival times (herein called Δt) of the absolute maxima and minima, and the standard deviation (herein called σ) of the signals; ii) in the frequency domain, the absolute maxima of the power spectral density (herein called PSDmax, see Equation 1) in the frequency range 20–500 Hz, the spectral centroid (fc; see Equation 2) in the frequency range 20–500 Hz, and the slope (herein called Slope) of the linear regression of the spectrum in the frequency range 20–500 Hz; iii) in the time–frequency domain, the entropy (herein called EntCWC) and the maximum energy (herein called EngCWC) of the of the Continuous Wavelet Coefficients (CWCs) calculated using Equations 3–6 and the pseudo-frequency (herein called p-fWR) associated with the highest values of the CWCs (the wavelet ridge) derived from the scalograms (i.e., graphs that show, in the time–frequency domain, the variation in the CWCs’ amplitudes with a color scale that ranges from 0 to 64).
Equation 1 was used to derive the power spectrum density (PSD versus frequency) [39]:
Fs
N
FFT
PSD
⋅
⋅
=
22
(1)where FFT stands for fast Fourier transform, N is the signal’s length (samples), and Fs represents the sampling frequency used to collect the signals (samples per second). Based on the literature, the PSD was expressed in decibel watts per Hz (dBW/Hz).
The spectral centroid (fc) represents the “center of mass” of the power spectrum and was determined using the following formula [40]:
− = − =⋅
=
1 0 1 0 N n n N n n n cp
f
p
f
(2)where fc is the spectral centroid (Hz), N is the sample length of the acoustic signal; pn represents the weights (dBW/Hz), i.e., the values on the y axis of the spectrum; and fn is the frequencies (Hz) on the
The continuous wavelet transform (CWT), which was used to calculate the CWCs, was applied using the following expression [41]:
( )
a
,
b
x
( )
t
*
a
,
b
( )
t
dt
,
CWT
+
∞
⋅
ψ
∞
−
=
(3)where a is the scaling parameter and is a vector of positive elements which allows for dilating or contracting the basic function or mother wavelet ψ (cf. [42,43]); b is the shifting parameter, which permits the translation of the Mother Wavelet (MW) ψ along the x axis (time); x(t) is the signal to be transformed; t stands for time; and ψ* is the complex conjugate of the MW function ψ chosen.
Equation 4 was used to derive the Shannon’s entropy of the CWCs (herein called EntCWC; [43]), which represents the degradation of the mean of transmission (i.e., the road pavement) of the vibro-acoustic signals due to the presence of the induced damage (i.e., the drilled holes). For each scale factor a, the value EntCWC was calculated using the following expression [43]:
( )
log
,
1 2 i N i i CWCa
p
p
Ent
=⋅
−
=
(4)where N is the length of each signal and pi is the energy probability distribution of the continuous wavelet coefficients (CWCs), for i = 1, 2, …, N, which can be calculated through the expression [43]
( )
( )
,
,
2a
Eng
i
a
CWC
p
i=
(5)where EngCWC(a) represents the energy content of the CWCs for each scale factor a. In more detail [43], the variable EngCWC(a) can be calculated from the matrix CWCs, for b = 1, 2, …, N (with N equal to the length of each signal), using the following expression:
( )
=
( )
b
CWC
a
CWC
a
b
Eng
,
2.
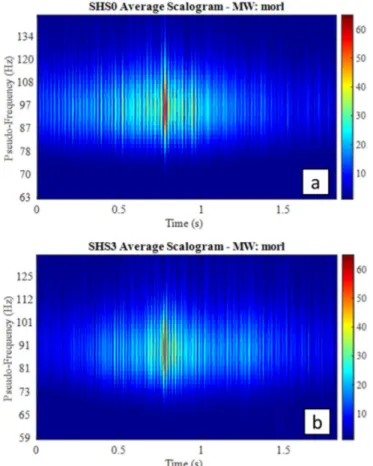
(6)In order to show some examples of how the features extracted represent the variation of the structural health status of the road pavement, the following figures are presented. In particular, Figure 4 shows the average scalograms related to the conditions SHS0 (i.e., road pavement without holes) and SHS3 (i.e., road pavements cracked using three lines of 46 holes). The scalograms were calculated using the MW called “morl”.
Figure 6. Scalograms, obtained using the Mother Wavelet (MW) “morl”, used to recognize the variation of the Structural Health Status from (a) SHS0 to (b) SHS3 in the road pavement under test and to define useful features for the time–frequency domain of analysis.
Figure 7. Linear regressions of the normalized average values of the nine features (Δa = differences between signal amplitudes; Δt = differences between signal arrival times; σ = signal standard deviations; PSDmax = absolute maxima of the power spectral densities; Slope = slope of the linear
regressions of the spectra range 20–500 Hz; fc = spectral centroids in the range 20–500 Hz; EntCWC = entropies of the Continuous Wavelet Coefficients, CWCs; EngCWC = maximum energies of
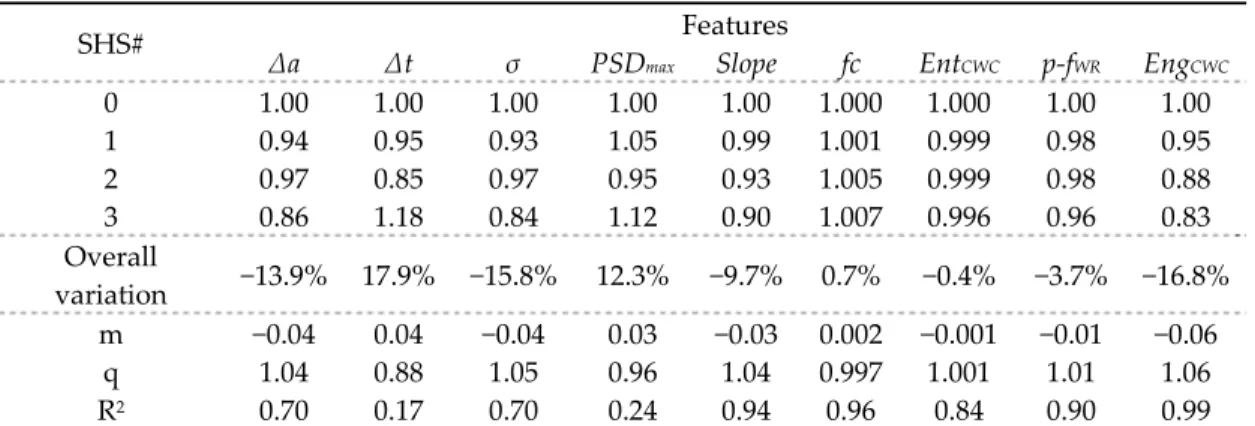
Based on Figures 6 and 7, it is possible to state that the variation in the condition of the pavements of the park’s access routes can be recognized and monitored using graphical (i.e., scalograms) or numerical (i.e., features) results extracted from the ARs of the road pavement. Meanwhile, Table 2 shows the values of the nine features extracted from the ARs of the road pavement in each of the four conditions considered in the abovementioned tests (i.e., SHS0 = uncracked road; SHS1 = road with a line of 16 holes, SHS2 = road with an additional line of 15 holes; SHS3 = road with a last additional line of 15 holes).
Table 2. Averages of the features extracted, their overall variations, the parameters of the linear regression model applied on the average values, and R-square values.
SHS# Features
Δa Δt σ PSDmax Slope fc EntCWC p-fWR EngCWC
0 1.00 1.00 1.00 1.00 1.00 1.000 1.000 1.00 1.00 1 0.94 0.95 0.93 1.05 0.99 1.001 0.999 0.98 0.95 2 0.97 0.85 0.97 0.95 0.93 1.005 0.999 0.98 0.88 3 0.86 1.18 0.84 1.12 0.90 1.007 0.996 0.96 0.83 Overall variation −13.9% 17.9% −15.8% 12.3% −9.7% 0.7% −0.4% −3.7% −16.8% m −0.04 0.04 −0.04 0.03 −0.03 0.002 −0.001 −0.01 −0.06 q 1.04 0.88 1.05 0.96 1.04 0.997 1.001 1.01 1.06 R2 0.70 0.17 0.70 0.24 0.94 0.96 0.84 0.90 0.99
Symbols. SHS# = structural health status of the road pavement as a function of the drilled holes used to simulate cracks; Overall variation = calculated using the expression −1 + (featureSHS0 −
featureSHS3); m = angular coefficient of the linear regression model; q = intercept of the linear
regression; R2 = coefficient of determination.
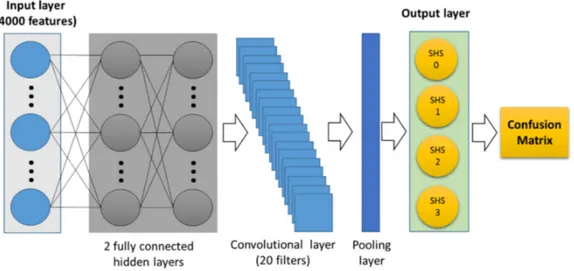
Subsequently, the meaningful information (scalograms, power spectra, and features) obtained using the first approach was used as input for the second data analysis approach, i.e., the machine-learning-based approach (see the “Check” stage; Figure 4). In more detail, different Convolutional Neural Networks (CNNs) were designed. CNNs are commonly used for the classification of images (see, e.g., [16]), but in this application they were used to (i) take as an input the feature sets extracted; (ii) compare the features extracted with the related thresholds; and (iii) recognize the occurrence of one or more emergency event(s). A large amount of available data ensured the robustness of the CNN. In fact, the CNN was trained continuously during the platform lifetime, using the features extracted from the data contained in different DBs (especially those from DB PST). Importantly, the platform becomes able, in a short time, to forecast forthcoming functional damage and failures, and this allows for carrying out predictive maintenance of the structures in the theme park.
As an example, one of the CNNs mentioned above is presented in this paper (see Figure 8). This CNN was specifically designed to classify the features extracted from the acoustic signals gathered from the road pavement and to recognize variation in the structural health status of the road [44].
Figure 8. Schematic representation of the convolutional neural network implemented in the platform.
The abovementioned CNN was built while paying attention to the recommendations and the recurrent problems described in the literature [45,46], and it has the following characteristics: (1) two fully connected layers (with 70 and 30 hidden nodes, respectively), which carry out pattern recognition using the activation function ReLu (relu(x) := max(0, x), i.e., this function, f (z), is zero when z < 0, and it is equal to z when z ≅ 0); (2) one convolutional layer, which automatically extracts additional features from the input); (3) one pooling layer, which carries out the average pooling of the features extracted while applying the valid padding; (4) Adadelta Optimized was selected as the optimizer function (for the adjustment of weights and biases); (5) the activation function Softmax cross entropy measures the probability error in discrete classification tasks, and confusion matrices were used to show and analyze the results of the classification. In particular, to quantify the results, the model accuracy was used. This parameter can be derived by calculating the ratio between the number of signals of the testing data set correctly classified and the total number of signals belonging to the testing data set to be classified.
Finally, Figure 9a shows the convergence of the CNN, which was obtained after 50 epochs using as inputs (i) 60% of the data set (4000 features) for the training; (ii) 40% of the features for the testing; (iii) a learning rate equal to 5; (iv) a convolutional layer with 20 filters (length of the convolution window = 5; stride length of the convolution = 5, where the stride is the amount by which the filter shifts); (v) a pooling layer with a window size equal to 1; and (vi) a pool stride equal to 1. Finally, the model’s accuracy (99.6%) was derived from the confusion matrix reported in Figure 9b.
Figure 9. (a) Convergence plots for the Convolutional Neural Network (CNN), and (b) confusion matrices of the training and testing phases.
It is important to note that, based on the experimental results related to the CNN application, although some features showed overall variation (e.g., fc; cf. Table 2) of less than 1%, their use was crucial for the convergence of the CNN used.
3.2.3. Easy and Complex Solutions
By referring to the identification of the most effective solution (Task 12, Point iii), it should be noted that two different classes of emergency are considered, i.e., recurrent problems and complex problems. To face recurring problems, the platform is able to propose Easy Solutions (ES). Possible examples could be, e.g., to reduce the sound level during a concert, or to call a tow truck in case of an accident, or an ambulance in case of an ill person. In this case, the cameras placed on the closest HUB (with respect to the place where the problem occurred) can be turned on to monitor the area through video streaming to be saved on the server. Differently from the case above, to face complex problems (e.g., earthquake or fire), proper emergency management strategies (e.g., a combination of more than one easy solution) are defined by the platform. In this case, the camera placed on the closest HUB automatically turns on to make the identification of the best complex solution easier, and the video is automatically saved on the related DB.
Complex solutions involve the definition of an escape plan that consists of (1) the identification of the internal evacuation paths in a given building (INT; see Figure 4), the external evacuation paths in a given open space (EXT; see Figure 4), the escape route to follow to reach a given meeting point (GP; see Figure 4), and identification of the first aid needed (FAN; see Figure 4).
Finally, in case of emergency (recurrent or complex), the platform is designed to (i) trigger the proper alert that can be seen on the dashboard of the platform (see Figure 10) and which is diffused, using loudspeakers, through prerecorded sounds and messages that indicate the safe escape routes to follow (INT+EXT), the meeting point to reach (GP), and the arrival time of the authorities for the first aid (FAN); (ii) identify the most effective solutions among a set of predefined easy solutions (ES) or complex solutions (INT+EXT+FAN+GP); and (iii) send predefined alert message to the platform users and to the first aid responders (FAN).
We note that the safe escape routes for the people involved in an emergency and the access routes for first aid were determined by applying a properly designed graph-based algorithm. Multiple paths among the vertices of the graph (i.e., the crossroads present on the park) were predefined. The platform is able to find the shortest path between the vertex closest to the emergency and the most accessible, closest, and safest assembly point still available.
3.2.4. Dashboard of the Platform
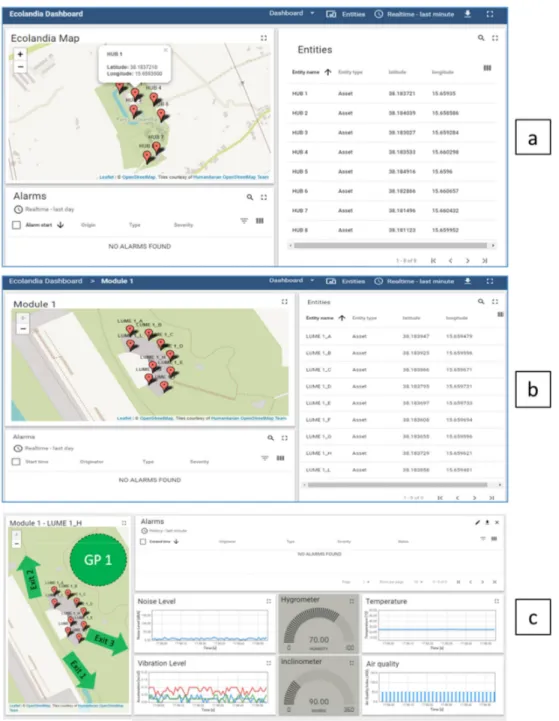
The dashboard of the platform was designed using open-source IoT platforms. Figure 10 shows three screenshots of the platform’s dashboard.
Figure 10. Screenshots of the three main levels of the platform: (a) highest level: list and localization of all the platform’s modules, which are represented by the HUBs; (b) medium level: list and localization of the nine LUMEs of Module 1; (c) lowest level: position and graphs of one of the LUMEs (LUME 1_H) included in Module 1, the predefined exits, and the predefined Gathering Point (GP).
Figure 10 shows the three main levels of the platform’s dashboard:
1. The highest level, which consist of a single screen where it is possible to see a widget list that reports all the platform’s modules, which are represented by the HUBs (localized by the geographic coordinates, i.e., latitude and longitude; cf. Figure 10a), and a widget alarm that shows the park’s conditions;
2. The medium level, which consists of different screens (i.e., eight in this platform) where it is possible to see a widget list that shows the components of each module (e.g., Module 1 = HUB 1 + 9 LUMEs; cf. Figure 10b), the widget map that shows their localizations (see latitude and longitude in Figure 10b), and the widget alarm that shows the park’s conditions;
3. The lowest level, where one screen is available for each sensor unit (i.e., all the HUBs and all the LUMEs of the platform), which includes (i) the widget map that shows where they are installed, the predefined exits (i.e., Exit 1, Exit 2, and Exit 3 in Figure 10c), and the predefined Gathering Point (GP in Figure 10c); (ii) the graphs related to one sensor unit (e.g., LUME 1_H in Figure 10c); and (iii) the widget alarm that shows the park’s conditions.
Note that the alarms can be seen at each platform level (highest, medium, and lowest).
It should be noted that the graphs included in each low level of the platform’s dashboard were plotted based on the following considerations: (i) the graph “Noise Level” (see Figure 10c) refers to the microphone that measures the noise pollution, and it shows the noise level (dBA) over time considering as upper threshold the value 170 dBA, which refers to the noise produced by, e.g., a shotgun [47,48]; (ii) air humidity ranges from 0% to 100%; (iii) air temperature is supposed to range from −3 °C to 60 °C, based on the variation of the temperature of the air and structures in the park during the year; (iv) the upper threshold of the vibration level was considered equal to 0.2 m/s2, which
is the value of vibration at which people lose their balance [49]; (v) the inclinometer measures the inclination of the sensor unit, which depends on the inclination of the monitored structure (e.g., 90° can represent a wall; see Figure 10c); (vi) the air quality is expressed in terms of the Air Quality Index (AQI; dimensionless; cf. [50,51]) and the upper threshold was defined by considering that AQI = 150 refers to unhealthy air conditions [51].
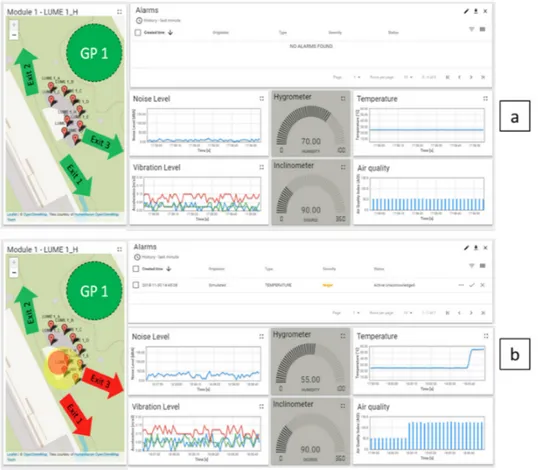
Seeking to show the potentialities and the operation of the platform, two sequences of events are reported below. In particular, a fire and the presence of an obstacle on one of the access routes of the park were considered.
The first example (see Figure 11) refers to a fire on the amphitheater’s stage during a show in front of an audience sitting in the stands. It is expected that the simulated emergency (fire) is followed by the following sequence of events:
1. Temperature increase, humidity decrease, and worsening of the air quality are detected by the LUMEs closer to the fire (Figure 11b);
2. The camera of the HUB turns on;
3. The platform triggers the alarm (Figure 11b);
4. The noise level and the vibration level increase because of the fleeing crowd that is leaving the amphitheater;
5. The platform makes an estimation of the number of people potentially involved (e.g. based on the tickets sold);
6. The platform controls the remaining areas of the park and selects the quickest and safest path for the crowd (see Exit 2 in Figure 11b) and the closest available assembly point (see GP 1 in Figure 11b);
7. The platform sends a message to the first aid responders (e.g., firefighters and an ambulance) indicating the access route to be followed, the estimated number of people involved, and the point at which the emergency occurred;
8. The platform sends a prerecorded message to the audience using a loudspeaker that indicates the escape directions, the primary and the alternative exits, the assembly point to be reached where first aid will be available, and the estimated arrival time of the first aid.
Figure 11. Screenshots of the platform before (a) and during (b) a fire.
The second example refers to the presence of an obstacle on one of the access routes of the park. In more detail, a street lamp fallen on one of the access routes of the park was considered as a possible obstacle. The following sequence of events is expected:
1. The inclinometer installed on the fallen street lamp detects an unexpected rotation;
2. A sudden and uncommon noise and a peak of vibration are detected by the LUMEs closer to
the access route (placed along the road and on the street lamps); 3. The camera of the HUB turns on;
4. The platform triggers the alarm;
5. The platform makes an estimation of the number of people potentially involved (e.g., the
average number of vehicles that travel the route every day);
6. The platform controls the remaining areas of the park and the availability of the second of the two access routes using the sensor units and the related cameras on the HUB.
7. The platform sends a message to the first aid responders (e.g., tow truck and the municipality) indicating the access route to be followed, the estimated number of people present in the park, and the point at which the emergency occurred;
8. The platform sends a prerecorded message to the audience using a loudspeaker that indicates the alternative exits and the estimated arrival time of the first aid.
9. The platform performs a self-diagnostic on the sensor units involved in the emergency. It is important to underline that the two examples above refer to usual (obstacle) and unusual (fire) emergencies, and that in the case of alerts related to the structural conditions of the monitored structures and infrastructures or to the functioning of the sensor units, the platform, instead of alerting first aid providers, will alert the stuff of the park responsible for maintenance.
4. Conclusions
Interactions among catastrophic, accidental, and natural events and deficiencies in management increasingly affect structures and infrastructures. These interactions cause emergencies and complex problems that are difficult to solve, especially in real time and when highly populated areas are involved.
Possible solutions include the meticulous care of asset design and complex monitoring technologies (e.g., sensor-based platforms). This study is focused on the most recent, sustainable, and efficient methods employing nondestructive, test-based monitoring methods and devices, wavelet- and machine-learning-based data processing, low-power and ultra-low-power sensors, and data transmission protocols.
Prompt or early identification of potential failures in cement concrete and asphalt concrete assets allows for optimizing the management process and facilitating the solution of usual and unusual problems. Despite the high number of solutions proposed in recent years, none of these has a sufficient level of development that allows for performing, at the same time, complete and comprehensive structural health monitoring (i.e., failure detection, localization, qualification, and quantification in different materials). For these reasons, a modular and scalable monitoring platform was presented in this study. It was designed for an Italian thematic park (located in Reggio Calabria, Italy) in the framework of the Italian research project SICURVIA.
The presented platform consists of several modules, and each module includes a central sensor/control unit (HUB) and a network of local sensor units (LUME). The data collected by the sensors (temperature and humidity sensors, inclinometer, microphone, accelerometer, etc.) of the HUB and the LUMEs are transmitted wirelessly, in JSON format, to a Web server that performs the data processing. The platform is innovative because of the use of algorithms based on the concept of the vibro-acoustic signature of the asset monitored. This signature is gathered by microphones and accelerometers (contained in the sensor units) and is analyzed using wavelet-based and CNN-based algorithms specifically designed to extract crucial information about the structural and environmental conditions of the areas of the thematic park.
Simulations showed that the platform has the potential to (i) solve the drawbacks of the current monitoring systems; (ii) increase the efficiency and the sustainability of the management process of different assets; and (iii) improve the safety of public areas by providing real-time decision support for the prompt and correct application of emergency plans and evacuation procedures and rapid first aid. Finally, the limitations of the proposed solution mainly include (i) the management of the large amount of data gathered by the system; (ii) the need for periodic simulations and tests to update thresholds and to add possible unexpected scenarios; and (iii) the need to develop specific protocols that are able to safely and easily connect the system and the park with other systems in the framework of the smart city and the IoT world.
Author Contributions: Conceptualization, M.M., F.G.P., R.C. and F.D.C.; Data curation, R.F.; Formal analysis, R.F.; Funding acquisition, M.M. and F.G.P.; Investigation, R.F.; Methodology, F.G.P., R.C. and F.D.C.; Project administration, F.G.P.; Software, R.C.; Supervision, M.M.; Writing—original draft, R.F.; Writing—review and editing, M.M., F.G.P., R.C. and F.D.C.
Funding: This research was funded by Regione Calabria, POR CALABRIA FESR-FSE 2014-2020, Asse I— Promozione della ricerca e dell'innovazione, Sicurvia project.
Conflicts of Interest: The authors declare no conflict of interest.
References
1. Chow, T.W.S.; Cho, S.Y. Industrial neural vision system for underground railway station platform surveillance. Adv. Eng. Inform. 2002, 16, 73–83.
2. Chou, C.C.; Jeng, A.P.; Chu, C.P.; Chang, C.H.; Wang, R.G. Generation and visualization of earthquake drill scripts for first responders using ontology and serious game platforms. Adv. Eng. Inform. 2018, 38, 538–554. 3. Min, D.A.; Hyun, K.H.; Kim, S.J.; Lee, J.H. A rule-based servicescape design support system from the design
4. Radopoulou, S.C.; Brilakis, I. Improving Road Asset Condition Monitoring. Transp. Res. Procedia 2016, 14, 3004–3012.
5. Rüppel, U.; Schatz, K. Designing a BIM-based serious game for fire safety evacuation simulations. Adv.
Eng. Inform. 2011, 25, 600–611.
6. Lovreglio, R. A Review of Augmented Reality Applications for Building Evacuation. In Proceedings of the Augmented Reality for Technical Entrepreneurs 2016 Conference, Tampere, Finland, 5–7 June 2018. 7. Bloch, T.; Sacks, R.; Rabinovitch, O. Interior models of earthquake damaged buildings for search and
rescue. Adv. Eng. Inform. 2016, 30, 65–76.
8. Pop, M.-D.; Proștean, O. A Comparison between Smart City Approaches in Road Traffic Management.
Procedia Soc. Behav. Sci. 2018, 238, 29–36.
9. J. Moubray Reliability-Centered Maintenance “Proactive maintenance 2: Predictive Tasks”; Ind. Press Inc.: New York, NY, USA, 1997.
10. De La Garza, J.M.; Akyildiz, S.; Bish, D.R.; Krueger, D.A. Network-level optimization of pavement maintenance renewal strategies. Adv. Eng. Inform. 2011, 25, 699–712.
11. Spencer, B.F.; Jo, H.; Mechitov, K.A.; Li, J.; Sim, S.H.; Kim, R.E.; Cho, S.; Linderman, L.E.; Moinzadeh, P.; Giles, R.K.; et al. Recent advances in wireless smart sensors for multi-scale monitoring and control of civil infrastructure. J. Civ. Struct. Heal. Monit. 2016, 6, 17–41.
12. Mesquita, E.; Antunes, P.; Coelho, F.; André, P.; Arêde, A.; Varum, H. Global overview on advances in structural health monitoring platforms. J. Civ. Struct. Health Monit. 2016, 6, 461–475.
13. Ma, Z.; Liu, S. A review of 3D reconstruction techniques in civil engineering and their applications. Adv.
Eng. Inform. 2018, 37, 163–174.
14. Worden, K.; Farrar, C.R.; Manson, G.; Park, G. The fundamental axioms of structural health monitoring.
Proc. R. Soc. A Math. Phys. Eng. Sci. 2007, 463, 1639–1664.
15. Harjit, K.; Rajandeep, K. A Review on Crack Detection and Parameters Estimation on Road Images. Int. J.
Res. Appl. Sci. Eng. Technol. 2017, 5, 1–4.
16. Tong, Z.; Gao, J.; Zhang, H. Recognition, location, measurement, and 3D reconstruction of concealed cracks using convolutional neural networks. Constr. Build. Mater. 2017, 146, 775–787.
17. Parolai, S. Project SIBYL. Available online: http://www.sibyl-project.eu/welcome-and-project-aims/ (accessed on 15 September 2019).
18. Fedele, R.; Merenda, M.; Praticò, F.G.; Carotenuto, R.; Della Corte, F.G. Energy harvesting for IoT road monitoring systems. Instrum. Mes. Metrol. 2018, 17, 605–623.
19. D-Link Camera Wi-Fi DCS-2670L. Available online: https://eu.dlink.com/it/it/-/media/consumer_products/dcs/dcs-2670l/datasheet/dcs_2670l_datasheet_it.pdf (accessed on 15 September 2019).
20. STMicroelecronics MEMS Temperature and Humidity. Available online: https://www.st.com/resource/en/datasheet/hts221.pdf (accessed on 15 September 2019).
21. STMicroelecronics MEMS 3D Accelerometer and Gyroscope. Available online: https://www.st.com/resource/en/datasheet/lsm6ds3.pdf (accessed on 15 September 2019).
22. Knowles. MEMS Microphone (Model: SPM0687LR5H-1); Knowles: Horsham, Australia, 2018.
23. Figaro USA Inc Air Quality Sensor (Figaro). Available online: http://www.figarosensor.com/feature/tgs8100.html (accessed on 28 June 2018).
24. Inovafit SDS011 Air Quality Sensor. Available online: https://aqicn.org/sensor/sds011/ (accessed on 15 September 2019).
25. Fedele, R.; Praticò, F.G.; Carotenuto, R.; Della Corte, F.G. Damage detection into road pavements through acoustic signature analysis: First results. In Proceedings of the 24th International Congress on Sound and Vibration, ICSV 2017, London, UK, 24–27 June 2017.
26. Fedele, R.; Pratico, F.G.; Carotenuto, R.; Della Corte, F.G. Instrumented infrastructures for damage detection and management. In Proceedings of the 5th IEEE International Conference on Models and Technologies for Intelligent Transportation Systems, MT-ITS 2017, Naples, Italy, 26–28 June 2017.
27. Mannion, P. Comparing Low-Power Wireless Technologies (Part 1). Available online: https://www.digikey.it/en/articles/techzone/2017/oct/comparing-low-power-wireless-technologies
(accessed on 15 September 2019).
28. Zito, F.; Aquilino, F.; Fragomeni, L.; Merenda, M.; Della Corte, F.G. CMOS wireless temperature sensor with integrated radiating element. Sens. Actuators A Phys. 2010, 158, 169–175.
29. Merenda, M.; Farris, I.; Felini, C.; Militano, L.; Spinella, S.C.; Della Corte, F.G.; Iera, A. Performance assessment of an enhanced RFID sensor tag for long-run sensing applications. In Proceedings of the IEEE Sensors 2014, Valencia, Spain, 2–5 November 2014; pp. 738–741.
30. Merenda, M.; Felini, C.; Della Corte, F.G. A monolithic multisensor microchip with complete on-chip RF front-end. Sensors 2018, 18, 110.
31. Merenda, M.; Felini, C.; Della Corte, F.G. An autonomous and energy efficient smart sensor platform. In Proceedings of the IEEE Sensors 2014, Valencia, Spain, 2–5 November 2014; pp. 1208–1211.
32. Praticò, F.G.; Della Corte, F.G.; Merenda, M. Self-powered sensors for road pavements. In Functional
Pavement Design; CRC Press: Boca Raton, FL, USA, 2016.
33. Mekki, K.; Bajic, E.; Chaxel, F.; Meyer, F. A comparative study of LPWAN technologies for large-scale IoT deployment. ICT Express 2019, 5, 1–7.
34. Dementyev, A.; Hodges, S.; Taylor, S.; Smith, J. Power consumption analysis of Bluetooth Low Energy, ZigBee and ANT sensor nodes in a cyclic sleep scenario. In Proceedings of the 2013 IEEE International Wireless Symposium, IWS 2013, Beijing, China, 14–18 April 2013.
35. Lanthaler, M.; Gütl, C. On using JSON-LD to create evolvable RESTful services. In Proceedings of the Third International Workshop on RESTful Design—WS-REST ’12, Lyon, France, 17 April 2012.
36. Afsari, K.; Eastman, C.M.; Castro-Lacouture, D. JavaScript Object Notation (JSON) data serialization for IFC schema in web-based BIM data exchange. Autom. Constr. 2017, 77, 24–51
37. Fedele, R.; Praticò, F.G.; Carotenuto, R.; Della Corte, F.G. Energy savings in transportation: Setting up an innovative SHM method. Math. Model. Eng. Probl. 2018, 5, 323–330.
38. Fedele, R.; Praticò, F.G. Monitoring infrastructure asset through its acoustic signature. In Proceedings of the Internoise 2019, Madrid, Spain, 16–19 June 2019.
39. Bendat, A.G.; Piersol, J.S. Random Data Analysis and Measurement Procedures. Meas. Sci. Technol. 2000,
11, 1825–1826.
40. Schubert, E.; Wolfe, J. Timbral brightness and spectral centroid. Acta Acust. United Acust. 2006, 92, 820–825. 41. Shoaib, M.; Shamseldin, A.Y.; Melville, B.W. Comparative study of different wavelet based neural network
models for rainfall–runoff modeling. J. Hydrol. 2014, 515, 47–58.
42. Kumar, H.S.; Srinivasa Pai, P.; Sriram, N.S.; Vijay, G.S. Selection of Mother Wavelet for Effective Wavelet Transform of Bearing Vibration Signals. Adv. Mater. Res. 2014, 1039, 169–176.
43. Abdolmaleki, M.; Tabaei, M.; Fathianpour, N.; Gorte, B.G.H. Selecting optimum base wavelet for extracting spectral alteration features associated with porphyry copper mineralization using hyperspectral images.
Int. J. Appl. Earth Obs. Geoinf. 2017, 58, 134–144.
44. Praticò, F.G.; Fedele, R.; Naumov, V.; Sauer, T. Identification and monitoring of concealed cracks in road pavement using a machine-learning approach. In Proceedings of the Models and Technologies for Intelligent Transportation Systems (MT-ITS 2019), Krakow, Poland, 5–7 June 2019.
45. Jain, A.K.; Mao, J.; Mohiuddin, K.M. Artificial neural networks: A tutorial. Computer (Long. Beach. Calif). 1996, 29, 31–44.
46. Basheer, I.A.; Hajmeer, M. Artificial neural networks: Fundamentals, computing, design, and application.
J. Microbiol. Methods 2000, 43, 3–31.
47. Center for Hearing and Communication. Available online: http://chchearing.org/noise/common-environmental-noise-levels/ (accessed on 15 September 2019).
48. Commission, E. Noise sources Available online: http://ec.europa.eu/environment/noise/sources_en.htm (accessed on 15 September 2019).
49. Lorant, G. Seismic Design Principles. Available online: http://www.wbdg.org/resources/seismic-design-principles.
50. Commission, E. Air Quality Standards. Available online:
http://ec.europa.eu/environment/air/quality/standards.htm (accessed on 15 September 2019).
51. Air Quality Index. Available online: https://airnow.gov/index.cfm?action=aqibasics.aqi (accessed on 15 September 2019).
© 2019 by the authors. Licensee MDPI, Basel, Switzerland. This article is an open access article distributed under the terms and conditions of the Creative Commons Attribution (CC BY) license (http://creativecommons.org/licenses/by/4.0/).