Introduction
Douglas-fir (Pseudotsuga menziesii (Mirb) Franco var. menziesii) is a species native to western north America which has been wi-dely used in the reforestation of abandoned rural areas in Italy, particularly along the Apennines, because of its rapid growth and adaptability (Ciancio et al. 1982). It has been usually managed with 30-70 years cutting cycle, with harvest of total stand volume, mainly destined for use in construction.
The crucial phase of a reforestation project is the choice of tree-density and spacing, be-cause these are parameters influencing the kind of management to adopt and the costs during the early phase after planting (Corona et al. 2002, Sanesi et al. 2007). Furthermore planting density strictly affects management, due to the ecological, silvicultural and eco-nomic implications (Ciancio et al. 1982, La Marca 1985, Menguzzato & Tabacchi 1995,
La Marca et al. 1998, Ciancio et al. 2005). Considering the biomass distribution at tree and stand level, planting density and spacing are fundamental elements to be accounted for. In the context of global warming poten-tial, information concerning the influence of planting density on biomass allocation is ex-tremely important, because all the countries which adhere to the Kyoto Protocol are re-quested to adopt forms of forest management which may enhance the atmospheric CO2
ab-sorption (UNEP 1997). Currently, planting density adopted for reforestation, and for plantations destined to biomass production for energy, is generally lower compared to the past, when planting density was chosen without considering its effects on carbon stocking. The choice then revolved around the wood quality (tree grown in high density stands showed better mechanical characteris-tics) and traditional management as defined
by the German forestry school (Ciancio et al. 2008). Currently, the practice of adopting lower planting densities is more widespread for the following reasons: (i) the higher cost of young plants; (ii) the need to pass through rows with specialized machinery to carry out maintenance operations; (iii) the convenien-ce of postponing early thinning with the aim to harvest larger trees.
In Italy high density plantations were nor-mally established because of the costs of manpower and young plants were low. Such plantations presented high tree density even at a late stage, since no silvicultural interven-tion has been carried out (difficulty in tra-ding small dimension trees). As a conse-quence, losses due to self-thinning, meteoric causes and pathogen attacks occurred with high frequency. In conifers, a higher density results in a lower tree diameter growth and, to a lesser extent, tree height may be lowered or suppressed (Jones 1987).
At stand level wood production increases with increasing stand density because the volume associated with the additional trees more than compensates for the decrease in the size of individuals (Dickens et al. 2004). At later ages of stands, it often happens that stands with differing densities do not result in different wood production, because the growth rate of high-density stands reaches a maximum and begins to decline earlier than lower-density stands.
In Italy spacing trials (without thinning) in Douglas-fir plantations were carried out on the coastal chain in Calabria (southern Italy -Ciancio et al. 1982, Menguzzato & Tabacchi 1995, Ciancio et al. 2008) and in Tuscany (La Marca 1985). In the USA the first trials
(1) Department of Agraria, Mediterra-nean University of Reggio Calabria, loc. Feo di Vito, I-89060 Reggio Calabria (Italy); (2) ISAFoM, Institute for Mediterranean Agri-culture and Forest Systems, CNR - National Research Council, I-87037 Rende (CS, Italy); (3) Department of Chemical and Environ-mental Engineering, University of Calabria, Campus di Arcavacata, I-87037 Rende (CS, Italy)
@
@
Pasquale Antonio Marziliano ([email protected])Received: Jul 18, 2013 - Accepted: Jun 05, 2014
Citation: Marziliano PA, Coletta V,
Menguz-zato G, Nicolaci A, Pellicone G, Veltri A, 2015. Effects of planting density on the dis-tribution of biomass in a douglas-fir planta-tion in southern Italy. iForest 8: 368-376 [online 2014-09-09] URL: http://www. sisef.it/iforest/contents/?id=ifor1078-007
Communicated by: Emanuele Lingua
Effects of planting density on the
distribution of biomass in a douglas-fir
plantation in southern Italy
Pasquale A Marziliano
(1), Vittoria Coletta
(2), Giuliano Menguzzato
(1),
Antonino Nicolaci
(3), Gaetano Pellicone
(2), Antonella Veltri
(2)The effects of initial planting densities on the distribution of above-ground biomass of Douglas-fir (Pseudotsuga menziesii [Mirb.] Franco var. menziesii) were investigated in a plantation in southern Italy. Allometric equations de-signed for the plantation under study were used to estimate above-ground biomass and its partitioning to stem and crown compartments. A comparison between biomass estimated with allometric equations and biomass estimated with a constant biomass expansion factor (BEF) from the Italian National Forest Inventory (INFC 2005) was carried out. Moreover, a BEF calculated as the ratio of total above-ground or compartment biomass to stem volume was used to de-fine the sensitivity of BEF to age and to tree density. Variation of above-ground standing biomass estimated with allometric equations was evaluated ac-cording to 6 differing planting densities (833, 1000, 1250, 1667, 2000 and
2500 trees ha-1). In the first 20 years after planting, higher biomass stock was
detected in high density plots, but after the age of 32 years differences be-tween plots disappeared. When the plantation was 40 years old, the highest
amount of total biomass was observed in plots of 2000 trees ha-1 (about 405 Mg
ha-1), and the lowest in plots of 2500 trees ha-1 (about 381 Mg ha-1). The
Dou-glas-fir plantation has a total above-ground carbon stock of 197 Mg C ha-1 at the
age of 40 and a mean annual CO2 sequestration of 18 Mg ha-1 y-1. On average,
constant BEF from INFC underestimated biomass by 11% at ages 15 and 25 and overestimated biomass by 16% at older ages. BEFs expressed as a ratio of biomass to stem volume significantly depended upon age and planting density, with decreasing trends for total, stem and crown compartments. Our results indicated that total above-ground biomass production is not influenced by dif-ferent tree density if considered over a long period. If cutting cycles are short,
planting density of 2000 trees ha-1 may ensure high biomass production rates;
for longer cutting cycles, 1000-1200 trees ha-1 could also be a valid choice.
Keywords: Allometric Equations, Biomass, Biomass Expansion Factor, Carbon, Douglas-fir, Planting Density, Spacing Trial
were performed in 1925 (Reukema 1979). In France the first spacing trials were carried out in 1955 by Mitchell et al. (1983) and in 1971 by Bartoli (1971), whereas in Germany the first spacing trials date back to 1958 and 1961 (Kenk 1981).
Assessments of forest stand carbon dyna-mics, nutrient fluxes, and tree growth often include estimates of tree biomass (Devine et al. 2011). In the present study, we aim at evaluating the above-ground biomass distri-bution and subsequently the carbon stock of a Douglas-fir plantation in southern Italy. We consider the effects of planting density on the distribution of biomass and its parti-tioning to stem and crown compartments, using a spacing trial measured periodically over 25 years. Quantifying forest productivi-ty following the guidelines by the Intergo-vernmental Panel on Climate Change (IPCC 2003), allows us to finally define the role of management in strengthening the global war-ming potential of the plantation under study. Two methods were used to estimate carbon stock (IPCC 2003): (i) allometric equations designed for the Douglas-fir plantation grown under the same conditions as the plantation in our study (Menguzzato & Ta-bacchi 1995); and (ii) a constant biomass ex-pansion factor (BEF) taken from the Italian National Forest Inventory (INFC 2005). Moreover, a BEF derived as the ratio be-tween stand characteristics (Lehtonen et al. 2004) was used to develop BEFs that are de-pendent on stand age for the whole tree, stem and crown biomass, taking into account the planting density. Considering that cur-rently in Italy there are no spacing trials which account for biomass allocation over a long period of time, the present study aims at producing a more in-depth knowledge of biomass allocation in Douglas-fir plantations differing in planting density.
To summarize, the final aims of this study were: (i) to evaluate above-ground, stem and crown biomass of a Douglas-fir stand and its changes over time according to different planting densities; (ii) to compare different estimation methods of biomass stock of trees (allometric equations and constant BEF); (iii) to determine age dependent functions of BEFs.
Material and Methods
Study site
The study area is located in the central coastal chain of Calabria, on the western flank of the southern Apennines exposed to the Tyrrhenian sea. The locality is called Serra Salinaro (39° 25′ N, 16° 2′ E, mean al-titude 900 m a.s.l.). It is the property of the regional Italian State Forestry Agency (Azienda di Stato Foreste Demaniali -ASFD) that afforested the area in 1967 mainly with Douglas-fir and to a lesser
de-gree with white pine (Pinus strobus L.), black pine (Pinus nigra Arnold var. calabri-ca), atlas cedar (Cedrus atlantica (Endl. Car-rierre), maritime pine (Pinus pinaster Ait.), silver fir (Abies alba Mill.) and Japanese larch (Larix leptolepis (Sieb. Et Zucc.) Gard. = L. Kaempferi Sarg.). The understory vege-tation is mainly constituted of fern (Pteri-dium aquilinum (L.) Kuhn), bramble (Rubus ulmifolius Schott, 1818) and holly (Ilex aquifolium L.). The plantation is part of a re-forestation project carried out in southern Italy with funding earmarked by national government to restore forest ecosystems in abandoned agricultural land. Rapid growth non-indigenous species were largely used, with the final aim of obtaining a continuous covering of land in a short time.
Climatic data have been collected from the meteorological station of Guardia Piemon-tese (515 m a.s.l., 5 km apart), and climatic equations proposed by Ciancio (1971) have been used to define climatic data related to the altitude of the location under study. The climate is typically Mediterranean. The an-nual rainfall is 1233 mm, with minimum pre-cipitation in summer (88 mm) and a maxi-mum during the winter (501 mm). Average annual temperature is 11.5 °C at an altitude of 950 m a.s.l. Average temperature of the coldest month is 3 °C, while the warmest has an average temperature of 20.8 °C. Accor-ding to Pavari’s phytoclimatic classification (Pavari 1959), the plantation is located be-tween warm and cold sub-zones of Castane-tum. The problem of summer aridity is ab-sent, owing to abundant precipitation, fre-quent fogs and exposure to moist air from the Tyrrhenian sea (Cantore & Iovino 1989).
Geologically the site is underlain by green and purple Paleozoic schist. According to FAO soils classification (FAO 1998) soils are brown Podzols, with a plinthic horizon starting within 50 cm from the soil surface, deriving from basic metamorphic rocks, with highly decomposed organic material in more arid sites.
Experimental designs and dendrometric
surveys
Six plots with different spacing trials were identified in the plantation. The planting densities were the following:
1. Planting density A: 2500 trees ha-1, with
spacing of 2 m between rows and 2 m be-tween trees (PL2500);
2. Planting density B: 2000 trees ha-1, with
spacing of 2 m between rows and 2.5 m between trees (PL2000);
3. Planting density C: 1667 trees ha-1, with
spacing of 2 m between rows and 3 m be-tween trees (PL1667);
4. Planting density D: 1250 trees ha-1, with
spacing of 2 m between rows and 4 m be-tween trees (PL1250);
5. Planting density E: 1000 trees ha-1, with
spacing of 2.5 m between rows and 4 m between trees (PL1000);
6. Planting density F: 833 trees ha-1, with
spacing of 3 m between rows and 4 m be-tween trees (PL833);
Each plot had an area of 5000 m2. Within
each plot two sub-plots of 900 m2 were
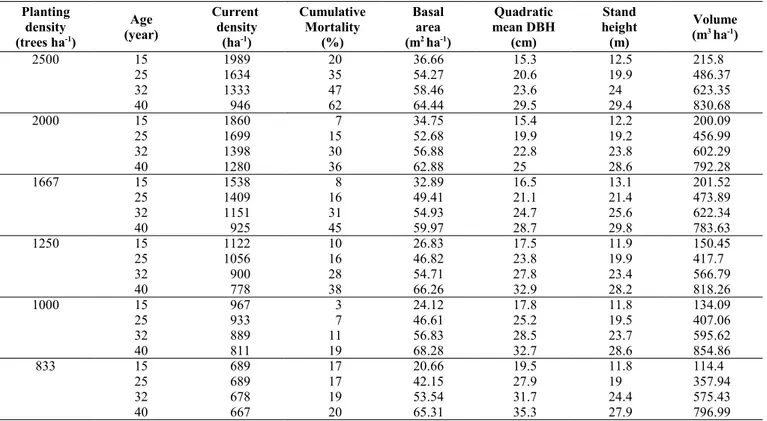
ear-marked for dendrometric surveys with a sub-sequent testing of the effects of different planting densities. In each plot (12 plots), two orthogonal diameters at breast height (DBH) of all trees were measured. In addi-tion, the total height (Ht) of a representative sample (about 50%) of trees was measured. Dendrometric surveys were performed over a 25 year period. Initially, when the stand was 15 years old, and then again at age 25, 32 and 40. In each plot the removal of dead trees was carried out for phytosanitary rea-sons. Tab. 1 shows the main dendrometric parameters for the six planting densities at the age considered.
Allometric equations and biomass
expansion factors
Due to the lack of equations which allow the prediction of below-ground biomass for Douglas-fir plantation, in this study only the above-ground biomass has been considered. The biomass of each component (total abo-ve-ground, stem and crown) at tree-level was estimated from the diameter at breast height (DBH) using equations by Menguzzato & Tabacchi (1995), with different coefficients for different planting densities. Tab. 2 shows the equations used for the estimation of stem, crown and total above-ground bio-mass. Some statistics on sample trees col-lected in the six plots with differing planting densities are also reported. Equations were used to predict biomass at tree and stand level for all ages, when plantation was 15, 25, 32, 40 years old.
A conversion procedure was also adopted based on biomass expansion factors (BEFs), proposed by the Intergovernmental Panel on Climate Change (IPCC 2003) guidelines for the cases where no specific biomass models are available (Houghton et al. 1997). A con-stant BEF from the INFC for conifer planta-tions in Italy (BEF = 1.41; basic wood den-sity = 0.43) was multiplied by aggregated stand-level volume. To estimate stem volu-me at tree level, voluvolu-me equation for Pseu-dotsuga menziesii (Mirb.) Franco from the INFC (Tabacchi et al. 2011) was used.
A second BEF was developed from the data of volume and biomass at stand level per hectare as the ratio of total or component dry biomass to stem volume (Lehtonen et al. 2004 - eqn. 1):
where Wi is total or component dry biomass
BEF =Wi
at stand level per hectare (Mg ha-1) estimated
with the allometric equation by Menguzzato & Tabacchi (1995), V is the stem volume at stand level per hectare (m3 ha-1), determined
with the equation by Tabacchi et al. (2011). The BEF was also calculated for both crown and stem biomass.
The second BEF was used to define the age-dependent functions of BEF, in order to predict the BEFs for each biomass compo-nent depending on stand age and planting density.
Data analysis
A linear regression was used to correlate the distribution of above-ground biomass to planting density for every age. Analysis of variance (ANOVA) based on a scheme of randomized blocks (six planting density re-peated twice) was carried out to test the dif-ferences in biomass stock, mean increments of biomass and partitioning to crown and stem, between differing density plots. The significance of the differences was tested by the Tukey’s method.
Both the paired-sample T test and the paired-sample Z-Test (Wilkoxon test) were used to compare the biomass estimates cal-culated by allometric equations with the biomass estimates calculated by the constant BEF from INFC. The T test is a parametric test known to be more statistically powerful; on the other hand, the Z-Test is non-para-metric and requires almost no assumptions. Applied statistic textbooks (Zar 1996,
Mont-gomery 2001, Soliani 2008) usually recom-mend to use both tests in order to truly verify the estimates.
For each planting density and for each bio-mass component, age-dependent functions of BEF were defined with a stepwise regres-sion. A power function provided the best fit for each planting density and for every BEF component (stem, crown and total tree). We used an F-test for parallelism (mathematical similarity) to compare the null hypothesis of a unique equation for all planting densities with the alternate hypothesis of six equations with different coefficients. In all cases, the null hypothesis was rejected.
Data analysis was carried out using the sta-tistical software R version 2.3.0 (R Develop-ment Core Team 2008).
Results
Evaluation of biomass allocation and
partitioning
Tree mortality occurred in all plots during the years of survey. It was higher in high planting density stands (Tab. 1), as noticed by Menguzzato & Tabacchi (1995) and Ciancio et al. (2008). A high mortality rate (62% at the age of 40 years) was observed for the PL2500 plots. Plots belonging to
Tab. 1 - Main dendrometric parameters of stands for each planting density at the ages considered. Planting density (trees ha-1) Age (year) Current density (ha-1) Cumulative Mortality (%) Basal area (m2 ha-1) Quadratic mean DBH (cm) Stand height (m) Volume (m3 ha-1) 2500 15 1989 20 36.66 15.3 12.5 215.8 25 1634 35 54.27 20.6 19.9 486.37 32 1333 47 58.46 23.6 24 623.35 40 946 62 64.44 29.5 29.4 830.68 2000 15 1860 7 34.75 15.4 12.2 200.09 25 1699 15 52.68 19.9 19.2 456.99 32 1398 30 56.88 22.8 23.8 602.29 40 1280 36 62.88 25 28.6 792.28 1667 15 1538 8 32.89 16.5 13.1 201.52 25 1409 16 49.41 21.1 21.4 473.89 32 1151 31 54.93 24.7 25.6 622.34 40 925 45 59.97 28.7 29.8 783.63 1250 15 1122 10 26.83 17.5 11.9 150.45 25 1056 16 46.82 23.8 19.9 417.7 32 900 28 54.71 27.8 23.4 566.79 40 778 38 66.26 32.9 28.2 818.26 1000 15 967 3 24.12 17.8 11.8 134.09 25 933 7 46.61 25.2 19.5 407.06 32 889 11 56.83 28.5 23.7 595.62 40 811 19 68.28 32.7 28.6 854.86 833 15 689 17 20.66 19.5 11.8 114.4 25 689 17 42.15 27.9 19 357.94 32 678 19 53.54 31.7 24.4 575.43 40 667 20 65.31 35.3 27.9 796.99
Tab. 2 - Equations for stem, crown and total biomass estimates, and minimum and
maxi-mum diameter values of the sampled trees (source: Menguzzato & Tabacchi 1995, modi-fied).
Planting density
(trees ha-1) Biomass component Equation DBH sampled trees (min-max, cm)
A: 2500 Stem -15.85 + 0.33 dbh2 11.5 - 28.8 Crown -7.14 + 0.16 dbh2 Total -22.76 + 0.49 dbh2 B: 2000 C: 1667 Stem -27.94 + 0.40 dbh 2 10.3 - 29.0 Crown -9.74 + 0.17 dbh2 Total -33.40 + 0.56 dbh2 D: 1250 Stem -12.79 + 0.31 dbh2 13.5 - 32.8 Crown -9.06 + 0.18 dbh2 Total -20.45 + 0.48 dbh2 E: 1000 F: 833 Stem -8.82 + 0.30 dbh 2 15.3 - 35.3 Crown 0.70 + 0.18 dbh2 Total -5.95 + 0.47 dbh2
PL2000, PL1667 and PL1250 were less sub-ject to mortality (about 40%) and the lowest mortality rates were detected in plots of PL1000 and PL833 (about 20%). When the plantation was 40 years old, higher current density was detected in PL2000 (1280 trees ha-1).
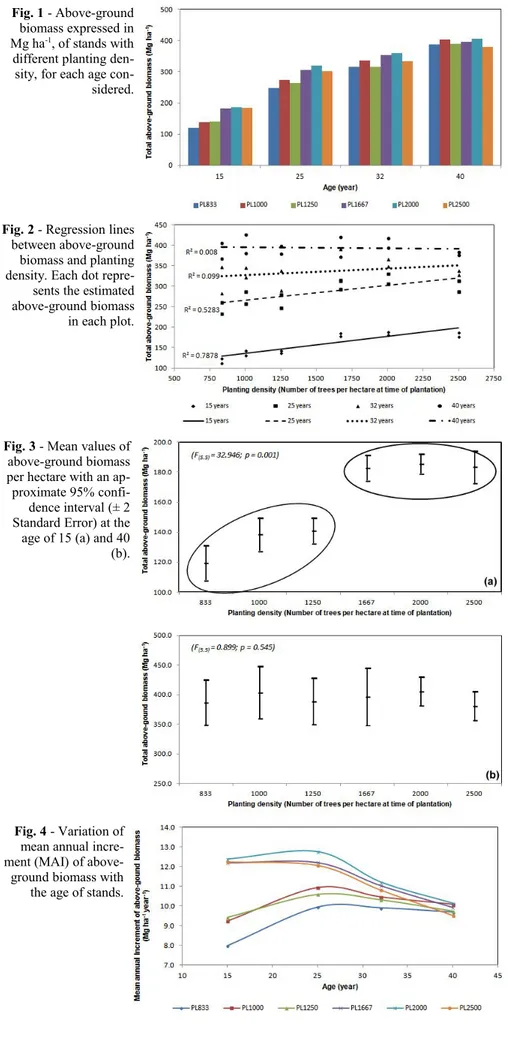
Total above-ground standing biomass at age 15 ranged from 120 to 186 Mg ha-1 (Fig.
1), and reached 400 Mg ha-1 at age 40. At the
age of 15, total above-ground biomass per hectare increased with increasing density from 833 to 1667 trees ha-1 (Fig. 1);
how-ever, the higher biomass stock was detected in PL2000 plots rather than in PL2500 plots. At the age of 25, PL1000 plots showed higher above-ground biomass in comparison to PL1250 plots; at age 40, the plots with higher biomass stock were those in PL1000 and PL2000 (about 405 Mg ha-1), with no
differences between them.
For all the stand ages total above-ground biomass was regressed against planting den-sity (Fig. 2). At the age of 15 R2 was
signifi-cant (0.788), but after 10 years (25 years) R2
was lower (0.527) though still significant. At 32 and 40 years of age, R2 was equal to
0.099 and 0.008, respectively, thus the statis-tic correlation was absent.
At age 25 years above-ground biomass was dependent upon tree density, whereas at older ages the proportionality tended to dis-appear, and at the age of 30 it was totally ab-sent. When the plantation was 40 years old, the highest amount of total biomass was de-tected in PL2000 (about 405 Mg ha-1), while
the lowest was in the PL2500 plots (about 381 Mg ha-1), the other plots showing values
in the range 385-404 Mg ha-1.
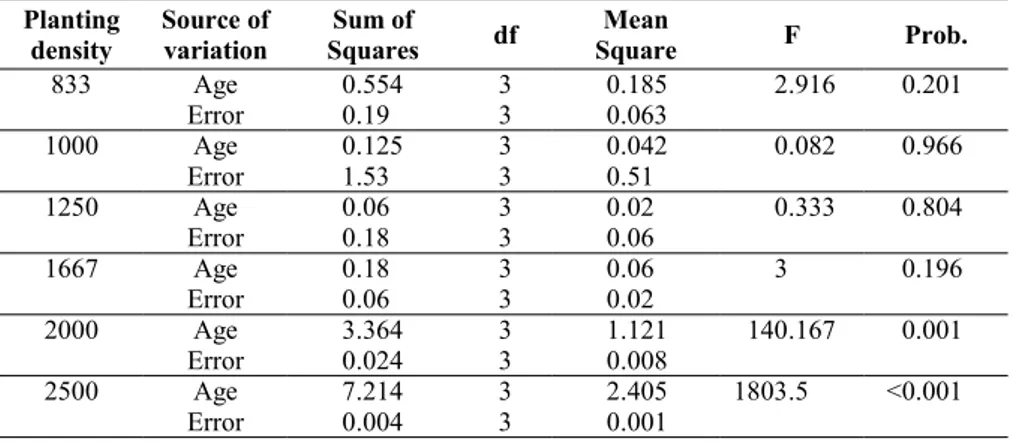
Analysis of variance (ANOVA) was carried out to test for differences between different density plots. Significant difference was found for ages 15 (Fig. 3a) and 25. No signi-ficant difference was found for ages 32 and 40 (Fig. 3b). At age 15 two groups signifi-cantly differed, but within each group no dif-ferences were detected (Fig. 3a). The first group showed higher values of above-ground biomass (on average, 184 Mg ha-1)
and was made up of plots with higher tree density (1667 and 2500 trees ha-1); the
se-cond group showed a mean above-ground biomass of 133 Mg ha-1 and was made up of
plots with lower tree density (833 and 1250 trees ha-1). Ten years later (1992) differences
between the two groups were no more signi-ficant and with increasing age, differences tended to disappear (Fig. 3a).
The mean annual increment (MAI) of total standing above-ground biomass at the age of 40 resulted high in all the plots considered (Fig. 4), reaching 9.8 Mg ha-1 year-1, with no
significant difference between differing plan-ting densities. Differences were significant at ages 15 and 25. Two groups could be distin-guished: (i) the first was made up of plots
Fig. 1 - Above-ground
biomass expressed in Mg ha-1, of stands with
different planting den-sity, for each age con-sidered.
Fig. 2 - Regression lines
between above-ground biomass and planting density. Each dot repre-sents the estimated above-ground biomass in each plot.
Fig. 3 - Mean values of
above-ground biomass per hectare with an ap-proximate 95% confi-dence interval (± 2 Standard Error) at the age of 15 (a) and 40 (b).
Fig. 4 - Variation of
mean annual incre-ment (MAI) of above-ground biomass with the age of stands.
with planting density from 833 to 1250 trees ha-1; (ii) the second was made up of plots
from 1667 to 2500 trees ha-1. In the first
group, at the ages of 15, 25 and 32, the mean annual increments of biomass were lower than those in the second group. Furthermore, at age 15 the differences between mean in-crements in plots with high planting density were null, whereas they were higher in plots with low density. The trend of mean annual increments increased in plots with planting density from 833 to 1250 trees ha-1 until the
age of 25, and then it remained constant. In plots from 1667 to 2500 trees ha-1, the mean
annual increment of biomass slightly slowed down. At the age of 32, mean annual incre-ments resulted to be similar but yet two groups could be detected. At the age of 40 differences disappeared and the culmination of mean biomass increments occurred in low density plots, whereas in higher density plots culmination had been recorded before.
With regard to carbon partitioning to the tree compartments considered, mean crown biomass ranged from 32 to 37% of total above-ground biomass at age 15 (Fig. 5), with significant differences between plots and higher percentage values detected in low density plots. In these plots the percentage of biomass allocated to the crowns was almost constant over time (slightly decreasing), with no significant differences (Tab. 3). In plots with high density the relative share of bio-mass in the crown compartment had a de-creasing trend over time, with no significant differences in PL1667 plots and with signifi-cant differences in PL2000 and PL2500 plots (Fig. 5 and Tab. 3). At the age of 40 crown biomass ranged from 29.5 to 37% of total biomass, with highly significant diffe-rences between plots.
Comparison between methods
The main statistic parameters related to biomass values estimated with allometric equations (Menguzzato & Tabacchi 1995) against constant BEF from inventory (INFC 2005) are shown in Tab. 4. For ages 15 and 25 above-ground biomass estimated with the constant BEF was lower than biomass esti-mated with allometric equations. On the other hand, for ages 32 and 40 above-ground biomass estimated with BEF was higher than biomass estimated with allometric equations. The significance of the biomass estimation differences between the allometric function and the BEF approaches resulted high for all the ages (Tab. 5), indicating that BEF under-estimated biomass on average by 11% for ages 15 and 25 and overestimated biomass on average by 15.7% for older ages. The dif-ferences in biomass estimates using the pai-red-sample t test (T-test) and the Wilkoxon paired-sample test (Z-test) were significant for all the planting densities.
Variation of BEF according to planting
density and age
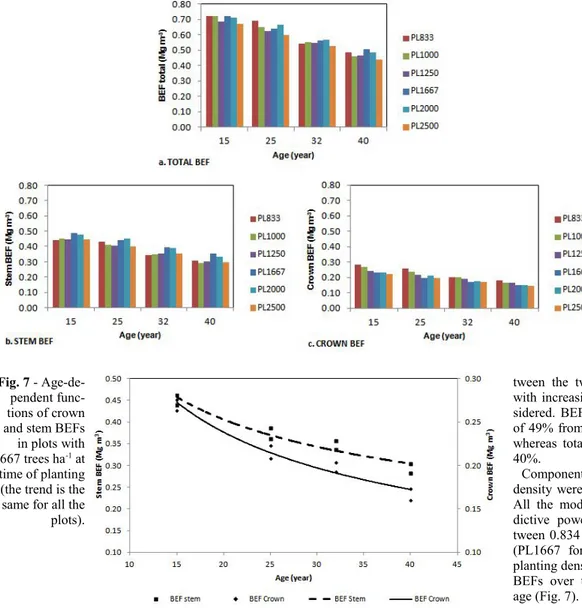
The variation of stand level BEFs, calcu-lated as the ratio between biomass and stem volume, was analyzed for all the plots and ages (Fig. 6). BEFstotal ranged from 0.442 to
0.723 Mg m-3 (Fig. 6a), BEFs
stem from 0.294
to 0.489 Mg m-3 (Fig. 6b) and BEFs crown from
0.145 to 0.283 Mg m-3 (Fig. 6c). At ages 15
and 25, BEFstotal showed a decreasing trend
with increasing planting density, but the cor-relation between density and the relative BEFs was not significant. At older ages the trend completely disappeared. BEFsstem were
higher in the three plots with higher density (Fig. 6b), with significant differences
be-Fig. 5 - The relative
contribution (%) of crown biomass to total above-ground biomass for all the ages of stand.
Tab. 3 - Analysis of variance (ANOVA). Standing biomass by age for each planting density. Planting
density Source ofvariation SquaresSum of df SquareMean F Prob.
833 Age 0.554 3 0.185 2.916 0.201 Error 0.19 3 0.063 1000 Age 0.125 3 0.042 0.082 0.966 Error 1.53 3 0.51 1250 Age 0.06 3 0.02 0.333 0.804 Error 0.18 3 0.06 1667 Age 0.18 3 0.06 3 0.196 Error 0.06 3 0.02 2000 Age 3.364 3 1.121 140.167 0.001 Error 0.024 3 0.008 2500 Age 7.214 3 2.405 1803.5 <0.001 Error 0.004 3 0.001
Tab. 4 - Main statistic parameters of total above-ground biomass estimated with allometric
equations (Wt Allometric) and the constant BEF from the Italian National Forest Inventory
(Wt BEF INFC).
Age
(year) Methods N (Mg haMean-1) Std. Dev.(Mg ha-1) (Mg haMin-1) (Mg haMax-1)
15 Wt Allometric 12 158.6 28 113.7 189 Wt BEF INFC 12 136.5 25.4 96.4 169.4 25 Wt Allometric 12 285.3 29.7 234.4 331.3 Wt BEF INFC 12 269.8 33.6 205.5 318.6 32 Wt Allometric 12 335.6 30 284.5 391.7 Wt BEF INFC 12 370.4 31.8 314.3 421.7 40 Wt Allometric 12 393.8 20 367.8 425.9 Wt BEF INFC 12 504.6 32.1 446.1 570.2
Tab. 5 - Significance of the biomass estimation differences between the allometric equation
and the constant BEF from the Italian National Forest Inventory, assessed by the paired-sam-ple t test (T) and the Wilkoxon paired-sampaired-sam-ple test (Z).
Age T Prob. Z Prob.
15 14.652 <0.001 -3.059 0.002
25 4.412 0.001 -2.824 0.005
32 -12.612 <0.001 -3.059 0.002
tween the two groups. BEFscrown decreased
with increasing density for all the ages con-sidered. BEFscrown showed a larger decrease,
of 49% from the age of 15 to the age of 40, whereas total and stem BEFs decreased by 40%.
Component and total BEFs for all planting density were regressed against age (Tab. 6). All the models provided a reasonable pre-dictive power with R2 values ranging
be-tween 0.834 (PL833 for BEFstotal) and 0.980
(PL1667 for BEFscrown). Regardless of the
planting density, the trend of stem and crown BEFs over time decreased with increasing age (Fig. 7).
Discussion
Biomass stock
The Douglas-fir plantation has a total above-ground carbon stock of 197 Mg C ha-1
at the age of 40, and a mean annual CO2
se-questration of 18 Mg ha-1 y-1. Based on these
estimations, we may consider the Douglas-fir plantation as a carbon sink.
Above-ground biomass was statistically correlated to planting density at young ages (up to 25 years), whereas at older ages the correlation disappeared. Therefore we infer that the total biomass production is not influ-enced by differing planting density over such a long period of time. Results should be in-terpreted in different ways if we consider the short-term and the long-term period. On a short term basis it seems that low planting densities lead to lower carbon stocks and lower carbon uptake than high planting den-sities. In lower density plots mean annual in-crements increased over time, and at the age of 40 stands with 833-1250 trees per hectare still produced high mean increments of
Fig. 6 - Variation of total
(a), stem (b) and crown (c) BEFs with the age of stands, for each planting density.
Fig. 7 -
Age-de-pendent func-tions of crown and stem BEFs in plots with 1667 trees ha-1 at
time of planting (the trend is the same for all the plots).
Tab. 6 - Age-dependent functions for total above-ground, crown and stem dry biomass.
Equation form is BEFi = a (Age)b, where BEFi is the BEF of tree component (Mg m-3); Age
is the independent variable (years); a is the equation constant; b is the equation parameter; R2 is the coefficient of determination; S.E.E. is standard error of estimation.
Compartment Planting density (Trees ha-1) a b R2 S.E.E. Prob.
BEF total 833 2.352 -0.417 0.834 0.078 0.002 1000 2.481 -0.441 0.895 0.064 <0.001 1250 1.993 -0.38 0.906 0.053 <0.001 1667 1.923 -0.356 0.96 0.031 <0.001 2000 2.088 -0.381 0.875 0.061 <0.001 2500 2.099 -0.408 0.913 0.053 <0.001 BEF crown 833 1.055 -0.47 0.882 0.072 <0.001 1000 1.003 -0.47 0.915 0.061 <0.001 1250 0.69 -0.375 0.901 0.052 <0.001 1667 0.763 -0.436 0.98 0.026 <0.001 2000 0.787 -0.433 0.913 0.056 <0.001 2500 0.717 -0.419 0.922 0.051 <0.001 BEF stem 833 1.305 -0.381 0.796 0.081 0.003 1000 1.473 -0.421 0.88 0.065 <0.001 1250 1.311 -0.385 0.909 0.051 <0.001 1667 1.183 -0.318 0.944 0.033 <0.001 2000 1.305 -0.354 0.849 0.063 <0.001 2500 1.381 -0.402 0.911 0.053 <0.001
biomass, while stands with higher tree den-sity had already showed lower mean annual increments nearly five years earlier. Never-theless, plots with 2000 trees ha-1, both at
young and old ages, showed higher stand volume mean annual increments and higher biomass stock, along with 1000 trees ha-1
plots.
Studies on the growth of spruce stands of different initial density (e.g., McClain et al. 1994) report that the denser is the stand, the more intensive is self-thinning and differen-tiation of trees, and that the volume and its maximum increment with age is observed in thinner stands, since the denser is the stand, the earlier this culmination occurs. This is evident in plots with 2500 trees ha-1 analyzed
in the present study, where at age 40 a mor-tality of 62% and a stand volume of 831 m3
ha-1 were detected, against plots with 1000
trees ha-1 where mortality at age 40 was
recorded as 19% and stand volume resulted to be 855 m3 ha-1 (Tab. 1).
In the context of carbon stocking if the har-vest is planned when the stand is 15-25 years old, high density plots can ensure high car-bon stock in the short space of time consi-dered, although this means that wood quality would be poorer. Such young plantations with high tree-density, over few years, both in rural and urban areas, greatly contribute to the creation of many environmental benefits, like CO2 sequestration (McPherson &
Simp-son 2000) and the mitigation of air pollution (Escobedo & Nowak 2009, Marziliano et al. 2013). Regardless the length of cutting cy-cles, planting density could be on average 2000 trees per hectare in order to ensure high biomass production rates, more CO2
se-questration and trees with good bio-mecha-nical characteristics, less susceptible to snow damages and rooting out. If cutting cycles are longer, 1000-1200 trees per hectare could also be a valid choice. Trees would be well formed and stable, with good wood quality (Ciancio et al. 2008) and carbon stock would not be influenced by planting density.
Biomass partitioning
According to the hierarchy priority theory of biomass partitioning, stem growth has a lower priority than foliage and fine root (Waring & Schlesinger 1985, Oliver & Lar-son 1996). Stand density is a factor that has a significant influence on stand carbon allo-cation, since it is known to affect tree crown morphology, which in turn influences the carbon allocation among stems, foliage, and branches (Dicus & Dean 1998). These rela-tions are complex because both stand struc-ture and productivity are associated with dif-ferences in age and site quality (Assmann 1970, Marziliano et al. 2012). As planting density increases, both aboveground and be-lowground intraspecific competition
increa-ses, potentially changing partitioning priori-ties (Burkes et al. 2003), slowing individual tree DBH growth, leading to the live crown receding, which becomes smaller in relation to the stem volume. Light penetration, height growth, crown lifting, and inter-crown abra-sion simultaneously influence the canopy structure (Dean & Long 1992). Canopy size (leaf biomass or leaf area) drives both radia-tion intercepradia-tion and photosynthetic surface area. Owing to more horizontal space avai-lability in low density plots, trees develop wide crowns, partitioning a larger proportion of biomass into branch support because branches are longer, and more foliage is lo-cated further from the stem (Ford 1985). Crown growth rates are further enhanced by a long growing season, favorable tempera-ture regime and soil moistempera-ture conditions, and a lack of disease and insect problems. In low planting density plots biomass allocated to crown represents an important component of above-ground biomass for all the ages of the stand. In plots of 1000 trees ha-1, at age 40
the above-ground biomass stock is the same that in plots of 2000 trees ha-1, although the
crown compartment in the latter contributes only to 31% of total biomass, whereas in 1000 trees ha-1 plots it contributes to nearly
37%. In high planting density plots, after the onset of competition at crown closure, bio-mass allocated to crown decreases, since fo-liage is driven to the top of the canopy as a result of the natural pruning of lower bran-ches (Moller 1947). Both the crown mid-point and the stem increase their height so that more carbon is needed to be allocated to stem to transport the same amount of water to the foliage, increasing the carbon sink strength of the stem (Dean 1991). Even if the individual stems allocate more carbon, the loss due to self-thinning reduces this carbon sink potential so that, at older ages of planta-tions, differences in stem biomass incre-ments between denser and sparser stands are no more significant.
Age-dependent BEFs
The quantification, reporting and verifica-tion of carbon sequestered by forests are fre-quently not as transparent as it should be, and this has major implications on policy de-cisions regarding forest conservation and management (Clark et al. 2001). Availing of the allometric equations built for the area un-der study is a big challenge for improving our knowledge of the carbon cycle in forest ecosystems. When no site/species or forest type specific allometric models are available, it is also possible to use biomass expansion factors, even if conversion from stem volu-mes into whole-tree biomass is one of the notable sources of error in forest carbon in-ventories (Schoene 2002). The aboveground biomass of forests is often estimated with constant BEFs based either on national
stu-dies or IPCC defaults (IPCC 2003), although it is well known that the relative proportions of canopy and stem in the total mass vary over the stand development (Satoo & Mad-gwick 1982). According to IPCC (2003), the uncertainty involved in using generic BEF is approximately 30%, but few authors found errors up to 70% (Ravindranath & Ostwald 2008). Because trees demonstrate different biomass allocation patterns and adaptive strategies in response to abiotic factors such as temperature, water and nutrients, BEFs are hypothesized to vary with forest types and abiotic factors, although such variation has not been well examined to date (Vande Walle et al. 2005). Major changes in silvi-cultural practices that might lead to changes in tree allometry, affecting diameter distribu-tions and stocking density of the stands, could also influence BEF values. The results of this study showed that BEFs expressed as ratio of biomass to volume varied with age and with planting density at the same age, confirming that the adoption of constant BEFs is limiting and misleading. BEFs de-termined in this study differed from BEFs published for Douglas-fir by other authors. Levy et al. (2004) report a mean value of above-ground BEF of 1.38, which is higher than that found in this study. However, no specific works on BEF have been carried out so far for Mediterranean Douglas-fir planta-tions or in similar condiplanta-tions, so a compa-rison is unfeasible.
Variation of BEF also occurred in the com-partment level. In all plots stem, crown and total above-ground BEFs decreased over years, but they resulted different between differing planting density plots. BEFscrown
had higher values in thinner plots, whereas BEFsstem were higher in denser stands. As
re-ported by other authors (Correia et al. 2010) BEFscrown decreased with increasing density,
and BEFsstem increased with increasing
den-sity. Generally, BEF values are high at low stand growing stem volumes or biomass, and decrease to a constant BEF at a high stand growing stem biomass. The size-dependent pattern in BEF is generally expected to be similar to what happens for basic wood den-sity. Such patterns have been reported by Lehtonen et al. (2004) and Kauppi et al. (1995). These results can be explained by the fact that trees grown in low-density stands usually contain relatively more bio-mass in branches and foliage than trees grown in high-density stands. When cano-pies become closed, the stems continue to accumulate dry matter, but as new branches and foliage are grown the oldest die and fall off (Kauppi et al. 1995). The decline in BEF may be associated with changes in biomass allocation in younger stands, such as a grea-ter increment in stem wood, relative to non-woody biomass.
between differing planting densities can be also accounted for by the influence of stand density on wood basal density and tree rings width. The difference in wood density and its radial trends reflect growth strategy and biomechanical considerations. Such varia-tions in wood basal density are not conside-red when constant BEFs from inventory are applied, but it varies among tree compart-ments and it largely depends both on density and on environmental conditions. Somogyi et al. (2007) suggest adopting various cor-rection factors to use the density of the ap-propriate components of tree to convert vo-lume to biomass.
When selecting or developing BEF values, care should be taken that they are representa-tive of the forest population to which they will be applied, with respect to the species and according to tree size. The relative share of biomass components (e.g., foliage and branches) varies during stand development, according to age (Lehtonen et al. 2004), fer-tility (Wirth et al. 2004) and stand density (Correia et al. 2010).
Conclusion
It is fundamental to assess the carbon stock in these Mediterranean exotic species planta-tions whose original purpose was to ensure a prompt forest cover on abandoned land. Over the years they also provided high car-bon uptake and protection from hydrogeo-logical risks. The results of this study may be helpful for devising forest management strategies. Regardless of economic conside-rations, when the priority is to ensure high carbon stock, the planting density becomes a primary issue only if cutting cycles are very short.
The variability of BEF with age found in this study demonstrates that the use of con-stant BEF from national inventories can be misleading. Diameter distributions, age and stocking density of the stand affect the varia-tion of BEFs. Therefore, the use of the con-version factors from national inventories, of-ten based on relatively few sites sampled in various ecosystem studies, may lead to bia-sed estimates of forest carbon stocks. As a consequence, the age-dependent BEF equa-tions presented here are applicable to stands with similar diameter distribution and tree allometry, i.e., they could be applied to Dou-glas-fir forests aged between 15 and 40, with differing tree-density and spacing and with an average stock of biomass of 400 Mg ha-1.
References
Assmann E (1970). The principles of forest yield study. Studies in the organic production, struc-ture, increment and yield of forest stands. Perga-mon Press, Oxford, UK, pp. 506.
Bartoli M (1971). Premier résultats (a 11 et 15 ans) d’une expérience de densité sur le Douglas [First results (ages 11 and 15) of a density
expe-rience on Douglas-fir]. Revue Forestière Fran-çaise 23 (6): 605-608. [in French] - doi: 10.426 7/2042/205 35
Burkes EC, Will RE, Barron-Gafford GA, Teskey RO, Shiver B (2003). Biomass partitioning and growth efficiency of intensively managed Pinus
taeda and Pinus elliottii stands of different
plan-ting densities. Forest Science 49 (2): 224-234. [online] URL: http://www.ingentaconnect.com/ content/saf/fs/2003/00000049/00000002/art0000 6
Cantore V, Iovino F (1989). Effetti dei dirada-menti sull’umidità del suolo in popoladirada-menti di douglasia della Catena Costiera (Calabria) [Ef-fects of thinning on soil water content in Dou-glas-fir stands in the Coastal Chain (Calabria)]. Annali dell’Istituto Sperimentale per la Selvi-coltura 20: 13-39. [in Italian]
Ciancio O (1971). Sul clima e sulla distribuzione altimetrica della vegetazione forestale in Cal-abria [Climate and altimetric distribution of fo-rest vegetation in Calabria]. Annali dell’Istituto Sperimentale per la Selvicoltura Arezzo 2: 321-370. [in Italian]
Ciancio O, Mercurio R, Nocentini S (1982). Le specie forestali esotiche nella selvicoltura ita-liana [Exotic forest species in the Italian silvicul-ture]. Annali dell’Istituto Sperimentale per la Selvicoltura Arezzo 12/13: 731. [in Italian] Ciancio O, Garfì V, Menguzzato G (2005). Effetti
della densità di impianto sulla produzione in pi-antagioni di douglasia [Effects of planting den-sity on productivity of Douglas fir plantations]. In: Proceedings of the IV SISEF Congress “Meri-diani Foreste” (Caivano F, Girardi T, Pierangeli D, Borghetti M eds). Rifreddo (PZ, Italy) 7-10 Oct 2003. SISEF, Potenza, Italy, pp. 87-93. [in Italian]
Ciancio O, Garfì V, Marziliano PA, Menguzzato G, Pelle L (2008). Effetti della densità di impian-to in popolamenti di douglasia [Effects of plant-ing densitiy on douglas fir stands]. L’Italia Fore-stale e Montana 59 (6): 519-534. [in Italian with English Absract] - doi: 10.4129/IFM.2008.6.05 Clark DA, Brown S, Kicklighter DW, Chambers
JQ, Thomlinson JR, NI J (2001). Measuring net primary production in forests: concepts and field methods. Ecological Applications 11: 356370. -doi: 10.1890/1051-0761(2001)011[0356:MNPP IF]2.0.CO;2
Corona P, Marziliano PA, Scotti R (2002). Top-down growth modelling: a prototype for poplar plantations in Italy. Forest Ecology and Manage-ment 161: 65-73. - doi: 10.1016/S0378-1127(01) 00481-9
Correia AC, Tomé M, Pacheco CA, Faias S, Dias AC, Freire J, Carvalho PO, Pereira JS (2010). Biomass allometry and carbon factors for a Mediterranean pine (Pinus pinea L,) in Portugal. Forest Systems 19 (3): 418-433. - doi: 10.5424/ fs/2010193-9082
Dean TJ, Long JN (1992). Influence of leaf area and canopy on size-density relations in even-aged lodgepole pine stands. Forest Ecology and Management 49: 109-117. - doi: 10.1016/0378-1127(92)90164-5
Dean TJ (1991). Effect of growth rate and wind sway on the relation between mechanical and water-flow properties in slash pine seedlings. Canadian Journal of Forest Research 21 (10): 1501-1506. - doi: 10.1139/x91-210
Devine WD, Harrington TB, Terry TA, Harrison RB, Slesak RA, Peter DH, Harrington CA, Shilling CJ, Schoenholtz SH (2011). Five year vegetation control effects on aboveground bio-mass and nitrogen content and allocation in Dou-glas-fir plantations on three contrasting sites. Forest Ecology and Management 262: 2187-2198. - doi: 10.1016/j.foreco.2011.08.010 Dickens ED, Barnett JP, Hubbard WG, Jokela EJ
(2004). Slash pine: still growing and growing! Gen. Tech. Rep. SRS-76, USDA Forest Service, Southern Research Station, Asheville, NC, USA, pp. 148.
Dicus CA, Dean TJ (1998). Stand density effects on biomass allocation patterns and subsequent soil nitrogen demand. In: Proceedings of the “9th
Biennial Southern Silvicultural Research Confe-rence” (Waldrop TA ed). Clemson (SC, USA) 25-27 Feb 1997. Gen. Tech. Report SRS-20, Southern Research Station, USDA Forest Servi-ce, Ashevill, NC, USA, pp. 564-568.
Escobedo FJ, Nowak DJ (2009). Spatial hetero-geneity and air pollution removal by an urban forest. Landscape and Urban Planning 90: 102-110. - doi: 10.1016/j.landurbplan.2008.10.021 FAO (1998). World reference base for soil
re-sources. The latest WRB classification manual. Food and Agriculture Organization of the United Nations, Rome, Italy, pp. 128.
Ford ED (1985). Branching. crown structure and control of timber production. In: “Attributes of trees as crop plants” (Cannell MGR, Jackson JE eds). Institute of Terrestrial Ecology, Abbots Ripton, UK, pp. 228-252.
Houghton JT, Meira Filho LG, Lim B, Treanton K, Mamaty I, Bonduki Y, Griggs DJ, Callander BA (1997). Revised 1996 guidelines for national greenhouse gas inventories. IPCC/OECD/IEA, Paris, France.
INFC (2005). Linee generali del progetto per il secondo inventario forestale nazionale italiano [General guidelines of the project for the second national italian forest inventory]. In: “Inventario Nazionale delle Foreste e dei serbatoi forestali di Carbonio” (De Natale F, Floris A, Gasparini P, Scrinzi G, Tabacchi G, Tosi V eds). MiPAF - Is-pettorato Generale del Corpo Forestale dello Stato, ISAFA, Trento, Italy, pp. 57. [in Italian] IPCC (2003). Good practice guidelines for land
use, land-use change and forestry. Intergovern-mental Panel on Climate Change, Institute for Global Environmental Strategies (IGES) for the IPCC, Hayama, Japan, pp. 599. [online] URL: http://www.ipcc-nggip.iges.or.jp/public/gpgluluc f/gpglulucf.html
Jones EP (1987). Slash pine plantation study - age 30. In: Proceedings of the “4th Biennial Southern
Silviculture Conference” (Phyllips JR ed). At-lanta (GA, USA) 4-6 Nov 1986. Gen. Tech. Rep. SE-42, Southeastern Forest Experiment Station, USDA Forest Service, Asheville, NC, USA, pp.
45-49.
Kauppi PE, Tomppo E, Ferm A (1995). C and N storage in living trees within Finland since 1950s. Plant and Soil 168169 (1): 633638. -doi: 10.1007/BF00029377
Kenk G (1981). Auswirkungen von Douglasien-Pflanzverbanden auf Aststarken und Vernutzung sowie Uberlegungen zur Astungshohe [Impacts of planting density in a Douglas-fir plantation on the branches basal diameter and insertion height]. Allg Forst und Jagdzeitung 152 (8/9): 168-180. [in German]
La Marca O (1985). Preliminary results on spa-cing of trees in some Douglas-fir plantations in Italy. In: Proceedings of the IUFRO Project Group P4.02.02 Meeting “The influence of spac-ing and selectivity in thinnspac-ing on stand develop-ment. Operations and economy” (Gallagher G ed). Dublin (Ireland) 24-28 Sep 1984. IUFRO, Vienna, Austria, pp 169.
La Marca O, Marziliano PA, Moretti N (1998). Experimental research in ageing holm oak (Quercus ilex L.) coppices: preliminary results. Annales des Sciences Forestières 55: 461476. -doi: 10.1051/forest:19980406
Lehtonen A, Mäkipää R, Heikkinen J, Sievänen R, Liski J (2004). Biomass expansion factors (BEF) for Scots pine. Norway spruce and birch according to stand age for boreal forests. Forest Ecology and Management 188: 211-224. - doi: 10.1016/j.foreco.2003.07.008
Levy PE, Hale SE, Nicoll BC (2004). Biomass ex-pansion factors and root:shoot ratios for conife-rous tree species in Great Britain. Forestry 77: 421-430. - doi: 10.1093/forestry/77.5.421 Marziliano PA, Menguzzato G, Scuderi A, Corona
P (2012). Simplified methods to inventory the current annual increment of forest standing vol-ume. iForest 5: 276-282. - doi: 10.3832/ifor063 5-005
Marziliano PA, Lafortezza R, Colangelo G, Da-vies C, Sanesi G (2013). Structural diversity and height growth models in urban forest plantations: A case-study in northern Italy. Urban Forestry and Urban Greening 12 (2): 246-254. - doi: 10.1016/j.ufug.2013.01.006
McClain KM, Morris DM, Hills SC, Buse LJ (1994). The effects of initial spacing on growth and crown development for planted northern
conifers: 37-year results. The Forestry Chronicle 70 (2): 174-182. - doi: 10.5558/tfc70174-2 McPherson EG, Simpson JR (2000). Carbon
di-oxide reductions through urban forestry: guide-lines for professional and volunteer tree planters. Report no. PSW GTR-171, Pacific Southwest Research Station, USDA Forest Service, Albany, CA, USA, pp. 237.
Menguzzato G, Tabacchi G (1995). Prove speri-mentali sulle distanze d’impianto in piantagioni di douglasia sulla Catena Costiera (Calabria) [Experimental trials on planting densities in Douglas fir plantations on the Coastal Chain (Calabria)]. L’Italia Forestale e Montana 50 (2): 170-189. [in Italian]
Mitchell KJ, Oswald H, Ottorini JM (1983). Mo-delling the growth of Douglas-fir in France. Mit-teilungen der Forstlichen Bundesversuchsanstalt Wien 147:25-39.
Moller CM (1947). The effect of thinning, age, and site on foliage, increment, and loss of dry matter. Journal of Forestry 45: 393-404. Montgomery D (2001). Introduction to statistical
quality control (4th edn). John Wiley & Sons,
New York, USA, pp. 795.
Oliver CD, Larson BC (1996). Forest stand dy-namics (update edn). John Wiley and Sons, New York, USA, pp. 467
Pavari A (1959). Le classificazioni fitoclimatiche ed i caratteri della stazione [Phytoclimatic classi-fications and station characteristics]. Scritti di ecologia selvicoltura e botanica forestale, pp. 45-116. [in Italian]
R Development Core Team (2008). R: a language and environment for statistical computing. R Foundation for Statistical Computing, Vienna, Austria. [online] URL: http://www.R-ptoject.org Ravindranath NH, Ostwald M (2008). Carbon
in-ventory methods. Handbook for greenhouse gas inventory, carbon mitigation and roundwood production projects. Advances in Global Change Research 29, Springer, Heidelberg, Germany, pp. 304.
Reukema DL (1979). Fifty-year development of Douglas-fir stands planted at various spacings. Research Paper PNW-253, Pacific Northwest Forest and Range Experiment Station, USDA Forest Service, Portland, OR, USA, pp. 21. Sanesi G, Lafortezza R, Marziliano PA, Ragazzi
A, Mariani L (2007). Assessing the current status of urban forest resources in the context of “Parco Nord”, Milan, Italy. Landscape and Ecological Engineering 3: 187-198. - doi: 10.1007/s11355-007-0031-2
Satoo T, Madgwick HAI (1982). Forest biomass. Martinus Nijhoff/Junk, The Hague, London, pp. 152.
Schoene D (2002). Terminology in assessing and reporting forest carbon change. In: “Second ex-pert meeting on harmonizing forest-related defi-nitions for use by various stakeholders”. FAO, Rome, Italy, pp. 8.
Soliani L (2008). Statistica applicata [Applied sta-tistics]. UNI.NOVA, Parma, Italy, pp. 694. Somogyi Z, Cienciala E, Mäkipää R, Muukkonen
P, Lehtonen A, Weiss P (2007). Indirect methods of large-scale forest biomass estimation. Euro-pean Journal of Forest Research 126 (2): 197-207. - doi: 10.1007/s10342-006-0125-7 Tabacchi G, Di Cosmo L, Gasparini P (2011).
Aboveground tree volume and phytomass predic-tion equapredic-tions for forest species in Italy. Euro-pean Journal of Forest Research 130 (6): 911-934. - doi: 10.1007/s10342-011-0481-9 UNEP (1997). Kyoto protocol to the United
Na-tions framework convention on climate change. United Nations Environmental Program, Kyoto, Japan, pp. 20.
Vande Walle I, Van Camp N, Perrin D, Lemeur R, Verheyen K, Van Wesemael B, Laitat E (2005). Growing stock-based assessment of the carbon stock in the Belgian forest biomass. Annals of Forest Science 62 (8): 853-864. - doi: 10.1051/ forest:2005076
Waring RH, Schlesinger WH (1985). Forest eco-systems: concepts and management. Academic Press, Orlando, FL, USA, pp. 340.
Wirth C, Schumacher J, Schulze ED (2004). Generic biomass functions for Norway spruce in central Europe - a meta-analysis approach to-ward prediction and uncertainty estimation. Tree Physiology 24: 121-139. - doi: 10.1093/treephys/ 24.2.121
Zar JH (1996). Biostatistical analysis (3rd edn).
Prentice Hall Inc., Englewood Cliffs, NJ, USA, pp. 718.