Changes in total plasma and serum
N-glycome composition and
patient-controlled analgesia after
major abdominal surgery
Ivan Gudelj
1, Marco Baciarello
2,3,4, Ivo Ugrina
1,5, Manuela De Gregori
3,6,7, Valerio Napolioni
3,8,
Pablo M. Ingelmo
3,9, Dario Bugada
2,3,4, Simona De Gregori
10, Lovorka Đerek
11,
Maja Pučić-Baković
1, Mislav Novokmet
1, Olga Gornik
5, Gloria Saccani Jotti
12,
Tiziana Meschi
13, Gordan Lauc
1,5& Massimo Allegri
2,3,4Systemic inflammation participates to the complex healing process occurring after major surgery, thus directly affecting the surgical outcome and patient recovery. Total plasma N-glycome might be an indicator of inflammation after major surgery, as well as an anti-inflammatory therapy response marker, since protein glycosylation plays an essential role in the inflammatory cascade. Therefore, we assessed the effects of surgery on the total plasma N-glycome and the association with self-administration of postoperative morphine in two cohorts of patients that underwent major abdominal surgery. We found that plasma N-glycome undergoes significant changes one day after surgery and intensifies one day later, thus indicating a systemic physiological response. In particular, we observed the increase of bisialylated biantennary glycan, A2G2S[3,6]2, 12 hours after surgery, which progressively increased until 48 postoperative hours. Most changes occurred 24 hours after surgery with the decrease of most core-fucosylated biantennary structures, as well as the increase in sialylated tetraantennary and FA3G3S[3,3,3]3 structures. Moreover, we observed a progressive increase of sialylated triantennary and tetraantennary structures two days after surgery, with a concomitant decrease of the structures containing bisecting N-acetylglucosamine along with bi- and trisialylated triantennary glycans. We did not find any statistically significant association between morphine consumption and plasma N-glycome.
Glycosylation is an essential post-translational modification affecting the structure and the function of thousands of proteins1. The functional importance of glycosylation stems from the fact that glycans are integral parts of
protein structure, but contrary to polypeptide parts, which are defined by the corresponding gene nucleotide sequences, glycan structures are versatile and responsive to environmental stimuli2,3. For more than 30 years it has
been known that glycans undergo significant changes during pathological states4. Indeed, a recent comprehensive
report endorsed by the US National Academies stated “glycans are directly involved in the pathophysiology of every
major disease” and that “additional knowledge from glycoscience will be needed to realize the goals of personalized medicine and to take advantage of the substantial investments in human genome and proteome research and its
1Genos Glycoscience Research Laboratory, Zagreb, Croatia. 2Department of Anesthesia, ICU and Pain Therapy,
University Hospital of Parma, Parma, Italy. 3SIMPAR Group (Study in Multidisciplinary Pain Research), Parma, Italy. 4Department of Surgical Sciences, University of Parma, Parma, Italy. 5University of Zagreb Faculty of Pharmacy and
Biochemistry, Zagreb, Croatia. 6Pain Therapy Service, Fondazione IRCCS Policlinico S. Matteo, Pavia, Italy. 7YAP
(Young Against Pain) group, Parma, Italy. 8Department of Neurology and Neurological Sciences, Stanford University
School of Medicine, Palo Alto, CA, USA. 9Department of Anesthesia, Montreal Children’s Hospital, Canada. 10Clinical
and Experimental Pharmacokinetics Unit, Fondazione IRCCS Policlinico San Matteo, Pavia, Italy. 11Department
of Medical Biochemistry and Laboratory Medicine, Clinical Hospital Merkur, Zagreb, Croatia. 12Department of
Biomedical, Biotechnological and Translational Science (S.Bi.Bi.T.), University of Parma, Parma, Italy. 13Department
of Clinical and Experimental Medicine, University of Parma, Italy. Correspondence and requests for materials should be addressed to M.A. (email: [email protected])
Received: 22 March 2016 Accepted: 15 July 2016 Published: 09 August 2016
OPEN
impact on human health”5. Notably, glycans seem to play a particularly important role in the immune system as
inter-individual variation in glycosylation may affect immune responses at multiple levels6 and their biomarker
potential has been recognized7,8.
Major surgery provokes a vigorous inflammatory response with important clinical implications9,10. However,
the factors influencing incidence and severity of clinical outcomes associated with the inflammatory response (including life-threatening perioperative complications), are currently not well understood, even though the connection between inflammation and pain has already been investigated10 and inflammatory background may
even influence the response to therapies11. Furthermore, the level of perceived pain varies significantly between
individuals undergoing very similar surgery12 and genetics may be helpful in predicting postoperative pain and
morphine consumption13–15. Recent studies revealed the existence of a significant inter-individual variability in
both total plasma and IgG glycome composition16,17, which turned out to be associated with several pathological
states18–21.
Whether simultaneous changes in inflammatory response pain and glycome composition have a common genetic background is not known; arguably, higher pain is associated with higher systemic inflammation and whole glycome changes, and the existence of a shared genetic component is conceivable. In the present work we studied the effects of surgery on protein glycosylation and its potential association with self-administration of morphine in the postoperative period by evaluating total plasma N-glycome in two cohorts of patients undergo-ing major abdominal surgery and in a replication cohort.
Results
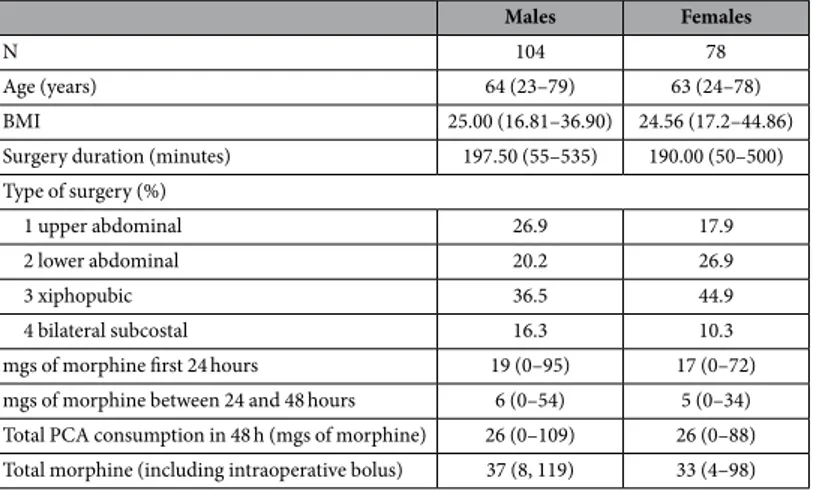
Two cohorts of patients who underwent major abdominal surgeries were studied. In the discovery cohort, we ana-lyzed total plasma N-glycome of 182 patients (104 males and 78 females) from two hospitals at five time points: intraoperative and 6, 12, 24, 48 hours after the surgery. The patients underwent either upper abdominal, lower abdominal, xiphopubic or bilateral subcostal surgery. They also self-regulated pain by administrating morphine. Morphine and its main metabolites (morphine-3-glucuronide and morphine-6-glucuronide) were measured by using reversed phase HPLC coupled with mass spectrometry (HPLC-MS/MS), based on sample deproteinization by the addition of acetonitrile as previously described13. Basic descriptives of this cohort are reported in Table 1.
No changes in the composition of plasma N-glycome occurred during the first six hours after the surgery (see Fig. 1, Supplementary Table S1), beside a statistically significant increase in biantennary glycans and a decrease in the sialylation of triantennary and tetraantennary structures (see Supplementary Table S2). A statistically sig-nificant increase in the most abundant structure of human plasma N-glycome, (bisialylated biantennary gly-can, A2G2S[3,6]2; GP20) was observed 12 hours after surgery. This was the only structure increasing during this period, and it showed a progressive increase for 48 hours after the surgery. Concomitantly, the amount of non-fucosylated sialylated triantennary glycans A3G3S[3,6]2 (GP24), A3G3S[3,3]2 (GP26) and A3G3S[3,3,3]3 (GP27) decreased.
Most significant changes were observed 24 hours after the surgery and were opposite compared to the ones occurring during the first six hours after surgery. In that period, the majority of core-fucosylated biant-ennary structures decreased, while sialylated tetraantbiant-ennary and FA3G3S[3,3,3]3 (GP29) structures increased. Besides A2G2S[3,6]2 (GP20), a continuing increase of sialylated triantennary and tetraantennary structures could be noticed two days after surgery (Fig. 2, Table 2). In the same period all structures containing bisecting
N-acetylglucosamine (GlcNAc) strongly decreased together with continuous decrease of bi- and trisialylated
tri-antennary (A3G3S[3,6]2 (GP24) and A3G3S[3,3,6]3 (GP28)) glycans.
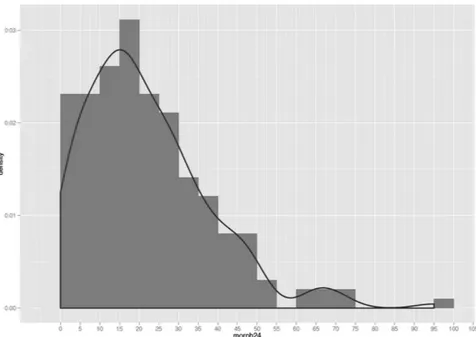
Consumption of morphine showed a quasi-Poisson distribution (Fig. 3). We did not find any statistically sig-nificant associations in the discovery cohort between the postoperative PCA morphine consumption and plasma N-glycome. Multiple box plots showing glycoprotein levels at baseline and at 6-hour after the surgery by morphine consumption group (determined at 24-hours after the surgery) are reported in Supplementary Figs S1 and S2.
Males Females
N 104 78
Age (years) 64 (23–79) 63 (24–78)
BMI 25.00 (16.81–36.90) 24.56 (17.2–44.86)
Surgery duration (minutes) 197.50 (55–535) 190.00 (50–500) Type of surgery (%)
1 upper abdominal 26.9 17.9
2 lower abdominal 20.2 26.9
3 xiphopubic 36.5 44.9
4 bilateral subcostal 16.3 10.3
mgs of morphine first 24 hours 19 (0–95) 17 (0–72)
mgs of morphine between 24 and 48 hours 6 (0–54) 5 (0–34) Total PCA consumption in 48 h (mgs of morphine) 26 (0–109) 26 (0–88) Total morphine (including intraoperative bolus) 37 (8, 119) 33 (4–98)
Table 1. Discovery cohort characteristics. Data are expressed as median (range) unless otherwise stated. BMI = Body Mass Index, PCA = Patient Controlled Analgesia.
Given that similar changes in glycosylation can be seen in both plasma and serum22, for replication cohort
we analyzed total serum N-glycomes of 28 patients. Basic descriptive information about this cohort is provided in Table 3. Sera samples were taken at three different time points: prior to surgery, and 24 and 48 hours after the surgery. Decrease of biantennary together with decrease of sialylated triantennary structures was presented one day after the surgery. At the same time, increase in sialylated tetraantennary and FA3G3S[3,3,3]3 (GP29) glycans, as well as in the most abundant structure in the human plasma N-glycome A2G2S[3,6]2 (GP20) could be seen (see Supplementary Table S3). Continuing decrease of biantennary and some of sialylated triantennary structures was observed two days after surgery (Fig. 4, Table 4). In the same period, the increase of triantennary and tetraantennary together with continuing increase of A2G2S[3,6]2 was noticed. Even though the majority of changes observed in the discovery study were observed also in the replication study (see Supplementary Table S4), the number of structures which showed decrease after 24 hours and increase after 48 hours was a little bit higher in the replication cohort, compared to the discovery cohort, which could be due to an artifact of increased penal-ization in multiple testing correction due to only two time points in the replication cohort compared to four time points in the discovery cohort.
Discussion
In the present work we found that the plasma N-glycome undergoes significant changes after major abdominal surgery using two independent cohorts. Most of the changes occurred one day after the surgery and intensified one day later, thus indicating a systemic physiological response. The fact that only minor changes were observed six hours after surgery is not unexpected, since during this period the main inflammatory response is proximal to the place of surgery; which corresponds to a model of a biphasic inflammatory response after a gut surgery with activation of macrophages in the intestinal muscularis followed with leukocyte infiltration 24 hours after surgery23. Maximal changes in the plasma N-glycome coincide with the maximal increase in Interleukin 6 (IL6)
expression, observed between 4 and 24 hours after surgery and remained elevated for up to 48–72 hours24–28. IL6
is believed to be an important regulator of plasma protein levels during inflammation27, and a recent GWAS study
reported the association of single nucleotide polymorphisms in IL6 with IgG glycome composition29, indicating
that this pro-inflammatory cytokine might be involved in the observed alterations of plasma N-glycome. A first limitation of our study is that we can not exactly rule out which correlation exists between systemic inflammatory response and glycome changes, and whether the same results could be retrieved in a different surgical cohort (receiving less invasive surgical procedures, likely to activate lower inflammatory response). Further studies should compare cytokines’ production with glycome variations in different types of surgical procedures (likely to be associated with different degrees of systemic inflammation).
When studying plasma glycome, it is important to acknowledge that variations in plasma protein concentra-tions are inseparable from changes in glycosylation of individual proteins. The human plasma N-glycome displays a significant inter-individual variability16, but within an individual it is temporally stable in homeostatic condition30.
To alleviate the problem of inter-individual variation, for every patient we matched each post-operative sample to its relative pre-operatory sample as baseline control. Previously, we reported that the human plasma N-glycome can rapidly change when homeostasis is disrupted20 and this observation was confirmed in this study. A notable
increase of triantennary and tetraantennary sialylated structures (all sialylated tetraantennary structures of the human plasma N-glycome with antennary fucose were presented in the group of structures which increased during inflammation) was observed within the first 24 hours after surgery and continued for the next 24 hours. These tetraantennary tetrasialylated structures with fucose on the outer arm are also known as the sialyl-Lewis Figure 1. Representative chromatogram of 2-AB labeled N-linked glycans released from the plasma proteins and separated by HILIC-UPLC. The integration areas, together with a major structure presented in each glycan group are given. Glycan groups are numbered from GP1-GP39, as used in the paper.
X antigen, which has been already associated with inflammation31 and demonstrated to play an important role
in leukocytes’ interaction with selectin ligands and initiation of inflammation32–34. Moreover, a strong decrease
of all structures containing bisecting GlcNAc could be linked to the need of higher cell mobility during the inflammatory process. Indeed, bisecting GlcNAc confers unique lectin recognition properties to N-glycans and it obstructs other GlcNAc-trasferases that serve to form multiantennary sugar chains therefore leading to decrease in branch formation of N-glycans35. Since we observed increased branching during inflammation, the decrease
of bisecting GlcNAc is not unexpected. Also, we noticed a slight decrease of sialylated tetraantennary along with an increase of biantennary structures six hours after surgery, which represents an opposite situation compared to what observed after 24 hours. This evidence is in line with our previous findings20 (Fig. 5), although the same
declines and increases were observed a few hours later. This delay may be attributable to the different molecular mechanism underlying the inflammatory response after cardiac and abdominal surgeries.
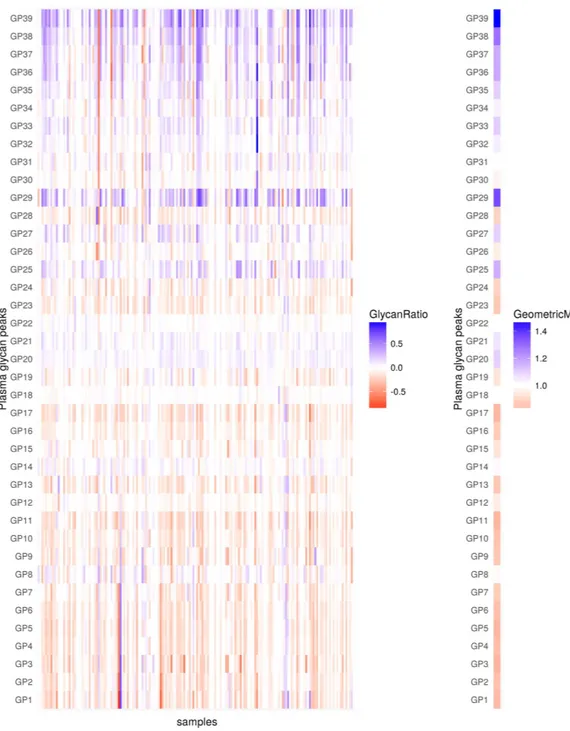
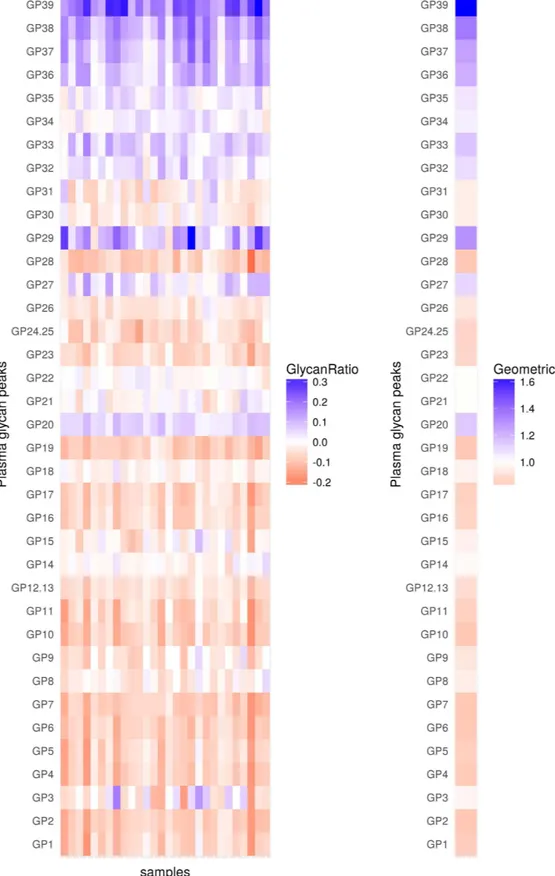
Figure 2. Changes in levels (abundance) of plasma glycans between day 0 and day 2 for the discovery cohort. Changes are presented through the logarithm of relative changes log10 (day2/day0) in the left plot and
the geometric mean (as a measure of trends) of relative changes (day2/day0) in the right plot. The red color indicates decrease in glycan level and blue color indicates increase in glycan level; intensity of colors indicates the intensity of the changes. All changes are presented with respect to levels before the surgery.
We would like to investigate if the changes of morphine consumption could be affected also from the glyco-sylation of proteins as it could also affect bioavailability of the drug. Unfortunately, we did not find any statisti-cally significant associations in the discovery cohort between the postoperative PCA morphine consumption and plasma N-glycome.
These results could be affected by the fact that the changes mentioned above cannot be exclusively attrib-uted to the changes in glycosylation but also to the impact of changes in plasma protein composition. With the employed method we are not able to determine the main cause of the changes in the plasma N-glycome. After albumin, IgG is the most abundant protein in the human plasma and the most abundant glycoprotein36. The
human IgG N-glycome is very well known17 as well as the influence of IL6 on its synthesis25. It is interesting to
notice that IgG has been positively correlated with serum IL6 concentration during inflammation25, yet from
our results it seems the IgG-linked N-glycans do not increase during inflammation. Moreover, we have observed a decrease of bianntenary N-glycan structures coming from IgG17,36. In addition, positive acute-phase proteins
(APPs), such as α 1-acid glycoprotein, α 1-antitrypsin, hemopexin, vitronectin and ceruloplasmin are known to
carry abundance of sialylated trianntenary and tetraantennary N-glycans37–44. The observed changes in those
structures in our study probably originate from the changes in the levels of plasma proteins rather than changes
Glycan Mean IQR Slope SE p p adjusted
GP1 4.281 2.402 − 0.013 0.001 < 0.001 < 0.001 GP2 1.997 0.817 − 0.017 0.002 < 0.001 < 0.001 GP3 0.123 0.062 − 0.017 0.001 < 0.001 < 0.001 GP4 2.941 1.159 − 0.019 0.001 < 0.001 < 0.001 GP5 1.538 0.69 − 0.019 0.001 < 0.001 < 0.001 GP6 1.107 0.448 − 0.017 0.001 < 0.001 < 0.001 GP7 0.968 0.301 − 0.016 0.002 < 0.001 < 0.001 GP8 1.217 0.374 0 0.002 0.869 1 GP9 0.112 0.045 − 0.011 0.002 < 0.001 < 0.001 GP10 2.743 1.051 − 0.017 0.001 < 0.001 < 0.001 GP11 0.625 0.274 − 0.016 0.001 < 0.001 < 0.001 GP12 1.165 0.253 − 0.008 0.001 < 0.001 < 0.001 GP13 0.607 0.259 − 0.015 0.001 < 0.001 < 0.001 GP14 13.466 2.852 0.006 0.002 < 0.001 0.002 GP15 0.566 0.18 − 0.008 0.001 < 0.001 < 0.001 GP16 4.149 1.259 − 0.017 0.001 < 0.001 < 0.001 GP17 1.767 0.799 − 0.014 0.001 < 0.001 < 0.001 GP18 3.593 0.918 − 0.002 0.001 0.028 0.278 GP19 0.855 0.273 − 0.009 0.002 < 0.001 < 0.001 GP20 33.538 4.973 0.021 0.001 < 0.001 < 0.001 GP21 0.741 0.152 0.012 0.001 < 0.001 < 0.001 GP22 3.907 0.986 − 0.001 0.001 0.193 1 GP23 1.82 0.776 − 0.014 0.001 < 0.001 < 0.001 GP24 1.198 0.554 − 0.009 0.001 < 0.001 < 0.001 GP25 0.294 0.106 0.017 0.002 < 0.001 < 0.001 GP26 1.341 0.447 − 0.003 0.001 0.05 0.465 GP27 0.815 0.489 0.009 0.001 < 0.001 < 0.001 GP28 0.487 0.251 − 0.011 0.001 < 0.001 < 0.001 GP29 0.181 0.107 0.017 0.002 < 0.001 < 0.001 GP30 4.068 1.734 − 0.003 0.001 0.008 0.096 GP31 0.374 0.163 0 0.001 0.774 1 GP32 1.542 0.515 0.004 0.001 0.002 0.031 GP33 2.791 1.587 0.007 0.001 < 0.001 < 0.001 GP34 0.31 0.129 0.004 0.002 0.006 0.07 GP35 0.32 0.207 0.006 0.001 < 0.001 < 0.001 GP36 0.368 0.181 0.013 0.002 < 0.001 < 0.001 GP37 0.308 0.19 0.01 0.002 < 0.001 < 0.001 GP38 0.748 0.424 0.018 0.002 < 0.001 < 0.001 GP39 0.722 0.579 0.02 0.001 < 0.001 < 0.001
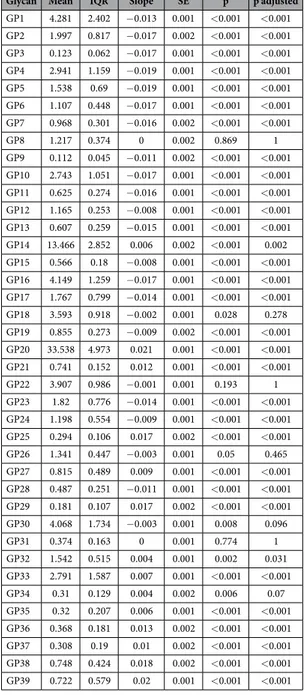
Table 2. Mean and interquartile range (IQR) measures of glycan levels at intraoperative time point for the discovery cohort together with slope estimates and inference measures (SE-standard error, p value and adjusted p-value) for linear mixed effects models between intraoperative time point and 48 hours after surgery.
in protein glycosylation. However, the situation is more complex with the most abundant structure in human plasma N-glycome, namely the A2G2S2; this structure can be found on the APPs decreasing during inflammation such as transferrin and α 2-HS glycoprotein44–47, as well as on α 1-acid glycoprotein, α 1-antitrypsin, hemopexin,
vitronectin, ceruloplasmin, haptoglobin, α 2-macroglobulin and fibrinogen which increased37–44,48–52. Also, it is
already known that glycosylation of some APPs changes during inflammation. For example, α 1-acid glycoprotein
antennary fucosylation increases during inflammation thus making the sialyl-Lewis X structure37,53–56, which
increase was also noticed in our studies. Moreover, the same changes have been noticed on α 1-antichymotrypsin
and haptoglobin31. Since existing biomarkers of inflammation are discrete molecular species (APPs and
inflam-matory cytokines), we believe that total plasma N-glycan analysis shows an overall picture of changes (overall plasma protein glycosylation and concentrations of glycosylated APPs) during inflammation and it has potential to be an ameliorated indicator of inflammation stage and direction after a major surgery, as well as a therapy response marker for an inflammatory treatment.
Despite limitations, our paper is the first (to our knowledge) addressing a topic of great clinical interest. The ability of rating pain and reduce opiates’ consumption have been the cornerstones in improving surgical outcome; as well, biomarkers for pain severity and morphine requirements may lead to personalized targeted approaches to improve patient’s outcome. Thus, our results may pave the way for further studies, since they are the first documented association between a specific biologic marker (i.e. glycome) and a key clinical outcome deeply influencing patients’ recovery.
Methods
Plasma/serum samples.
Discovery cohort. We conducted the study at the Fondazione IRCCS PoliclinicoSan Matteo – Pavia, Italy and at the San Gerardo Hospital - Monza, Italy, after Institutional Review Board-approval from both institutions (06/28/2010, DS2943/2010; 11/11/2010, 611) and registration on ClinicalTrial.gov in November 2010 (NCT01233752). All study subjects provided informed consent. The methods were carried out in accordance with the declaration of Helsinki.
The study has been already described in detail57. Plasma was separated by centrifugation for 5 minutes at 4500 rcf,
at room temperature. We sent an aliquot of plasma samples of patients enrolled both in Pavia and Monza to Genos.
Figure 3. A quasi-Poisson distribution of morphine consumption.
Male Female
N 19 9
Age (years) 72 (48–79) 66 (44–85)
Surgery duration (minutes) 130 (94–275) 140 (100–220) Type of surgery (%)
1. lower abdominal 64.3 32,2
2. xipho-pubic 3.6 0
Figure 4. Changes in levels (abundance) of plasma glycans between day 0 and day 2 for the replication cohort. Changes are presented through the logarithm of relative changes log10 (day2/day0) in the left plot and
the geometric mean (as a measure of trends) of relative changes (day2/day0) in the right plot. The red color indicates decrease in glycan level and blue color indicates increase in glycan level; intensity of colors indicates the intensity of the changes. All changes are presented with respect to levels before the surgery.
Participants. We enrolled Caucasian patients from January 2011 to July 2013: inclusion criteria were: 18–75
years old, major abdominal surgery (with morphine PCA planned for postoperative analgesia), HIV negative, ASA class I–III. Exclusion criteria were: cognitive or mental impairment, kidney or hepatic failure, preoperative pain, known intolerance to study drugs, postoperative sedation and/or mechanical ventilation in the intensive care. Re-interventions were also excluded from evaluations.
A morphine bolus (0.15 mg/kg ± 20%) was administered 45 min before the end of the surgery, followed by intravenous morphine PCA (1 mg bolus, 5 minutes lock-out, and 20 mg maximal dose every 4 hour) for at least 48 hours. Acetominophen 1 g or ketorolac 30 mg were added at regular intervals.
Samples were collected from each patient through arterial line used as part of intraoperative monitoring; sam-ples were collected at five time points: intraoperative and 6, 12, 24, 48 hours after surgery.
In order to evaluate correlation between morphine consumption and glycomics we analyzed the cumulative distribution of morphine consumption at 24 h. Thus, we calculated the square root of value stratifying patients into three categories: Low (consumption <1 standard deviation of the mean), High (> 1 standard deviation of the mean) and Medium (all values in between). Hence, we evaluated differences between baseline and 6-hours glycoproteins level among three groups.
Glycan Mean IQR Slope SE p p adjusted
GP1 5.568 2.485 − 0.01 0.001 < 0.001 < 0.001 GP2 2.438 0.791 − 0.017 0.001 < 0.001 < 0.001 GP3 0.088 0.03 − 0.002 0.003 0.414 1 GP4 3.824 1.115 − 0.014 0.001 < 0.001 < 0.001 GP5 1.946 0.981 − 0.01 0.001 < 0.001 < 0.001 GP6 1.436 0.24 − 0.018 0.001 < 0.001 < 0.001 GP7 1.114 0.195 − 0.023 0.002 < 0.001 < 0.001 GP8 0.813 0.21 − 0.008 0.002 < 0.001 < 0.001 GP9 0.085 0.025 − 0.009 0.003 0.001 0.007 GP10 3.097 1.18 − 0.012 0.001 < 0.001 < 0.001 GP11 0.792 0.22 − 0.013 0.002 < 0.001 < 0.001 GP12.13 1.766 0.3 − 0.021 0.002 < 0.001 < 0.001 GP14 9.314 1.299 − 0.003 0.002 0.122 0.559 GP15 0.432 0.1 − 0.006 0.003 0.064 0.301 GP16 4.702 1.355 − 0.015 0.001 < 0.001 < 0.001 GP17 2.127 0.23 − 0.012 0.001 < 0.001 < 0.001 GP18 3.255 0.811 − 0.006 0.001 < 0.001 < 0.001 GP19 0.91 0.205 − 0.026 0.002 < 0.001 < 0.001 GP20 28.643 4.85 0.027 0.002 < 0.001 < 0.001 GP21 0.631 0.11 − 0.002 0.003 0.581 1 GP22 4.386 0.886 0 0.001 0.864 1 GP23 2.652 0.72 − 0.013 0.001 < 0.001 < 0.001 GP24.25 1.66 0.555 − 0.01 0.001 < 0.001 < 0.001 GP26 1.488 0.365 − 0.01 0.001 < 0.001 < 0.001 GP27 0.874 0.375 0.007 0.001 < 0.001 < 0.001 GP28 0.657 0.28 − 0.013 0.001 < 0.001 < 0.001 GP29 0.168 0.065 0.016 0.002 < 0.001 < 0.001 GP30 5.155 1.779 − 0.004 0.001 < 0.001 < 0.001 GP31 0.455 0.125 − 0.004 0.001 0.001 0.006 GP32 1.854 0.695 0.009 0.001 < 0.001 < 0.001 GP33 3.916 1.88 0.009 0.001 < 0.001 < 0.001 GP34 0.387 0.085 0.006 0.002 0.001 0.007 GP35 0.446 0.22 0.006 0.001 < 0.001 < 0.001 GP36 0.481 0.13 0.019 0.002 < 0.001 < 0.001 GP37 0.421 0.175 0.015 0.002 < 0.001 < 0.001 GP38 0.974 0.25 0.026 0.002 < 0.001 < 0.001 GP39 1.044 0.41 0.023 0.001 < 0.001 < 0.001
Table 4. Mean and IQR measures of glycan levels at intraoperative time point for the replication cohort together with slope estimates and inference measures (SE-standard error, p value and adjusted p-value) for linear mixed effects models between intraoperative time point and 48 hours after surgery.
Replication cohort. Effects of surgery on the serum N-glycome were evaluated in 28 patients sampled before
surgery, 24 h, 48 h and 7 days after surgery, and treated with intravenous morphine PCA. Samples were collected at the Clinical Department for Laboratory Diagnostics at University Hospital Dubrava (Zagreb, Croatia). The study was registered at ClinicalTrials.gov, number NCT01244022 and was approved by the Ethics Committee of University Hospital Dubrava. The methods were carried out in accordance with the declaration of Helsinki. Sera samples were obtained following centrifugation at 1370 × g for 10 minutes in a Rotina 35 R Hettich centrifuge (Tuttlingen, Germany), and then stored at − 80 °C until analysis.
Participants. The extent of the disease was determined using a standardized protocol. Only patients without
evident distant metastases were considered for this study. During the operation, an examination of intraab-dominal organs was carried out in search for distant metastases. All resected specimens were subjected to patho-histological examination and in all cases complete local cancer resection (R0 resection) was confirmed.
Glycan release and labeling.
The whole procedure was performed as previously reported58. Briefly, theplasma/serum samples were denaturated with the addition of SDS (Invitrogen, USA) and by incubation at 65 °C. Figure 5. Graphical comparison of changes in glycan levels between the discovery cohort, the replication cohort and previously published data20 (SREP) as an additional replication of the results. The comparison is
given through boxplots where the bottom and top of the box are the first and third quartiles, and the band inside the box is the second quartile (the median). Ends of the whiskers represent the lowest datum still within 1.5 IQR (interquartile range) of the lower quartile, and the highest datum still within 1.5 IQR of the upper quartile. Data beyond the end of the whiskers are outliers and plotted as points. Only a subset of directly comparable glycans is shown due to differences in measurement technique for the replication and discovery cohorts (Ultra-performance liquid chromatograph) and previously published data (High (Ultra-performance liquid chromatography). Statistical inference was not performed between cohorts.
The excess of SDS was neutralized with Igepal-CA630 (Sigma-Aldrich, USA) and N-glycans were released fol-lowing the addition of PNGase F (Promega, USA) in Phosphate Buffer Saline (PBS). The released N-glycans were labeled with 2-AB. Free label and reducing agent were removed from the samples using hydrophilic interaction liquid chromatography solid-phase extraction (HILIC-SPE). Glycans were eluted with ultrapure water and stored at −20 °C until use.
Ultra-performance liquid chromatography.
Fluorescently labeled N-glycans were separated by HILIC on an Acquity UPLC instrument (Waters, USA) consisting of a quaternary solvent manager, sample manager, and an FLR fluorescence detector set with excitation and emission wavelengths of 250 and 428 nm, respectively. The instrument was under the control of Empower 3 software, build 3471 (Waters). Labeled N-glycans were sep-arated on a Waters BEH Glycan chromatography column, 150 × 2.1 mm i.d., 1.7 μ m BEH particles, with 100 mM ammonium formate, pH 4.4, as solvent A and ACN as solvent B. The separation method used a linear gradient of 30–47% solvent A at flow rate of 0.56 ml/min in a 23 min analytical run. Samples were maintained at 10 °C before injection, and the separation temperature was 25 °C. Data processing was performed using an automatic process-ing method with a traditional integration algorithm, after which each chromatogram was manually corrected to maintain the same intervals of integration for all the samples. The chromatograms were all separated in the same manner into 39 peaks as previously reported58 for the discovery cohort and for the replication cohort into 37peaks. For two groups of two chromatographic peaks in the replication cohort we were not able to differentiate between peaks and they were integrated as one measurement (GP12 and GP13 as GP12.13 and GP24 and GP25 as GP24.25). The amount of glycans in each peak was expressed as % of total integrated area.
Data analysis.
Data analysis was conducted with R (version 3.2.2), a free software environment for statistical computing and graphics. Linear mixed effects models (packages lme459 and lmerTest) were used to assess thechanges between timepoints (before and after surgery). Reported p-values were adjusted to multiple testing using Benjamini-Hochberg procedure for FDR60.
References
1. Gornik, O., Pavic, T. & Lauc, G. Alternative glycosylation modulates function of IgG and other proteins - implications on evolution and disease. Biochim. Biophys. Acta 1820, 1318–1326 (2012).
2. Lauc, G., Vojta, A. & Zoldoš, V. Epigenetic regulation of glycosylation is the quantum mechanics of biology. Biochim. Biophys.
Acta–Gen. Subj. 1840, 65–70 (2014).
3. Lauc, G., Krištić, J. & Zoldoš, V. Glycans–the third revolution in evolution. Front. Genet. 5, 1–7 (2014).
4. Parekh, R. B. et al. Association of rheumatoid arthritis and primary osteoarthritis with changes in the glycosylation pattern of total serum IgG. Nature 316, 452–457 (1985).
5. National Research Council. Transforming Glycoscience: A Roadmap for the Future. Books (2012).
6. Wolfert, M. A. & Boons, G.-J. Adaptive immune activation: glycosylation does matter. Nat Chem Biol 9, 776–784 (2013).
7. Arnold, J. N., Saldova, R., Abd Hamid, U. M. & Rudd, P. M. Evaluation of the serum N-linked glycome for the diagnosis of cancer and chronic inflammation. Proteomics 8, 3284–3293 (2008).
8. Reis, C. a, Osorio, H., Silva, L., Gomes, C. & David, L. Alterations in glycosylation as biomarkers for cancer detection. J. Clin. Pathol.
63, 322–329 (2010).
9. Raja, S. G. & Dreyfus, G. D. Modulation of systemic inflammatory response after cardiac surgery. Asian Cardiovasc. Thorac. Ann. 13, 382–395 (2005).
10. Rittner, H. L., Brack, A. & Stein, C. Pain and the immune system. British Journal of Anaesthesia 101, 40–44 (2008).
11. Bugada, D. et al. Effect of Preoperative Inflammatory Status and Comorbidities on Pain Resolution and Persistent Postsurgical Pain after Inguinal Hernia Repair. Mediators of Inflammation 2016, 1–7 (2016).
12. Wu, C. L. & Raja, S. N. Treatment of acute postoperative pain. Lancet 377, 2215–2225 (2011).
13. De Gregori, M. et al. Genetic variability at COMT but not at OPRM1 and UGT2B7 loci modulates morphine analgesic response in acute postoperative pain. Eur. J. Clin. Pharmacol. 69, 1651–1658 (2013)
14. Ren, Z. Y. et al. The impact of genetic variation on sensitivity to opioid analgesics in patients with postoperative pain: a systematic review and meta-analysis. Pain Physician 18, 131–152 (2015).
15. Hwang, I. C. et al. OPRM1 A118G Gene Variant and Postoperative Opioid Requirement: A Systematic Review and Meta-analysis.
Anesthesiology 121, 825–834 (2014).
16. Knezevic, A. et al. Variability, Heritability and Environmental Determinants of Human Plasma N-Glycome Variability. J. Proteome
Res. 8, 694–701 (2009).
17. Pucic, M. et al. High throughput isolation and glycosylation analysis of IgG-variability and heritability of the IgG glycome in three isolated human populations. Mol Cell Proteomics 10, M111, 010090 (2011).
18. Vučković, F. et al. Systemic lupus erythematosus associates with the decreased immunosuppressive potential of the IgG glycome.
Arthritis Rheumatol. (Hoboken, N.J.) 67, 2978–2989 (2015).
19. Thanabalasingham, G. et al. Mutations in HNF1A result in marked alterations of plasma glycan profile. Diabetes 62, 1329–1337 (2013).
20. Novokmet, M. et al. Changes in IgG and total plasma protein glycomes in acute systemic inflammation. Sci. Rep. 4, 1–10 (2014). 21. Trbojević Akmačić, I. et al. Inflammatory Bowel Disease Associates with Proinflammatory Potential of the Immunoglobulin G
Glycome. Inflamm. Bowel Dis. 21, 1 (2015).
22. Vanhooren, V. et al. N-glycomic changes in serum proteins during human aging. Rejuvenation Res. 10, 521–531a (2007). 23. Kalff, J. C. et al. Biphasic response to gut manipulation and temporal correlation of cellular infiltrates and muscle dysfunction in rat.
Surgery 126, 498–509 (1999).
24. Cruickshank, A., Fraser, W., Burns, H., Van Damme, J. & Shenkin, A. Response of serum interleukin-6 in patients undergoing elective surgery of varying severity. Clin Sci 79, 161–165 (1990).
25. Gonzalez-Quintela, A. et al. Serum levels of immunoglobulins (IgG, IgA, IgM) in a general adult population and their relationship with alcohol consumption, smoking and common metabolic abnormalities. Clin. Exp. Immunol. 151, 42–50 (2007).
26. Shenkin, A. et al. The serum interleukin 6 response to elective surgery. Lymphokine Res. 8, 123–127 (1989).
27. Castell, J. V. et al. Interleukin-6 is the major regulator of acute phase protein synthesis in adult human hepatocytes. FEBS Lett. 242, 237–239 (1989).
28. Ohzato, H. et al. Interleukin-6 as a new indicator of inflammatory status: detection of serum levels of interleukin-6 and C-reactive protein after surgery. Surgery 111, 201–209 (1992).
29. Lauc, G. et al. Loci Associated with N-Glycosylation of Human Immunoglobulin G Show Pleiotropy with Autoimmune Diseases and Haematological Cancers. PLoS Genet. 9, e1003225 (2013).
30. Gornik, O. et al. Stability of N-glycan profiles in human plasma. Glycobiology 19, 1547–1553 (2009).
31. EC, B. der L., de Haan, P. F., Havenaar, E. C. & Van, D. W. Inflammation-induced expression of sialyl LewisX is not restricted to alpha1-acid glycoprotein but also occurs to a lesser extent on alpha1-antichymotrypsin and haptoglobin. Glycoconj. J. 15, 177–182 (1998).
32. Sperandio, M. Selectins and glycosyltransferases in leukocyte rolling in vivo. FEBS J. 273, 4377–4389 (2006).
33. Lowe, J. B. Glycosylation in the control of selectin counter-receptor structure and function. Immunol. Rev. 186, 19–36 (2002). 34. Mitoma, J. et al. Critical functions of N-glycans in L-selectin-mediated lymphocyte homing and recruitment. Nat. Immunol. 8,
409–418 (2007).
35. Miwa, H. E., Song, Y., Alvarez, R., Cummings, R. D. & Stanley, P. The bisecting GlcNAc in cell growth control and tumor progression.
Glycoconj. J. 29, 609–618 (2012).
36. Tirumalai, R. S. Characterization of the Low Molecular Weight Human Serum Proteome. Mol. Cell. Proteomics 2, 1096–1103 (2003). 37. Dage, J. L., Ackermann, B. L. & Halsall, H. B. Site localization of sialyl Lewis(x) antigen on alpha1-acid glycoprotein by high
performance liquid chromatography-electrospray mass spectrometry. Glycobiology 8, 755–760 (1998).
38. Imre, T. et al. Mass spectrometric and linear discriminant analysis of N-glycans of human serum alpha-1-acid glycoprotein in cancer patients and healthy individuals. J. Proteomics 71, 186–197 (2008).
39. Kolarich, D., Weber, A., Turecek, P. L., Schwarz, H. P. & Altmann, F. Comprehensive glyco-proteomic analysis of human alpha-1- antitrypsin and its charge isoforms. Proteomics 6, 3369–3380 (2006).
40. Mills, K. et al. Identification of alpha-1-antitrypsin variants in plasma with the use of proteomic technology. Clin. Chem. 47, 2012–2022 (2001).
41. Nilsson, J. et al. Enrichment of glycopeptides for glycan structure and attachment site identification. Nat. Methods 6, 809–811 (2009).
42. Hwang, H. et al. In-depth analysis of site-specific N-glycosylation in vitro nectin from human plasma by tandem mass spectrometry with immunoprecipitation. Anal. Bioanal. Chem. 406, 7999–8011 (2014).
43. Harazono, A. et al. Site-specific N-glycosylation analysis of human plasma ceruloplasmin using liquid chromatography with electrospray ionization tandem mass spectrometry. Anal. Biochem. 348, 259–268 (2006).
44. Clerc, F. et al. Human plasma protein N-glycosylation. Glycoconj. J., doi: 10.1007/s10719-015-9626-2 (2015).
45. Satomi, Y., Shimonishi, Y. & Takao, T. N-glycosylation at Asn(491) in the Asn-Xaa-Cys motif of human transferrin. FEBS Lett. 576, 51–56 (2004).
46. Satomi, Y., Shimonishi, Y., Hase, T. & Takao, T. Site-specific carbohydrate profiling of human transferrin by nano-flow liquid chromatography/electrospray ionization mass spectrometry. Rapid Commun. Mass Spectrom. 18, 2983–2988 (2004).
47. Wilson, N. L., Schulz, B. L., Karlsson, N. G. & Packer, N. H. Sequential analysis of N- and O-linked glycosylation of 2D-PAGE separated glycoproteins. J. Proteome Res. 1, 521–529 (2002).
48. Arnold, J. N. et al. Interaction of mannan binding lectin with alpha2 macroglobulin via exposed oligomannose glycans: a conserved feature of the thiol ester protein family? J. Biol. Chem. 281, 6955–6963 (2006).
49. Reiding, K. R., Blank, D., Kuijper, D. M., Deelder, A. M. & Wuhrer, M. High-throughput profiling of protein N-glycosylation by MALDI-TOF-MS employing linkage-specific sialic acid esterification. Anal. Chem. 86, 5784–5793 (2014).
50. Adamczyk, B., Struwe, W. B., Ercan, A., Nigrovic, P. a. & Rudd, P. M. Characterization of fibrinogen glycosylation and its importance for serum/plasma N-glycome analysis. J. Proteome Res. 12, 444–454 (2013).
51. Zhang, S., Jiang, K., Sun, C., Lu, H. & Liu, Y. Quantitative analysis of site-specific N-glycans on sera haptoglobin β chain in liver diseases. Acta Biochim. Biophys. Sin. (Shanghai) 45, 1021–1029 (2013).
52. Pompach, P. et al. Site-specific glycoforms of haptoglobin in liver cirrhosis and hepatocellular carcinoma. Mol. Cell. Proteomics 12, 1281–1293 (2013).
53. van Dijk, W., Havenaar, E. C. & Brinkman-van der Linden, E. C. Alpha 1-acid glycoprotein (orosomucoid): pathophysiological changes in glycosylation in relation to its function. Glycoconj. J. 12, 227–233 (1995).
54. Brinkman-van der Linden, E. C., van Ommen, E. C. & van Dijk, W. Glycosylation of alpha 1-acid glycoprotein in septic shock: changes in degree of branching and in expression of sialyl Lewis(x) groups. Glycoconj. J. 13, 27–31 (1996).
55. Havenaar, E. C. et al. Severe rheumatoid arthritis prohibits the pregnancy-induced decrease in alpha3-fucosylation of alpha1-acid glycoprotein. Glycoconj J 15, 723–729 (1998).
56. JM, W., Fournet, B., Konan, D., Biou, D. & Durand, G. 400-MHz 1H-NMR spectroscopy of fucosylated tetrasialyl oligosaccharides isolated from normal and cirrhotic alpha 1-acid glycoprotein. FEBS Lett. 238, 390–394 (1988).
57. De Gregori, M. et al. Human Genetic Variability Contributes to Postoperative Morphine Consumption. J. Pain 17, 628–636 (2016). 58. Trbojević Akmačić, I. et al. High Throughput Glycomics: Optimization of Sample Preparation. Biochem. 80, 934–942 (2015). 59. Bates, D., Mächler, M., Bolker, B. & Walker, S. Fitting Linear Mixed-Effects Models Using lme4. J. Stat. Softw. 67 (2015).
60. Benjamini, Y. & Hochberg, Y. Controlling the False Discovery Rate: A Practical and Powerful Approach to Multiple Testing. Journal
of the Royal Statistical Society. Series B (Methodological) 57, 289–300 (1995).
Acknowledgements
The study was supported from European Commission, Grant agreements no: 602736, 305479, 305280, 315997 and from Italian Ministry of Health, Grant GR-2010-2318370.
Author Contributions
M.D.G., M.A. and G.L. conceived the study and revised the paper; I.G., I.U. and O.G. conducted the glycomic experiments; M.P.-B., M.N. and L.Đ. helped the interpretation of glycomic analyses and helped the paper writing together with G.S.J., T.M. and S.D.G. that also prepared the serum samples of the Italian cohort; I.G., I.U., V.N. and M.B. performed the statistical analyses of the results; D.B. and P.M.I. managed the patient enrolment; all authors reviewed the manuscript.
Additional Information
Supplementary information accompanies this paper at http://www.nature.com/srep Competing financial interests: The authors declare no competing financial interests.
How to cite this article: Gudelj, I. et al. Changes in total plasma and serum N-glycome composition and patient-controlled analgesia after major abdominal surgery. Sci. Rep. 6, 31234; doi: 10.1038/srep31234 (2016).
This work is licensed under a Creative Commons Attribution 4.0 International License. The images or other third party material in this article are included in the article’s Creative Commons license, unless indicated otherwise in the credit line; if the material is not included under the Creative Commons license, users will need to obtain permission from the license holder to reproduce the material. To view a copy of this license, visit http://creativecommons.org/licenses/by/4.0/