ARTICLE
Knockdown of
MLO genes reduces susceptibility to powdery
mildew in grapevine
Stefano Pessina1,2, Luisa Lenzi1,3, Michele Perazzolli1, Manuela Campa1, Lorenza Dalla Costa1, Simona Urso4,5, Giampiero Valè4,5, Francesco Salamini1, Riccardo Velasco1and Mickael Malnoy1
Erysiphe necator is the causal agent of powdery mildew (PM), one of the most destructive diseases of grapevine. PM is controlled by sulfur-based and synthetic fungicides, which every year are dispersed into the environment. This is why PM-resistant varieties should become a priority for sustainable grapevine and wine production. PM resistance can be achieved in other crops by knocking out susceptibility S-genes, such as those residing at genetic loci known as MLO (Mildew Locus O). All MLO S-genes of dicots belong to the phylogenetic clade V, including grapevine genes VvMLO7, 11 and 13, which are upregulated during PM infection, and VvMLO6, which is not upregulated. Before adopting a gene-editing approach to knockout candidate S-genes, the evidence that loss of function of MLO genes can reduce PM susceptibility is necessary. This paper reports the knockdown through RNA interference of VvMLO6, 7, 11 and 13. The knockdown of VvMLO6, 11 and 13 did not decrease PM severity, whereas the knockdown of VvMLO7 in combination with VvMLO6 and VvMLO11 reduced PM severity up to 77%. The knockdown of VvMLO7 and VvMLO6 seemed to be important for PM resistance, whereas a role for VvMLO11 does not seem likely. Cell wall appositions (papillae) were present in both resistant and susceptible lines in response to PM attack. Thirteen genes involved in defense were less upregulated in infected mlo plants, highlighting the early mlo-dependent disruption of PM invasion.
Horticulture Research (2016)3, 16016; doi:10.1038/hortres.2016.16; Published online 20 April 2016
INTRODUCTION
Vineyards are treated with an impressive amount of chemical compounds, particularly fungicides, to prevent yield losses due to fungal pathogens. In France, Italy, Spain and Germany, between 1992 and 2003, 73% of the fungicides were used for grapevine protection, a crop that covers only 8% of the agricultural land in those countries.1
Worldwide, grapevine powdery mildew (PM), caused by the fungus Erysiphe necator, is a destructive disease.2E. necator Schw.
(syn. Uncinula necator (Schw.) Burr.) is an obligate biotroph infecting all green tissues of grapevine and results in significant losses in yield and berry quality. Symptoms are a white or gray powder covering both leaf surfaces, and, after infection, the fruits show shriveling or cracking.3 The quality of the fruit is severely damaged, due to increased acidity and decreased anthocyanin and sugar content.4
PM can be controlled by frequent applications of fungicides, particularly those based on sulfur. However, due to the ecological drawbacks of fungicides,5the relative high costs (up to 20% of total grapevine production expenses6) and the rapid appearance of resistant strains of the pathogen7–9because of its adaptative gene copy-number variation,10 new alternatives to chemical treatments should be adopted. Resistant varieties are one of the best options. The use of PM-resistant cultivars could reduce production costs in California by 720 $ ha− 1, with a significant reduction of fungicide usage.6
Vitis vinifera is susceptible to PM,11 whereas North American Vitis species, due to their co-evolution with E. necator, have variable degrees of resistance to the pathogen.12Their resistances have been transferred to V. vinifera but the acceptance of resistant hybrids by producers and consumers has been very limited because of the attachment to traditions and lower quality of resulting wine, although resistant cultivar suitable for wine production are becoming available.6One strategy to create crops resistant to diseases is based on the exploitation of R-genes that encode proteins that recognize pathogen effectors and trigger defense response,13 such as the Vitis REN and RUN genes.14 Resistance manifests as localized hypersensitive responses at the sites of attempted infection.15 However, R-genes are frequently overcome by mutations of the pathogen.16 An alternative approach is based on susceptibility genes (S-genes), which loss of function results in recessively inherited resistance.17 Knockout of S-genes may, however, induce pleiotropic phenotypes in the plant.18,19
A typical class of S-genes is represented by the MLO (Mildew Locus O) genetic factors that, when inactivated, results in recessive mlo resistance, as discovered in barley.20 MLO genes are
largely conserved across the plant kingdom and their loss of function resulted in PM resistance in Arabidopsis thaliana,21pea,18 tomato,22wheat23and pepper.24Of the seven phylogenetic clades in which the MLO family is divided,25,26only two include S-genes: clade IV with all monocot S-genes27,28and clade V with all dicot
1
Research and Innovation Centre, Fondazione Edmund Mach, via Edmund Mach 1, 38010 San Michele all’Adige, Italy;2
Wageningen UR Plant Breeding, Wageningen University and Research Centre, PO Box 386, 6700 AJ Wageningen, The Netherlands;3
Department of Ecological and Biological Sciences, Università della Tuscia, Via San Camillo de Lellis, Viterbo 01100, Italy;4
Council for Agricultural Research and Economics (CREA), Rice Research Unit, S.S. 11 per Torino km 25, Vercelli 13100, Italy and5
Council for Agricultural Research and Economics (CREA), Genomics Research Centre, Via San Protaso, 302, 29017, Fiorenzuola d’Arda, Piacenza, Italy.
Correspondence: M Malnoy ([email protected])
S-genes.21,22,29,30Not all members of clades IV and V are S-genes,
but candidates can be identified during early stages of PM infection because of their increased expression, as documented in tomato,22 barley,31 pepper,24 grapevine29,30 and apple.26 In grapevine, of four clade V MLO genes, three (VvMLO7, VvMLO11 and VvMLO13) are upregulated early after PM infection, whereas VvMLO6, the fourth, is not transcriptionally responsive to the pathogen.29,30
MLOs are membrane proteins with seven transmembrane domains32 involved also in a variety of physiological processes in different tissues, such as root morphogenesis33and pollen tube reception by embryo sac.34The proposed function of MLO S-genes
is the negative regulation of vesicle-associated and actin-dependent defense pathways at the site of PM penetration.27 The secretory vesicle traffic controls pathogen penetration, allowing the formation of cell wall appositions called papillae,2,33 which are associated with mlo resistance.21,36
The development of DNA-editing tools is rapidly changing plant genetics and biotechnology, due to the possibility of inducing mutations in specific genes.37–39Before adopting a gene-editing
approach to knockout candidate S-genes, the evidence that loss of function of MLO genes can reduce PM susceptibility is necessary. This paper reports the knockdown through RNA interference of VvMLO6, 7, 11 and 13 and its effect on PM infection in grapevine. MATERIALS AND METHODS
Constructs
Three hundred- to 600-bp fragments of genes VvMLO6, VvMLO7, VvMLO11 and VvMLO13 were amplified (Supplementary Table S1) and cloned in pENTR/SD-TOPO (Invitrogen). After checking the sequences, the fragments were inserted in the RNAi Gateway vector pK7GWIWG2D(II)40(http://www. psb.ugent.be/), as in Urso et al.41After sequencing both the strands, the
constructs were inserted in Agrobacterium tumefaciens strain GV3101, as in Zottini et al.42A. tumefaciens-transformed cells were tested by PCR for the presence of constructs, using primers annealing to the 35S promoter (5′-CGCACAATCCCACTATCCTT-3′) and the MLO fragment (Supplementary Table S1).
Plant material, gene transfer and screening of regenerants
Plant material of the grapevine cultivar long-cluster Brachetto was cultivated in vitro as described by Dalla Costa et al.43This cultivar was
chosen because it is easy to transform,44,45has high somatic
embryogen-esis efficiency and good efficiency of regeneration from the callus.46 Somatic embryos were used for gene transfer. Gene transfer, regeneration and selection of transgenic plants were performed as in Dalla Costa et al.43
Five different gene transfers were carried out: four aimed to silence the four MLO target genes and thefifth was a control consisting of the empty vector (pK2WG7). DNA was extracted from in vitro leaf tissue (Phytopure kit, GE Healthcare, Little Chalfont, Buckinghamshire, UK). Integration was proven using the primers described above. Transformed in vitro grown lines were moved to a woody plant medium47in growth chamber at 20–
24 °C and transferred in fresh medium once a month.
Greenhouse acclimation
Plants werefirst acclimated to greenhouse conditions in a growth chamber at 25 °C, 16-h day/8-h night, relative humidity (RH) 70 ± 5%. One-month-old plants with at least two main roots 3-cm long were transferred in a 250-ml plastic cup containing wet autoclaved turf (Tercomposti Spa, Brescia, Italy) and sealed with parafilm, to preserve humidity. Every 7 days, holes were made in the parafilm cover to progressively reduce air humidity and promote the formation of the foliar cuticle. After 3 weeks, parafilm was completely removed and, after 1 more week, the plants were transplanted in 1 l pots kept in the greenhouse at 25 °C, 16-h day/8-h night, humidity 70 ± 5%.
E. necator and P. viticola inoculation and disease severity assessment
The E. necator and P. viticola inocula were obtained from infected leaves of an untreated vineyard in northern Italy (Trentino region). Subsequent
reproduction of the inoculum was carried out infecting the V. vinifera cultivar Pinot Noir, under greenhouse conditions. For E. necator inocula-tion, plants were dry inoculated onto target leaves gently brushing adaxial leaf surfaces with infected young leaves carrying fresh PM sporulation.48
Inoculated plants were incubated in a greenhouse at 25 ± 1 °C with 100% RH for 6 h to promote fungal penetration, and then kept at 25 ± 1 °C and 70 ± 10% RH until the end of symptom evaluation. Disease severity was assessed on all leaves at 14, 22 and 30 days post inoculation (d.p.i.).
For P. viticola inoculation, fresh sporangia were collected by washing the abaxial surfaces, carrying freshly downy mildew (DM) sporulating lesions, with distilled water at 4 °C. Abaxial leaf surfaces were sprayed with the inoculum suspension of P. viticola (2 × 10⁵sporangia per ml). Inoculated
plants were incubated overnight in the dark at 25 °C with 99–100% RH, and then maintained under controlled greenhouse conditions at 25 ± 1 °C and 70 ± 10% RH. Six days after inoculation, plants were incubated overnight in darkness at 25 °C with 99–100% RH to allow DM sporulation and assess the disease severity.
Severity of PM and DM was assessed visually on all leaves of each plant, according to the standard guidelines of the European and Mediterranean Plant Protection Organization.49,50 For each leaf, disease severity was
expressed as the proportion (percentage of 0–100%, with intervals of 5%) of the leaf area covered by white sporulation of PM or DM in relation to the total leaf area, and a mean value was calculated for each plant. Disease reduction was calculated as (disease severity in control plants− disease severity in transformed plants)/(disease severity in control plants) and expressed as a percentage. For PM severity, the area under disease progress curve was considered as a quantitative summary of disease intensity over time to analyze all time points together51,52 using the
following formula: area under disease progress curve =∑[(Xi+Xi+1)/2] × (ti+1–ti),
where Xi corresponds to the disease severity (%) at assessment i, Xi+1
corresponds to the disease severity (%) at subsequent assessment i+1 and (ti+1− ti) corresponds to the number of days between the two consecutive
assessments. PM severity was also assessed as the number of E. necator conidia produced from infected leaves as in Angeli et al.53Three leaves
were collected from each replicate at 30 d.p.i. and four disks of 0.8 cm diameter for each leaf were cut, for a total of 12 disks per replicate. Leaf disks were transferred to 50-ml tubes containing 5 ml distilled water with 0.01% Tween-80 (Sigma-Aldrich, St. Louis, MO, USA). Tubes were vortexed for 1 min and the concentration of conidia per ml was determined by a hemocytometer count. The values obtained were converted in conidia per cm2of grapevine leaf. Two inoculation experiments were carried out and
in each experiment three to nine biological replicates (plants) per line were analyzed in a randomized complete block design.
Histological analysis
Two inoculated leaves were collected from three replicates of each transgenic and control line at 3, 10 and 21 d.p.i. for hyphae visualization and histological analyses. Leaves were treated as described by Vanacker et al.54 with the following modi
fications: small pieces of leaf with the adaxial surface up were laid onfilter paper moistened with ethanol:glacial acetic acid (3:1, v/v) until the chlorophyll was removed. Leaf segments were transferred to water soaked filter paper for 2 h, incubated in lactoglycerol [lactic acid:glycerol:water 1:1:1 (v/v/v)] for 12 h and stored in lactoglycerol at room temperature. For microscopic analysis, leaf segments were mounted on microscope slides and a drop of aniline blue (0.1% (w/v) in lactoglycerol) was pipetted on their surface. Aniline blue staining does not fluoresce when in lactoglycerol and E. necator structures (hyphae, conidia and appressoria) were visualized using the bright-field illumination of a Leica LMD7000 microscope (Leica Microsystems, Wetzlar, Germany). After spore localization,fluorescence was used with a LMD filter (BP filter 380–420-nm excitation, 415 dichroic mirror, and BP 445–485-nm emission) to visualize the bright blue–green auto-fluorescence associated with infected cells and papillae (autofluorogenic phenolic compounds) formation.54
RNA extraction and gene expression analysis
Thefirst gene expression analysis of transgenic plants was carried out on in vitro grown lines to identify genotypes with reduced expression of target genes. Three biological replicates were collected from each line. The second analysis was carried out on acclimated transgenic plants, with leaf samples collected before inoculation, 24 h and 10 days post PM inoculation, the time of the last two samplings corresponding to the upregulation of MLO genes after infection.29,30Five biological replicates
were collected from each line. For each line at each time point, the third andfifth half leaves from the top were collected, frozen in liquid nitrogen and stored at− 80 °C.
Total RNA was extracted with the Spectrum Plant Total RNA kit (Sigma-Aldrich). Following a treatment with the DNAse I (Sigma-Aldrich), the RNA was reverse-transcribed using the SuperScript III reverse transcriptase (Invitrogen, Life Technologies, Waltham, USA).
Quantitative PCR amplification (SYBR Green Supermix, Bio-Rad, Hercules, CA, USA) was carried out in a 15-μl volume (primers in Supplementary Table S2) and the results were recorded by a CFX96 Touch Real-Time PCR detection system (Bio-Rad), run by CFX Manager software (Bio-Rad Laboratories, Hercules, CA, USA). The software applies comparative quanti-fication with an adaptive baseline. Each sample was run in two technical replicates with the following parameters: 95 °C 3 min, 40 cycles of 95 °C 10 s and 55 °C 30 s, with afinal step at 95 °C 10 s. Primers for genes VvMLO6, VvMLO11 and VvMLO13 were taken from Winterhagen et al.,30whereas for VvMLO7 they were specifically designed (Supplementary Table S2). Primers for VvWRKY19, VvWRKY27, VvWRKY48 and VvWRKY52 were taken from Guo et al.,55for VvEDS1 from Gao et al.56and for VvPR1, VvPR6 and VvLOX9 from
Dufour et al.57The new primer pairs were designed with the NCBI Primer Designing Tool (http://www.ncbi.nlm.nih.gov/tools/primer-blast/; Supple-mentary Table S2). CompleSupple-mentary DNA samples diluted 10, 100, 1000 and 10 000 times were used to test calculate the efficiency of the primers pairs and the size of the PCR products was confirmed by agarose gel electrophoresis. Presence of a specific final dissociation curve was determined after every quantitative PCR run with progressive increments of temperature from 65 to 95 °C (0.5 °C each step, 5 s).
Reference genes were, as reported for grapevine,58Elongation Factor 1α,
GAPDH and Actin. Reference genes stability was assessed with GeNorm (medgen.ugent.be/ ~ jvdesomp/genorm/): the three genes had M-values o0.5, well below the threshold of 1.5 considered sufficient for stability.59–61
Threshold cycles (Ct) were converted to relative expression following Hellemans et al.62and based on the average Ct of two technical replicates. For MLO genes, the reference Ct was the average of all samples; for other genes, the control EVB (empty vector Brachetto) at T = 0 was adopted.
Statistical analyses
Disease severity. Data were analyzed using the Statistica 9 software (StatSoft, Tulsa, OK, USA) and the package SPSS (IBM, Armonk, NY, USA). The smallest statistical unit considered was a plant. Severity values of all leaves were averaged, resulting in the value considered in further analyses. Normal distributions (Kolmogorov–Smirnov and Shapiro–Wilk tests, P40.05) were validated for variances homogeneity (Levene’s test, P40.05) and subsequently used for one-way analysis of variance (ANOVA) with Tukey’s post hoc test (Po0.05) at each time point. Data were transformed in arcsin(x) to meet the pre-requisites of ANOVA. In case of non-homogeneous variances, the Games–Howell’s post hoc test was used. In some cases, data from two experiments were pooled and the ANOVA applied independently for each time point (14, 22 and 30 d.p.i.). Area under disease progress curve data were treated as for severity data. Conidia counts were analyzed with the Kruskall–Wallis test (Po0.05). Quantitative PCR data analysis. Values of relative expression were expressed in logarithms26to obtain normal distributions and homogeneity
of variances of the residues, as assessed with Shapiro–Wilk (P ≤ 0.05) and Levene (P≤ 0.05). Homoscedastic data were analyzed with Tukey’s test (Po0.05) and non-homoscedastic with Games–Howell test (Po0.05) using the statistical package SPSS (IBM).
Expression data from two experiments were analyzed independently and pooled. Differences were revealed by one-way ANOVA with Tukey post hoc test (Po0.05). In addition, a two-way ANOVA with Tukey post hoc test (Po0.05), considered at the same time the effects of the transgenic line and of the time point. For the gene expression characterization of TLB4, Fisher post hoc test was used.
RESULTS
Gene transfer, selection and acclimation of MLO transgenic lines A total of five gene transfers were carried out. Four aimed to knockdown (KD) specific MLO genes (i = VvMLO6, ii = KD-VvMLO7, iii = KD-VvMLO11, iv = KD-VvMLO13), the fifth to insert an empty vector. Thirty-seven regenerated lines were obtained,
with 29 of them confirmed to contain the insert (Supplementary Table S3). The result of the PCR analysis of six lines is shown in Supplementary Figure S1. Twenty-six transgenic lines were propagated in vitro and tested for the silencing of MLO genes with quantitative PCR. Due to in vitro contaminations, three lines were lost before it was possible to test the level of expression. Gene knockdown was evident for three lines out of eight from gene transfer (iii) (KD-VvMLO11) and three out of nine from gene transfer (iv) (KD-VvMLO13), whereas the lines regenerated from gene transfers (i) (KD-VvMLO6) and (ii) (KD-VvMLO7) did not show any reduction of expression (data not shown). Regenerated lines were also tested for off-target silencing, showing that the RNAi fragments targeted other clade V MLO genes (data not shown). Six lines with various combinations of silenced genes were selected and indicated with acronyms TLB1 (transgenic line of Brachetto) to TLB6 (Supplementary Table S3). Lines from TLB1 to 3 came from gene transfer (iii) (KD-VvMLO11), lines from TLB4 to TLB6 from gene transfer (iv) (KD-VvMLO13; Supplementary Table S3). The control was the EVB line. In addition, TLB7, a regenerated line with no reduction of expression, was also included. All lines, including the control, will be referred in the text as‘transgenic lines’. Lines from TLB1 to 7 are further indicated as‘RNAi lines’ and from TLB1 to 6‘mlo lines’.
The survival rate of plants to the acclimation process was ~ 85%. Under greenhouse conditions, the transgenic plants showed normal growth and no pleiotropic phenotypes.
PM and downy mildew resistance of transgenic lines
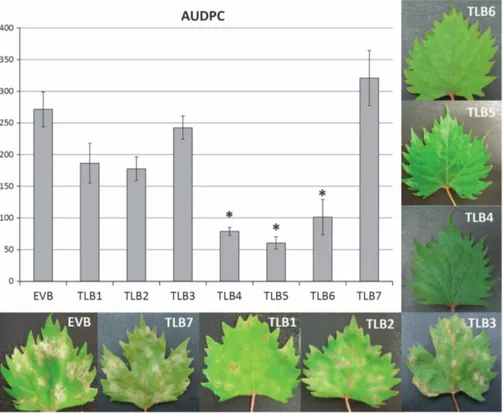
Two independent experiments of PM inoculation were carried out on the RNAi lines TLB1 to 7, and the transgenic control EVB. Three mlo lines, TLB4, 5 and 6, showed a reduction of E. necator infection 460% at 30 d.p.i. (Figure 1; Table 1). The disease reduction of TLB6 decreased with the progression of the infection (Table 1). TLB1, 2, 3 and 7 had a level of susceptibility to PM comparable to EVB (Figure 1; Supplementary Figure S2). The leaf phenotypes in Figure 1 visualize the differences between the different lines. All the mlo lines showed fewer conidia at 30 d.p.i. compared with EVB and the decrease was statistically significant for TLB4, TLB5 and TLB6 (Supplementary Figure S3). Compared with EVB plants, TLB4, 5 and 6 had a reduction of 93%, 95% and 72%, respectively. Conidia counts and disease severity were, as expected, correlated (R = 0.58; P⩽ 0.01). The reduction of conidia in TLB 4, 5 and 6 (93, 95 and 72%) was higher than the reduction of PM symptoms (68.4, 76.6 and 65.1%), indicating that the leaf diseased area had a lower concentration of conidia in TLB 4, 5 and 6 compared with EVB.
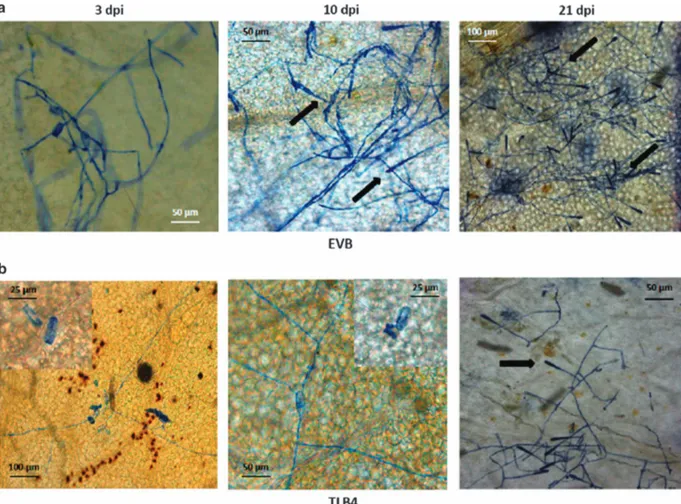
Line TLB4 was characterized by histological analysis, demon-strating a reduced progression of PM infection compared with EVB (Figure 2). In EVB, conidiophores appeared at 10 and 21 d.p.i. and they were present all over the leaf surface (Figure 2a), whereas on TLB4 leaves they were visible in a limited number only at 21 d.p.i. (Figure 2b). Histological analysis revealed the accumulation of autofluorogenic phenolic compounds possibly associated to host cell response and papillae formation in both TLB4 and EVB plants at 3 d.p.i. (Figure 3).
An experiment was designed to test the cross-reaction of mlo lines to fungal pathogens different from PM. Three mlo lines (TLB1, 3 and 4) and the EVB control were inoculated with the downy mildew causal agent Plasmopara viticola. None of the plants were resistant and all plants showed statistically compar-able levels of susceptibility to the pathogen (Supplementary Figure S4).
Expression of MLO genes in the mlo transgenic lines
The lines TLB1 to 6 and the EVB control were considered in a gene expression analysis. The results concerned four genes member of clade V and supported the off-target cross-silencing, as well as,
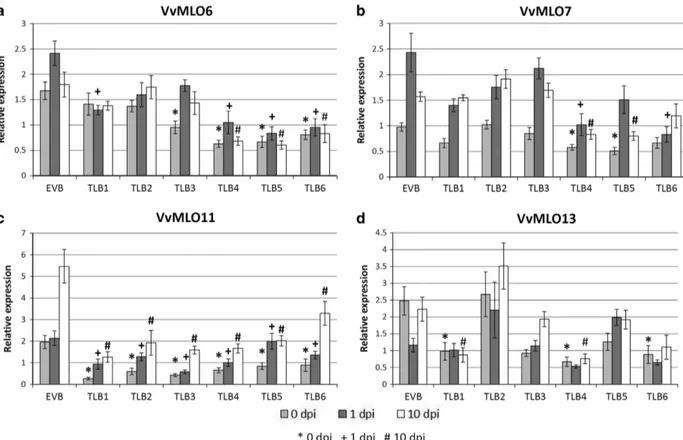
some variability among samples of different time points (Figure 4). Lines TLB1, 2 and 3, all resulting from transformation (iii) (KD-VvMLO11), as expected had the target gene VvMLO11 silenced. TLB1 showed also knockdown of VvMLO13 and TLB3 of VvMLO6 (Table 2). Lines TLB4, 5 and 6 derived from transformation (iv) (KD-VvMLO13) showed more off-target silencing: in TLB4 and 6, all four clade V MLO genes were, to some degree, significantly knocked down, whereas in TLB5 the expression of genes VvMLO6, 7 and 11 was reduced (Table 2).
Gene expression analysis of the mlo line TLB4
The expression profile at three time points of 13 genes not belonging to the MLO gene family and modulated by PM infection was carried out for the resistant line TLB4 and compared with the EVB line (Figure 5; Supplementary Table S4). The reason to choose TLB4 over the other resistant lines was that, in this line, all four MLO clade V genes were knocked down and the knockdown was more intense than TLB5 and 6. In EVB, seven of the genes tested were upregulated at 10 d.p.i. In TLB4, fewer genes were upregulated and the increase of expression was limited in terms of fold change (Figure 5; Supplementary Table S4). Moreover, three genes were downregulated in TLB4 after inoculation, namely, VvPR6 (pathogenesis related) at 1 d.p.i. and VvNPF3.2 (nitrate transporter/peptide transporter family) and VvALS1 (acetolactate synthase) at 10 d.p.i. It is noteworthy that, before the inoculation, there were no differences in expression between TLB4 and the control EVB (Figure 5; Supplementary Table S4).
DISCUSSION
Loss-of-function mutations of MLO genes reduce susceptibility to PM in barley,63 A. thaliana,21 pea,18 tomato,22 wheat23 and pepper.24 Because in dicots not all Clade V MLO S-genes are implicated in PM susceptibility,21,22,29,30the aim of this work was to identify which of the clade V MLO genes of grapevine have a role in PM susceptibility and can be inactivated to develop resistant genotypes. Out of 26 transgenic lines tested, six from gene transfers (iii) (KD-VvMLO11) and (iv) (KD-VvMLO13) supported significant gene knockdown. In the regenerated lines obtained from gene transfers (i) (KD-VvMLO6) and (ii) (KD-VvMLO7), reduction of expression was not evident. It cannot be excluded
Figure 1. Area under disease progress curve (AUDPC) of grapevines inoculated with Erysiphe necator in control (EVB) and transgenic lines (TLB1, 2, 3, 4, 5, 6 and 7). The average scores of AUDPC (from 8 to 19 biological replicates) from two experiments are reported. Error bars show s.e.m. The asterisks indicates statistically significant differences respect to the control line EVB, according to Tukey or Games–Howell post hoc test (P= 0.05). The representative leaves reproduced here were collected 30 days after inoculation.
Table 1. Disease reduction of seven RNAi lines transformed with MLO knockdown constructs.
Gene transfer
Number of plants
Disease reduction (%)a Average
reduction (%) 14 d.p.i. 22 d.p.i. 30 d.p.i.
TLB1 iii 8 22.8 32.3 34.3 29.8 TLB2 iii 15 49.2 37.2 23.8 36.8 TLB3 iii 15 17.9 14.8 2.0 11.6 TLB4 iv 19 60.8 71.7 72.8 68.4 TLB5 iv 14 76.7 79.1 74 76.6 TLB6 iv 11 71.8 63.1 60.3 65.1 TLB7 iii 13 − 8.0# − 21.5b − 21.2b − 16.9b
Abbreviations: EVB, empty vector Brachetto; RNAI, RNA interference.aLine
EVB was the control (12 replicates). Disease reduction was calculated as disease severity of EVB− disease severity of the transgenic line divided by disease severity of EVB × 100.bThe negative values of TLB7 indicate higher level of infection compared with EVB.
that this was due to the short RNAi fragments present in the constructs.64The detection of off-target silencing infive of the six mentioned lines was expected, as clade V MLO genes have high levels of sequence identity (36–60%, 46% on average29,30). Tofind a balance between specificity (short RNAi fragments) and effectiveness (long RNAi fragments) is particularly difficult in gene families with high sequence similarity.65As the aim was to study the effect of the knockdown of four MLO genes quite similar to each other, we opted for long RNAi fragments, so that off-target silencing was not only expected but also desired.
Knockout and knockdown of MLO genes may induce pleiotropic phenotypes, such as necrotic spots on leaves and reduced grain yield in barley,20slow growth in A. thaliana21and reduced plant
size in pepper.24 In grapevine, no pleiotropic phenotypes were
observed under the experimental conditions adopted.
Lines TLB4, 5 and 6, which showed clear resistance to PM, allowed the investigation of the link between resistance and the expression of specific MLO genes. VvMLO11 expression was significantly reduced in susceptible and resistant mlo lines: it is concluded that its knockdown was not directly linked to grapevine susceptibility to PM. VvMLO6 was significantly silenced in the resistant lines TLB4, 5 and 6, and in the susceptible line TLB3. As for VvMLO11, the knockdown of VvMLO6 in both susceptible and resistant lines indicates that this should not be an S-gene. Similarly to VvMLO6, VvMLO13 was knocked down in the resistant lines TLB4 and 6, but also in the susceptible line TLB1. VvMLO7 was knocked down only in the three resistant lines TLB4, 5 and 6, but it was always knocked down together with other two or three MLO
genes, as there was no line showing the knockdown of VvMLO7 only. Therefore, the knockdown of multiple MLO genes provided resistance to PM. VvMLO6 was also knocked down in all the resistant lines with a reduction of expression of 58–65%, whereas the reduction of its expression was of only 29% in the susceptible line TLB3, indicating that it can contribute to PM resistance. There are no information available about how the reduction of the expression of an S-gene affects disease severity: it could be a linear relationships, meaning that the reduction of expression causes a proportional reduction of disease severity, or there could be a threshold above which the knockdown, even if statistically significant, does not cause any reduction of disease severity. Given the weak knockdown of VvMLO6 in TLB3 (29%), it is possible that this hypothetical threshold was not surpassed, therefore we cannot rule out the possibility of a role for VvMLO6. This would be particularly surprising, as there are no precedence of MLO genes acting as S-genes without being upregulated upon PM inocula-tion, such as VvMLO6.29,30In conclusion, VvMLO6 and VvMLO7 are the main candidates for causing PM susceptibility in V. vinifera, with a possible additive activity. A similar scenario was observed in A. thaliana, where the simultaneous knockout of three MLO genes is necessary to obtain complete PM resistance: knockout of AtMLO2 results in a moderate level of resistance, whereas the knockout of AtMLO6 and AtMLO12, alone or combined, does not decrease the intensity of the infection.21When AtMLO2 is knocked out together with AtMLO6 or AtMLO12, the level of resistance rises to become complete when the three genes are knocked out together.21In grapevine, VvMLO7 is the best candidates to act as
Figure 2. Germination of E. necator conidia in the control line EVB (a) and in the resistant transgenic line TLB4 (b). Microscopy images of infected leaves were taken at 3, 10 and 21 days post inoculation (d.p.i.) with powdery mildew. Insert at high magnification highlights the germination of an E. necator conidia at 3 and 10 d.p.i. The arrows indicate the conidiophores.
A. thaliana AtMLO2, whereas VvMLO6 and VvMLO11 might have an additive synergistic role in PM susceptibility, as their expression was also significantly reduced in all three resistant lines. In A. thaliana, the knockout of three MLO genes induces complete resistance,21a situation not observed in grapevine, in agreement with the incomplete silencing of MLO genes obtained by the RNAi approach. A complementation test carried out in A. thaliana mlo triple mutant showed that VvMLO11 and VvMLO13 induce susceptibility to PM, whereas VvMLO7 has only a partial effect and VvMLO6 has no effect at all.66 However, single and double VvMLO11 and VvMLO13 knockdown mutants of V. vinifera obtained by RNAi did not show significant reduction of PM penetration.15 Accordingly, our data indicated only a putative additive effect provided by VvMLO11 and no role at all for VvMLO13. The differences observed with the results carried out by Feechan et al.66can be explained by the fact that they operated in a heterologous system (A. thaliana) not reproducing withfidelity the PM infection of grapevine plants.
The precise mechanism through which the reduction of MLO genes expression results in resistance to PM pathogens is not completely clear. Resistance seems linked to secretory vesicles traffic2,35 and to the formation of cell wall appositions called papillae.21These structures consists of a callose matrix enriched in proteins and autofluorogenic phenolics compounds,54 and their formation depends on endomembrane transport.67 Our results showed the accumulation of autofluorogenic compounds at the infection sites of transgenic and control lines that reflects the host response and the papilla formation. This first observation suggested that papillae were accumulated in both TLB4 and EVB lines. A difference in dimension was noted between the two lines, but further investigations are required to clear whether this is a direct consequence of MLO knockdown or a random event. Particularly, the use of specific staining protocols68
would allow to
better characterize the composition, dimensions and timing of papilla accumulation in resistant and susceptible lines. It is known that the defense response based on papillae differs between resistant and susceptible genotypes in timing of formation, composition and size.67–69Particularly, Chowdhury et al.68showed that the difference between effective and non-effective papillae is due to the higher concentration of callose, cellulose and arabinoxylan of the effective ones. The MLO protein has been proposed to be a negative regulator of vesicle-associated and actin-dependent defense pathways at the site of attempted PM penetration.27 Furthermore, Miklis et al.35 proposed that, once MLO proteins are under the control of the fungus, actinfilaments serve the purpose of supplying nutrients for the growing hyphae through vesicular transport. The pathogen may be able to control the transport of material to the cell wall, with the purpose of changing the composition of the papillae and turning them from effective to non-effective.
The formation of papillae is not the only process instigated by the activity of MLO genes. To understand the effect of MLO knockdown on other genes involved in plant–pathogen inter-action, the expression of 13 genes known to be differentially expressed after PM inoculation55–57,66,70–74 was analyzed. The knockdown of MLO genes in the TLB4 line did not affect the expression levels of the 13 considered genes as compared with the EVB line in absence of PM infection. At 1 d.p.i, the response of the considered genes was very limited in both the lines tested, suggesting that the infection was not sufficient to trigger the response. Conversely, some differences between TLB4 and EVB lines were observed at 10 d.p.i. As a general trend, seven genes (VvEDS1, VvPAD4, VvPR1, VvPR6, VvWRKY19, VvWRKY48 and VvWRKY52) were upregulated in EVB, reflecting the reaction of grapevine to PM. Conversely, only four genes (VvLOX1, VvNPF3.2, VvWRKY19 and VvWRKY52) were activated in TLB4, suggesting that
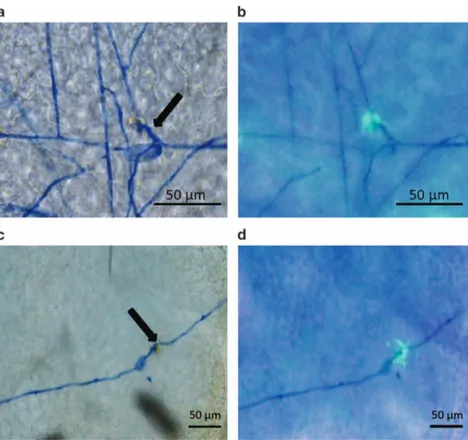
Figure 3. Microscopic visualization of powdery mildew infection in the control line EVB (a, b) and in the resistant transgenic line TLB4 (c, d). Microscopy images were taken with bright-field (a, c) and fluorescence (b, d) microscope at 3 days post inoculation (d.p.i.). One representative picture is reported for each line and arrows indicate germinated conidia. Scale bars, 50μm.
the less severe PM infection was not sufficient to activate the defense pathways with the same intensity of the susceptible control EVB. Particularly, VvNPF3.2, a nitrite/nitrate transporter, is known to be upregulated in grapevine infected with E. necator70 and it was downregulated in TLB4 at 10 d.p.i, indicating that only a severe infection could elicit VvNPF3.2 upregulation in this line. Three genes were upregulated at 10 d.p.i. in the control EVB but not in TLB4, namely, VvPR1, VvPR6 and VvEDS1 (enhanced disease susceptibility). The two pathogenesis-related genes are involved in plant defense and are known to be upregulated in PM-infected
grapevine leaves pretreated with a salicylic acid (SA) analog,57 whereas VvEDS1 is a grapevine defense gene involved in the SA pathway,56a plant growth regulator that activates pathogenesis-related genes and induces disease resistance.71This may indicate that only a severe E. necator infection triggers the plant defense
Figure 4. Gene expression of four grapevine MLO genes in the mlo lines TLB1, 2, 3, 4, 5 and 6, and in the control line EVB, following inoculation with E. necator. Expression of VvMLO6 (a), VvMLO7 (b), VvMLO11 (c) and VvMLO13 (d) was analyzed before (0 d.p.i.; light gray), 1 (dark gray) and 10 (white) days post inoculation. The mean scores offive to nine plants pooled from the two experiments are reported for each line. Error bars show s.e.m. For each time point, symbols highlight significant differences respect to the control EVB, according to Tukey or Games–Howell post hoctest (P= 0.05): *for 0 d.p.i.,+ for 1 d.p.i. and # for 10 d.p.i.
Table 2. Relative level of expression (RE%)aof VvMLO6, 7, 11 and 13 in transgenic lines TBL1 to 7
VvMLO6 VvMLO7 VvMLO11 VvMLO13
TLB1 67 72 25** 49** TLB2 79 94 40** 156 TLB3 71* 93 27** 69 TLB4 38** 49** 34** 33** TLB5 35** 55** 50** 88 TLB6 42** 53** 55** 45** TLB7 83 85 51 57
*, **indicates statistically significant difference at P = 0.05 and P = 0.01, respectively, according to the Tukey post hoc test.aEach RE% value is the
average of time points 0, 1 and 10 d.p.i. and of two experiments. RE%= (RE of mlo line/RE of control EVB) × 100.
Figure 5. Relative expression of 13 grapevine genes at three time points in the control line EVB and in the resistant line TLB4. The color scale indicates the expression values relative to the control EVB at 0 d.p.i, used as reference for data normalization. The asterisks highlight statistically significant differences according to Fisher post hoc test. One and two asterisks indicate significance at P= 0.05 and P = 0.01, respectively. The image was prepared with the Multiexperiment Viewer software with the Log2 of relative expression data.
depending on SA. However, the expression profiles observed in this two lines need to be confirmed by further gene expres-sion studies that comprise more transgenic control and knockdown lines.
The knockout of MLO genes increased susceptibility to other pathogens in barley75,76 and A. thaliana.21 Not surprisingly, the infection with P. viticola, an obligate biotroph fungus such as E. necator, revealed that the knockdown of MLO genes did not change the susceptibility of grapevine to downy mildew, supporting the conclusion that MLOs S-genes are specific for E. necator and are not involved in the plant interaction with P. viticola.
This work provides crucial information that can be used in breeding grapevine varieties resistant to E. necator. The tagging via genome editing of the MLO genes identified in this paper should result in knockout mutants highly resistant to PM. Alternatively, the search in V. vinifera and in wild species of non-functional MLO alleles should contribute to the creation of durable resistance.
CONFLICT OF INTEREST
The authors declare that on 08/07/2015 a patent protecting VvMLO genes has been submitted to the European Patent Office (EPO). The patent application number is PCT/EP2015/065624.
ACKNOWLEDGEMENTS
We thank Valentino Poletti for the help with gene transfers and in vitro cultivation and acclimation and Oscar Giovannini for the help with disease severity assessment. This work was funded by the autonomous province of Trento (Italy) and the GMPF PhD program.
AUTHOR CONTRIBUTIONS
SP propagated and acclimated the transgenic lines, carried out the gene expression analysis and the statistical analysis and wrote the major part of the manuscript. LL designed and performed the inoculation experiments and visually assessed the symptoms with powdery and downy mildew, counted the conidia, took the microscopy pictures and revised the manuscript. MP designed the inoculation experiments, contributed to the analysis of severity and gene expression data, and revised the manuscript. MC carried out the grapevine gene transfer, identified false positives and revised the manuscript. LDC carried out the grapevine gene transfer and revised the manuscript. SU designed and built the construct for RNAi and revised the manuscript. GV conceived the project and revised the manuscript. RV conceived the project and revised the manuscript. FS conceived the project and revised the manuscript. MM conceived the project, contributed to data analysis and was the main reviser of the manuscript.
REFERENCES
1 EUROSTAT EC. The use of plant protection products in the European Union. Data 1992-2003. Luxembourg: Office for Official Publications of the European Communities 2007. ISBN 92-79-03890-7.
2 Feechan A, Kabbara S, Dry IB. Mechanisms of powdery mildew resistance in the Vitaceae family. Mol Plant Pathol 2011;12: 263–274.
3 Wilcox WF Grapevine Powdery Mildew. Publication number 102GFSG-D2. New York State Integrated Pest Management Program 2013.
4 Calonnec A, Cartolaro P, Poupot C, Dubourdieu D, Darriet P. Effects of Uncinula necator on the yield and quality of grapes (Vitis vinifera) and wine. Plant Pathol 2004;53: 434–445.
5 Wightwick A, Walters R, Allinson G, Reichman S, Menzies N. Environmental risks of fungicides used in horticultural production systems. In: Odile Carisse (ed.) Fungicides. Croatia: In-Tech, 2010: 273–304.
6 Fuller KB, Alston JM, Sambucci O. The value of powdery mildew resistance in grapes: evidence from California. Wine Econ Policy 2014;3: 90–107.
7 Baudoin A, Olaya G, Delmotte F, Colcol JF, Sierotzki H. QoI resistance of Plasmo-para viticola and Erysiphe necator in the mid-Atlantic United States. Plant Health Progress 2008; doi:10.1094/PHP-2008-0211-02-RS.
8 Dufour MC, Fontaine S, Montarry J, Corio-Costet MF. Assessment of fungicide resistance and pathogen diversity in Erysiphe necator using quantitative real-time PCR assays. Pest Manag Sci 2011;67: 60–69.
9 Kunova A, Pizzati C, Bonaldi M, Cortesi P. Metrafenone resistance in a population of Erysiphe necator in northern Italy. Pest Manag Sci 2015;72: 398–404. 10 Jones L, Riaz S, Morales-Cruz A, Amrine KCH, McGuire B, Gubler WD et al. Adaptive
genomic structural variation in the grape powdery mildew pathogen, Erysiphe necator. BMC Genom 2014;15: 1081.
11 Gadoury DM, Seem RC, Ficke A, Wilcox WF. Ontogenic resistance to powdery mildew in grape berries. Phytopathol 2003;93: 547–555.
12 Fung RWM, Gonzalo M, Fekete C et al. Powdery mildew induces defense-oriented reprogramming of the transcriptome in a susceptible but not in a resistant grapevine. Plant Physiol 2008;146: 236–249.
13 Dodds PN, Rathjen JP. Plant immunity: towards an integrated view of plant pathogen interactions. Nat Rev Genet 2010;11: 539–548.
14 Qiu W, Feechan A, Dry I. Current understanding of grapevine defense mechan-isms against the biotrophic fungus (Erysiphe necator), the causal agent of powdery mildew disease. Hort Res 2015;2: 15020.
15 Morel JB, Danql JL. The hypersensitive response and the induction of cell death in plants. Cell Death Differ 1997;4: 671–683.
16 Parlevliet JE. What is durable resistance, a general outline. In: Jacobs TH, Parlevliet JE (ed.) Durability of Disease Resistance. The Netherland: Kluwer Academic Publisher 1993: 23–29.
17 Pavan S, Jacobsen E, Visser RGF, Bai Y. Loss of susceptibility as a novel breeding strategy for durable and broad-spectrum resistance. Mol Breed 2010;25: 1–12.
18 Pavan S, Schiavulli A, Appiano M, Marcotrigiano AR, Cillo F, Visser RGF et al. Pea powdery mildew er1 resistance is associated to loss-of-function mutations at a MLO homologous locus. Theor Appl Genet 2011;123: 1425–1431.
19 Van Schie CCN, Takken FLW. Susceptibility genes 101: how to be a good host. Annu Rev Phytopathol 2014;52: 551–581.
20 Jørgensen JH. Discovery, characterization and exploitation of Mlo powdery mildew resistance in barley. Euphytica 1992;63: 141–152.
21 Consonni C, Humphry ME, Hartmann HA, Livaja M, Durner J, Westphal L et al. Conserved requirement for a plant host cell protein in powdery mildew patho-genesis. Nat Genet 2006;38: 716–720.
22 Bai Y, Pavan S, Zheng Z, Zappel NF, Reinstädler A, Lotti C et al. Naturally occurring broad-spectrum powdery mildew resistance in a Central American tomato accession is caused by loss of MLO function. Mol Plant Microbe Interact 2008;21: 30–39.
23 Wang Y, Cheng X, Shan Q, Zhang Y, Liu J, Gao C et al. Simultaneous editing of three homoeoalleles in hexaploid bread wheat confers heritable resistance to powdery mildew. Nat Biotechnol 2014;32: 947–952.
24 Zheng Z, Nonomura T, Appiano M, Pavan S, Matsuda Y, Toyoda H et al. Loss of function in Mlo orthologs reduces susceptibility of pepper and tomato to pow-dery mildew disease caused by Leveillula taurica. PLoS One 2013;8: e70723. 25 Acevedo-Garcia J, Kusch S, Panstruga R. Magical mystery tour: MLO proteins in
plant immunity and beyond. New Phytol 2014;204: 273–281.
26 Pessina S, Pavan S, Catalano D et al. Characterization of the MLO gene family in Rosaceae and gene expression analysis in Malus domestica. BMC Genomics 2014; 15: 618.
27 Panstruga R. Serpentine plant MLO proteins as entry portals for powdery mildew fungi. Biochem Soc Trans 2005;33: 389–392.
28 Reinstädler A, Müller J, Czembor JH, Piffanelli P, Panstruga R. Novel induced mlo mutant alleles in combination with site-directed mutagenesis reveal functionally important domains in the heptahelical barley Mlo protein. BMC Plant Biol 2010; 10: 31.
29 Feechan A, Jermakow AM, Torregrosa L, Panstruga R, Dry IB. Identification of grapevine MLO gene candidates involved in susceptibility to powdery mildew. Funct Plant Biol 2008;35: 1255–1266.
30 Winterhagen P, Howard SF, Qiu W, Kovács LG. Transcriptional up-regulation of grapevine MLO genes in response to powdery mildew infection. Am J Enol Vit 2008;59: 159–168.
31 Piffanelli P, Zhou FS, Casais C, Orme J, Jarosch B, Schaffrath U et al. The barley MLO modulator of defense and cell death is responsive to biotic and abiotic stress stimuli. Plant Physiol 2002;129: 1076–1085.
32 Devoto A, Piffanelli P, Nilsson I, Wallin E, Panstruga R, von Heijne G et al. Topology, subcellular localization, and sequence diversity of the Mlo family in plants. J Biol Chem 1999;274: 34993–35004.
33 Chen Z, Noir S, Kwaaitaal M, Hartmann A, Wu MJ, Mudgil Y et al. Two seven-transmembrane domain MILDEW RESISTANCE LOCUS O proteins cofunction in Arabidopsis root thigmomorphogenesis. Plant Cell 2009;21: 1972–1991. 34 Kessler SA, Shimosato-Asano H, Keinath NF, Wuest SE, Ingram G, Panstruga R et al.
Conserved molecular components for pollen tube reception and fungal invasion. Science 2010;330: 968.
35 Miklis M, Consonni C, Bhat RA, Lipka V, Schulze-Lefert P, Panstruga R et al. modulates actin-dependent and actin-independent antifungal defense pathways at the cell periphery. Plant Physiol 2007;144: 1132–1143.
36 Aist JR, Bushnell WR. Invasion of plants by powdery mildew fungi, and cellular mechanisms of resistance. In: Cole GT, Hoch HC (ed.) The Fungal Spore and Disease Initiation in Plants and Animals. New York, USA: Plenum press, 1991: 321–345.
37 Gaj T, Gersbach CA, Barbas CF III. 2013 ZFN, TALEN, and CRISPR/Cas-based methods for genome engineering. Trends Biotechnol 2013;31: 7.
38 Lozano-Juste J, Cutler SR. Plant genome engineering in full bloom. Trends Plant Sci 2014;19: 284–287.
39 Puchta H, Fauser F. Synthetic nucleases for genome engineering in plants: pro-spects for a bright future. Plant J 2014;78: 7276–7741.
40 Karimi M, Inze D, Depicker A. GATEWAYTM vectors for Agrobacterium-mediated plant transformation. Trends Plant Sci 2002;7: 193–195.
41 Urso S, Zottini M, Ruberti C et al. An Agrobacterium tumefaciens-mediated gene silencing system for functional analysis in grapevine. Plant Cell Tissue Organ Cult 2013;114: 49–60.
42 Zottini M, Barizza E, Costa A et al. Agroinfiltration of grapevine leaves for fast transient assays of gene expression and for long-term production of stable transformed cells. Plant Cell Rep 2008;27: 845–853.
43 Dalla Costa L, Pinto-Sintra AL, Campa M, Poletti V, Martinelli L, Malnoy M. Development of analytical tools for evaluating the effect of T-DNA chimeric integration on transgene expression in vegetatively propagated plants. Plant Cell Tissue Organ Cult 2014;118: 471–484.
44 Dalla Costa L, Vaccari I, Mandolini M, Martinelli L. Elaboration of a reliable strategy based on real-time PCR to characterize genetically modified plantlets and to evaluate the efficiency of a marker gene removal in grape (Vitis spp.). J Agric Food Chem 2009;57: 2668–2677.
45 Perrone I, Gambino G, Chitarra W, Vitali M, Pagliarani C, Riccomagno N et al. The grapevine root-specific aquaporin VvPIP2;4N controls root hydraulic conductance and leaf gas exchange under well-watered conditions but not under water stress. Plant Physiol 2012;160: 965–977.
46 Martinelli L, Gribaudo I, Bertoldi D, Candioli E, Poletti V. High efficiency somatic embryogenesis and plant germination in grapevine cultivars Chardonnay and Brachetto a grappolo lungo. Vitis 2001;40: 111–115.
47 McCown BH, Lloyd G. Woody plant medium (WPM) - a mineral nutrient for-mulation for microculture of woody plant species. Hort Sci 1981;16: 453. 48 Blaich R, Heintz C, Wind R. Studies on conidial germination and initial growth of
the grapevine powdery mildew Uncinula necator on artificial substrates. Appl Microbiol Biotechnol 1989;30: 415–421.
49 EPPO. Guideline for the biological evaluation of fungicides: uncinula necator. EPPO Bull 1988;18: 605–612.
50 EPPO. European and Mediterranean Plant Protection Organization (EPPO). Guidelines for the efficacy evaluation of fungicides: Plasmopara viticola. EPPO Bull 2001;31: 313–317.
51 Campbell CL, Madden LV. Introduction to plant disease epidemiology, New York, USA: John Wiley and Sons, 1990.
52 Madden LV, Hughes G, Van Den Bosch F. The Study of plant disease epidemics. St. Paul, USA: APS press, 2007.
53 Angeli D, Puopolo G, Maurhofer M, Gessler C, Pertot I. Is the mycoparasitic activity of Ampelomyces quisqualis biocontrol strains related to phylogeny and hydrolytic enzyme production? Biol Control 2012;63: 348–358.
54 Vanacker H, Carver TLW, Foyer CH. Early H2O2accumulation in mesophyll cells
leads to induction of glutathione during hypersensitive response in the barley-powdery mildew interaction. Plant Physiol 2000;123: 1289–1300.
55 Guo C, Guo R, Xu X et al. Evolution and expression analysis of the grape (V. vinifera) WRKY gene family. J Exp Bot 2014;65: 1513–1528.
56 Gao F, Dai R, Pike SM, Qiu W, Gassmann W. Functions of EDS1-like and PAD4 genes in grapevine defenses against powdery mildew. Plant Mol Biol 2014;86: 381–393.
57 Dufour MC, Lambert C, Bouscaut J, Mérillon JM, Corio-Costet MF. Benzo-thiadiazole-primed defence responses and enhanced differential expression of defence genes in Vitis vinifera infected with biotrophic pathogens Erysiphe necator and Plasmopara viticola. Plant Pathol 2013;62: 370–382.
58 Reid KE, Olsson N, Schlosser J, Peng F, Lund ST. An optimized grapevine RNA isolation procedure and statistical determination of reference genes for real-time RT-PCR during berry development. BMC Plant Biol 2006;6: 27.
59 Strube C, Buschbaum S, Wolken S, Schnieder T. Evaluation of reference genes for quantitative real-time PCR to investigate protein disulfide isomerase tran-scription pattern in the bovine lungworm Dictyocaulus viviparus. Gene 2008;425: 36–43.
60 Van Hiel MB, Van Wielendaele P, Temmerman L, Van Soest S, Vuerinckx K, Huy-brechts R et al. Identification and validation of housekeeping genes in brains of the desert locust Schistocerca gregaria under different developmental conditions. BMC Mol Bio 2009;10: 56.
61 Ling D, Salvaterra PM. Robust RT-qPCR data normalization: validation and selec-tion of internal reference genes during post-experimental data analysis. PLoS One 2011;6: 3.
62 Hellemans J, Mortier G, De Paepe A, Speleman F, Vandesompele J. qBase relative quantification framework and software for management and automated analysis of real-time quantitative PCR data. Genome Biol 2007;8: R19.
63 Büschges R, Hollricher K, Panstruga R, Simons G, Wolter M, Frijters A et al. The barley Mlo gene: a novel control element of plant pathogen resistance. Cell 1997; 88: 695–705.
64 Preuss S, Pikaard CS. Targeted gene silencing in plants using RNA interference. In: Engelke D (ed.) RNA Interference (RNAi): Nuts & Bolts of siRNA Technology. Saint Louis, USA: Sigma-Aldrich, 2003: 23–36.
65 Zhao W, Fanning ML, Lane T. Efficient RNAi-based gene family knockdown via set cover optimization. Artif Intell Med 2005;35: 61–73.
66 Feechan A, Jermakow AM, Ivancevic A, Godfrey D, Pak H, Panstruga R et al. Host cell entry of powdery mildew is correlated with endosomal transport of antag-onistically acting VvPEN1 and VvMLO to the papilla. Mol Plant Microbe Interact 2013;26: 1138–1150.
67 Hückelhoven R. The effective papilla hypothesis. New Phytol 2014;204: 438–440. 68 Chowdhury J, Henderson M, Schweizer P, Burton RA, Fincher GB, Little A. Differ-ential accumulation of callose, arabinoxylan and cellulose in nonpenetrated versus penetrated papillae on leaves of barley infected with Blumeria graminis f. sp. Hordei. New Phytol 2014;204: 650–660.
69 Lyngkjær MF, Newton AC, Atzema JL, Baker SJ. The Barley mlo-gene: an important powdery mildew source. Agronomie 2000;20: 745–756.
70 Pike S, Gao F, Kim MJ, Kim SH, Schachtman DP, Gassmann W. Members of the NPF3 transporter subfamily encode pathogen-Inducible Nitrate/Nitrite transpor-ters in grapevine and Arabidopsis. Plant Cell Physiol 2014;55: 162–170. 71 Ward ER, Uknes SJ, Williams SC et al. Coordinate gene activity in response to
agents that induce systemic acquired resistance. Plant Cell 1991;3: 1085–1094. 72 Lorek JA Molecular characterization of mlo-based powdery mildew resistance and
the role of heterotrimeric G-protein signaling in Arabidopsis defense. PhD dis-sertation: Universität zu Köln: Köln, Germany, 2012.
73 Collins NC, Thordal-Christensen H, Lipka V et al. SNARE-protein-mediated disease resistance at the plant cell wall. Nature 2003;425: 973–977.
74 Gao D, Huibers RP, Loonen AE, Visser RGF, Wolters AM, Bai Y. Down-regulation of acetolactate synthase compromises Ol-1-mediated resistance to powdery mildew in tomato. BMC Plant Biol 2014;14: 32.
75 Jarosch B, Kogel KH, Schaffrath U. The ambivalence of the barley Mlo locus: Mutations conferring resistance against powdery mildew (Blumeria graminis f. sp. hordei) enhance susceptibility to the rice blast fungus Magnaporthe grisea. Mol Plant Microbe Interact 1999;12: 508–514.
76 Kumar J, Hückelhoven R, Beckhove U, Nagarajan S, Kogel KH. A compromised Mlo pathway affects the response of barley to the necrotrophic fungus Bipolaris sorokiniana (Teleomorph: Cochliobolus sativus) and its toxins. Phytopathol 2001; 91: 127–133.
This work is licensed under a Creative Commons Attribution 4.0 International License. The images or other third party material in this article are included in the article’s Creative Commons license, unless indicated otherwise in the credit line; if the material is not included under the Creative Commons license, users will need to obtain permission from the license holder to reproduce the material. To view a copy of this license, visit http://creativecommons.org/licenses/ by/4.0/
Supplementary Information for this article can be found on the Horticulture Research website (http://www.nature.com/hortres).