Alma Mater Studiorum - Università di Bologna
DOTTORATO DI RICERCA IN BIOCHIMICA CICLO XXIV
The role of mitochondria in the regulation of gamma rays induced
mTOR-dependent senescence
TESI PRESENTAT A DA: RELATORE:
Dott.ssa Elisa Mariani Chiar. mo Prof. Giovanni Ro meo
(matricola 376182) CORRELATORE Dott. Giuseppe Gasparre
COORDINATORE:
Chiar. mo Prof. Giorgio Lenaz
Esame Finale anno 2012
SETTORE CONCORSUALE DI APPARTENENZA 05/F1 SETTORE DISCIPLINARE BIO/13
INDEX
1. INTRODUCTION
1.1 CELLULAR SENESCENCE pag. 3 1.1.1 Replicative Senescence pag. 7 1.1.2 Oncogene-induced Senescence (OIS) pag. 8 1.1.3 PTEN loss-induced Senescence (PICS) pag. 10 1.1.4 Stress-induced Senescence pag.11 1.1.5 The regulators of cellular senescence: p53-p21 and p16INK4A-pRb pag. 11 1.1.6 Senescence in vivo pag. 13 1.1.7 Senescence and tumorigenesis pag. 14 1.2 mTOR pag. 16 1.3 MITOCHONDRIA pag. 20 1.3.1 Mitochondrial genome pag.21 1.3.2 Mitochondrial biogenesis pag. 23 1.3.3 Oncocytic tumors: a model to study mitochondrial dysfunction pag. 25 1.4 COWDEN SYNDROME AND PTEN pag. 26 1.4.1 PTEN structure and functions pag. 27 1.5 BIRT-HOGG-DUBE‟ SYNDROME AND FLCN pag. 30 1.5.1 FLCN: structure and functions pag. 30
2. MATERIALS AND METHODS pag. 33
3. AIM OF THE STUDY pag. 49
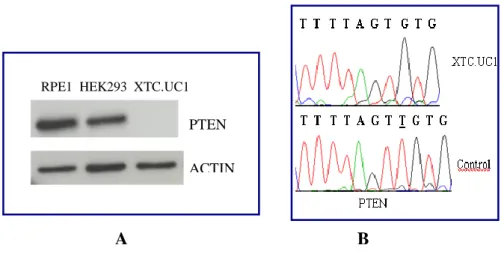
4. RESULTS pag. 50 4.1 Study of the link between senescence and mitochondrial biogenesis induced by γ-rays treatment pag. 50 4.1.1 Sequencing of TP53, PTEN, K-Ras and H-Ras genes pag. 52 4.1.2 Cellular response to a genotoxic stress: cellular senescence pag. 56 4.2 mTOR: a single pathway may regulate senescence and mitochondrial biogenesis pag. 68 4.2.1 RPE1 and mTORC1 pag. 69 4.2.2 HCT116 and mTORC1 pag. 73 4.2.3 XTC.UC1 and mTORC1 pag. 76 4.3 mTOR and the oncocytic tumors of the hereditary cancer syndrome pag.79
6. CONCLUSIONS pag. 95
7. BIBLIOGRAPHY pag.97
APPENDIX A pag. 103
ABSTRACT pag.106
PUBLICATIONS AND PROCEEDINGS pag.107
1. INTRODUCTION
1.1 CELLULAR SENESCENCE
Senescence was formally described in 1965 by Hayflick, as a process that limits the proliferation of human fibroblast in culture [1]. Hayflick experiments showed that human fibroblast, over many cell doublings, underwent a decline in cell proliferation. Eventually, all cells in the culture lost the ability of divide [2]. A phenotype similar to senescence described by Hayflick was observed on overexpression of an oncogenic version of H-Ras (H-RasV12) in fibroblast in vitro. Normal cells forced to express high levels of the oncogene, rather than proliferate, stopped dividing and suffered morphological and molecular changes similar to those observed by Hayflick [3]. Based on these observations, cellular senescence refers to the essentially irreversible growth arrest that occurs in cells subjected to several kinds of stress in order to limit the proliferation of damaged cells or of cells reaching the “Hayflick limit”.
Cellular senescence limits the proliferation of cells, therefore it can be induced only in mitotic cells (epithelial, stromal and vascular cells that comprise the major renewable tissues and organs such as skin, intestines, liver and kidney).
Recently it has been demonstrated the presence of senescent cells even in some kinds of tumors, such as pre-malignant tumors and tumoral cells at early stage of tumorigenesis [4, 5, 2, 6].
Senescent growth arrest is essentially irreversible, in contrast to what observed in quiescent cells; in fact it was verified that senescent cells cannot be stimulated to proliferate even in the presence of growth factors [2].
Only after inactivation of pathways that are responsible to regulate and maintain senescence phenotype (for example p53-p21 and p16INK4A-pRb pathways) can be reverted the proliferative arrest that characterized these cells. For example, inactivation of the p53 pathway permits senescence reversal [7, 8], likewise inactivation of some interleukins also abrogates the proliferative arrest [9, 10]. Another feature of senescent cells, which distinguishes them from quiescent cells, is that senescent cells are metabolically active even if not proliferate.
Senescent cells become resistant to cell-death signals, such as apoptotic signals, and they acquire widespread morphological changes, as well as changes in gene
expression, distinguishing them from proliferating cells. Taken together, all these changes define what is called “senescent phenotype” [2].
Senescent can be induced by many stimuli (Fig.1)
Fig.1: Mitotically competent cells respond to various stressors by undergoing cellular senescence
[2].
It is possible to distinguish several type of senescence, based on the type of stimuli that induce it:
1) Replicative Senescence: this type of senescence is caused by telomere erosion, due to the gradual loss of DNA at the ends of chromosomes during each S phase. It is this type of senescence that Hayflick described in your experiment [1].
2) Premature cellular senescence: senescence can be induced in the absence of telomere loss or dysfunction. This type of senescence has been termed premature, since it arises before replicative senescence. Several kinds of stress can determine the activation of this type of senescence, hence it is possible to distinguish between:
Stress-induced senescence: in vitro premature senescence can result from inadequate culturing conditions [11, 12], oxidative stress [13, 5, 14] and exposure to agents that cause DNA damage such as chemotherapeutic drugs and ionizing radiation [2].
Oncogene-induced Senescence (OIS): normal cells respond to oncogenes over-expression or loss of tumor suppressor genes by undergoing senescence [3].
PTEN loss-induced senescence (PICS): this type of senescence is rapidly induced as a consequence of loss of PTEN tumor supppressor gene [6].
Cell senescence is generally accompanied by morphological changes, that facilitate the identification both in vivo and in vitro.
To date, an exclusive marker that can be used to identify the activation of cellular senescence as not yet been defined, and on the other hand it is clear that not all senescent cells express the same markers [2, 15].
The marker that is commonly used to identify senescent cells is Senescence-Associated β-galactosidase (SA-βgal) [26]. It has been demonstrated that senescence cells are characterized by an increase in SA-β-GAL activity. Its increase activity in senescent cells derives from lisosoma β-D-galactosidase, which is encoded by the GLB1 gene [27]. Acid β-D-galactosidase i san eukaryotic hydrolas localized in the lysosome. It clave β-linked terminal galactosyl residues froma wide range of substrates (gangliosides, glycoproteins and glycosaminoglycans). The increase in SA-β-GAL activity in senescent cells is likely due to an expansion of the lysosomal compartment, as a result of the accumulation of damaged macromolecules in lysosomes [28]. The increase expression of β-D-galactosidase and the expansion of the lysosomal compartment, cause an increase in β-galactosidase activity that can be measured also at suboptimal pH6 [27]. Senescent cells can be easily identified with respect to proliferating cells using a cytochemical assay that evaluate the activity of β-galactosidase.
The hallmark of cellular senescence is an inability to progress through the cell cycle. Senescent cells arrest growth, usually with a DNA content that is typical of G1 phase [16]. The feature and stringency of the senescent growth arrest vary depending on the species and the genetic background of the cell. For example, it has been shown that mouse fibroblast senesce with a G2/M DNA content as a result of a defect in the stress-signaling kinase MKK7 [17].
Likewise, oncogenes overexpression cause a fraction of cells to senesce with a DNA content that is typical of G2 phases [18, 19].
Cell senescence is generally accompanied by morphological changes, which allow distinguishing them from proliferating and terminally differentiated cells.
In general, senescence cells increase in size, in some cases a two-fold increase compared to non-senescence cells it has been observed. Furthermore, cells can become large, flat and multinucleated.
Beside those that are considered common alterations of senescent cells, there are morphological changes that are peculiar to a particular type of senescence. For example, a flat cell phenotype is commonly seen in cells undergoing H-RasV12-induced senescence [3, 20], stress-induced senescence [21] or DNA-damage induced [22]. Cell senescing due to BRAFE600 expression or the silencing of p400, however, acquires a more spindle-shaped morphology [23, 24]. Melanocytes undergoing H-RasV12-induced senescence display extensive vacuolization as a result of endoplasmic reticulum stress caused by the unfold protein response (UPR) [20]. Furthermore, vacuolization it has been demonstrated in fibroblast underwent H-Ras-induced senescence, where it has been demonstrated the involvement of mitochondria in the regulation of cellular senescence [25].
Cellular senescence can be associated with an altered chromatin structure, at least in vitro. It has been demonstrated that cycling or quiescent cells, labeled with DNA dyes such as DAPI (4‟,6-diamidino-2-phenylindole) display overall homogenous staining patterns, instead senescent cells often show strikingly different punctuate pattern [29]. These nuclear foci which characterized senescent cells are called SAHFs (Senescence-Associated Heterochromatic Foci), and correspond to highly compact heterochromatic regions. These SAHFs are specifically enriched in proteins such as histone H3 methylated on Lys 9 (H3K9me) and HP1 (heterochromatin protein 1). It was verified that SAHFs are formed in proximity of the promoters of several E2F target genes, which are then silenced [2, 29].
In this way, SAHFs silence the expression of genes that are needed for cell cycle progression, thereby contributing to the block of cell proliferation. The p16INK4A -pRB regulates the SAHFs formation [29].
Cells undergoing senescence exhibit profound changes in their transcriptomes. As a result senescent cells secrete numerous factors, such as chemokines, growth factors and proteases [5, 10, 30]. It was verified that these factors have autocrine activities on the cells which they were secreted and a paracrine action on surrounding cells. These factors can affect surrounding cells by activating signal
transduction pathways that may lead to multiple pathologies including cancer [30]. Factors secreted by senescent cells constitue the SASP (Senescence associated secretory phenotype).
SASP factors can be divided into the following categories:
1) soluble signaling factors (interleukins, chemokines and growth factors); 2) secreted proteases;
3) secreted insoluble proteins and extracellular matrix components (ECM). A recent study indicates that, for the induction of several SASP factors, persistent DNA damage is required. Because DNA damage is typical of some but not all kind of senescence, the SASP is produced only when senescence is accompanied by the activation of DDR [31].
1.1.1 Replicative Senescence
Whit the expression “Replicative senescence” we refer to senescence induced in normal cells which are reaching the “Hayflick Limit” [1]. The proliferative arrest is caused, as previously discussed, by telomere erosion, an event that in mammalian cells occurs at the end of each replicative cycle. Telomeres are stretches of repetitive DNA (5‟-TTAGGG-3‟) and associated proteins that cap the ends of linear chromosomes and protect them from degradation or fusion by DNA-repair processes [2]. Telomeres length is maintained by specific enzyme called telomerase. Most normal cells do not express telomerase, or express it at levels that are too low to prevent telomere shortening [2]. Moreover, DNA polymerase cannot completely replicate DNA ends, a phenomenon called the end-replication problem. As a consequence, cells lose 50-200 bp of telomeric DNA during each S-phase. When telomeres reach a critical minimal length the replication is blocked and this phenomenon triggers the activation of DNA damage response (DDR). The DDR enables cells to sense damaged DNA, particularly double strand breaks (DSBs), and to respond by arresting cell-cycle progression and repairing the damage if possible [2, 10]. The DDR is associated with the appearance of SAHFs, at the level of which are located multiple proteins. Multiple proteins participate in the DDR, including protein kinases (ATM (ataxia telangiectasia mutated) ATR(ataxia telangiectasia and Rad3 related) CHK1 e CHK2 (checkpoint kinase 1 and 2), adaptor proteins (53BP1 e MDC1 (mediator
of DNA damage checkpoint protein-1)) and chromatin modifiers, for example γ-H2AX.
The kinases CHK1 and CHK2 are responsible to propagate the damage signal to effector molecules such as the phosphatase CDC25 and p53. The effector molecules halt the cell cycle progression. If DNA damage exceeds a threshold, cells are destined to undergo either apoptosis or senescence; the severity and the type of the damage are important factor that can determine the activation of senescence instead apoptosis [32].
In addiction to p53, it was demonstrated that p16INK4A-pRB pathway is essential for induction of senescence [33,34]. The relative contribution of these pathways to senescence depend on cell type (Fig. 2).
Fig.2: Replicative senescence is driven by telomere erosion, and can results in activation of p16
and/or p53 [6]
The dependence of replicative senescence on telomere shortening is evident from its bypass by the ectopic expression of the catalytic subunit of the telomerase holoenzyme (hTERT). This enzyme is responsible to elongates telomeres and then to block the induction of senescence [2]. The limited life span of most primary cells is explained by the fact that, in contrast to stem cells, telomerase is not express or is express at low level in human somatic cells [35]. Likewise, tumor cells often express telomerase [36] or elongate their telomeres through a mechanism termed alternative lengthening of telomeres (ALT) [37].
1.1.2 Oncogene-induced Senescence (OIS)
Normal cells respond to oncogenes by undergoing senescence. This phenomenon was observed for the first time, in normal human fibroblast expressed an oncogenic form of Ras (H-RasV12) oncogene [3].
This type of senescence, that is induced prior of replicative senescence, is call Oncogene-Induced Senescence (OIS). To date, it was shown that other members of the Ras signalling pathway, such as RAF, MEK, MOS and BRAF, as well as
pro-proliferative nuclear proteins (E2F-1), cause senescence when overexpressed or expressed as oncogenic versions [3].
Recently, it has been shown that even loss of tumor suppressor genes can trigger senescence in mouse and human cells. This is the case of INK4A (Inhibitor of cyclin-dependent kinase 4A), NFR or ARF(alternative reading frame).
It has been established that cells underwent OIS, respond to oncogenic signalling trigger a DDR, which is associated with hyperproliferation and DNA hyper-replication [6, 18].
Although the mechanism that induced DDR in OIS is different from that of replicative senescence, effectors and primary pathways activated are the same [32]. In fact, cells underwent OIS are characterized by SAHFs formation, indeed OIS fails in cells lack ATM activity or when cells cannot sense DNA damage or transduce DDR signals to p53 [18]. Several experimental data have demonstrated that p53 and p16INK4A-pRB pathways are involved in OIS activation. The relative contribution of these pathways to OIS depends on cell type [6]. For example, in murine cells, inactivation of p53 or its upstream regulator, p19ARF , is sufficient to bypass H-Ras V12
induced senescence [38, 3]. Instead, in human cells p16 INK4A it seems to play a more prominent role than p53 in regulating OIS activation, in fact it has been shown that some cells depend solely on this pathway for OIS regulation[34] (Fig. 3).
Fig.3: In OIS, the activation of p53 is driven by stabilization through phosphorylation by DDR
and by ARF-mediated stabilization [6]
Although most of extant knowledge about OIS refers to in vitro experiments, some mouse models provide physiological evidence for OIS in vivo [6]. Taken together, these studies demonstrate that senescence is a primary response that is elicited to limit tumour progression, at least in tumour cells at early stage of tumorigenesis [6]. In 2005, four groups simultaneously reported evidences on the protective physiological role of OIS in vivo. This was shown for murine lung
adenomas, T-cell lymphomas, prostate tumors, as well as human benign melanocytic nevi [39-42] that are characterized by a low proliferative index and elevation of SA-β-Gal activity, as well as by the induction of some senescence markers. For example, nevi are benign melanocytic tumors that generally lack proliferative activity. They are commonly characterized by mutation in BRAF gene (generally BRAFV600E) [43], Michaloglou and collaborators showed that the cell cycle arrest of human nevi has hallmarks of OIS: nevi undergo long-term cell cycle arrest, express elevated level of p16 and display increased SA-β-Gal activity. These results indicate that OIS in nevi acts as a barrier to melanoma development [44, 45]
1.1.3 PTEN-Loss Induced Cellular Senescence (PICS)
A senescence response, recently characterized is PICS (Pten-loss Induced Senescence). PICS is rapidly induced after loss of PTEN, it is distinct from OIS on several dimension. In fact PICS is induced even in absence of DDR and does not follow an initial phase of DNA hyper-replication [46].
PICS can occur in cells that are treated with aphidicolin, a molecule that block S-phase entry and prevents DNA replication [46]. Instead, in H-RASV12 –induced senescence, aphidicolin treatment is responsible to abrogate senescence [18]. Furthermore, the SAHFs formation is not observed in PICS, in fact cells do not respond to loss of PTEN activating a DDR; and inhibition of ATM has not effect on PICS induction [46].
Similar to OIS, p53 have a primary role in PICS, but it was shown that p53 up-regulation is caused by mTOR-mediated translation [46,47]. Several experiments have demonstrated that ARF is not involved in p53 regulation in PICS, differently to what observed in OIS [46, 47, 48,49].
PTEN regulate PICS activation even due to its nuclear function. It has been shown that nuclear PTEN acts up-regulating INK4 through the regulation of ETS2 [50]. PTEN loss driver senescence from two perspectives:
1) through p53 up-regulation as result of mTOR hyper-activation;
2) through INK4A up-regulation as result of disassembly of the CDH1-containing anaphase-promoting complex (APC/CDH1) and accumulation of ETS2
As in the case of OIS, even PICS can have an important role in limiting the transformation of early lesions to malignant cancer, almost in prostate cancer [3]. (Fig.4)
Fig.4: Model of PICS; p53 regulation is mainly mediated by mTORC1. In addiction, the
ETS2-INK4A pathway is also required for senescence induction [6]
1.1.4 Stress-induced Senescence
Different type of stress can induce senescence. For example, in vitro senescence can result from inadequate culture conditions, such as abnormal concentration of nutrients and growth factors or the presence of ambient of O2 levels [10, 2].
Severe DNA damage, especially damage that creates DSBs, cause many cells to undergo senescence [51, 52]. Oxidative stress, citotoxic agent, chemioterapeutic drugs and ionizing radiation are responsible to induce senescence as a consequence of activation of DDR [52, 53]. Many chemotherapeutic drugs cause severe DNA damage, and then induce senescence in normal cells but also in tumor cells in vitro and in vivo [53].
Mouse models demonstrated that tumor cells with wild type p53 are more likely to senesce in response to chemotherapy than tumor cells with mutant p53, at least in cell culture and cancer-prone mouse models [54,55,56]. At the same time, exposure to ionizing radiation can induce senescence in normal cells and tumoral cells. Similarly, the exposure to ionixing radiation is able to activate a senescence process in normal cells as well in tumor [52, 53]. An important therapeutic implication that can derived by these observation is that DNA damage therapies, such as radiotherapy and chemotherapy, are more likely efficacious in tumours that can maintain the capacity to senescence, for example in tumor cells that not present mutations in p53 e p16INK4A-pRB pathways [53,54, 55, 56].
1.1.5 The regulators of cellular senescence: p53-p21 and p16INK4A-pRb pathways
Independently from the stimuli that induced senescence, p53-p21 and p16INK4A -pRB pathways are directly involved in establish the senescence growth arrest and
to regulate the appearance of the morphological modification typical of senescence cells [2].
These pathways interact but can independently halt cell-cycle progression. In fact, different stimuli can lead to activation of one or the other pathway. In addition the propensity with which cells engage p53-p21 or p16INK4A-pRB pathways is cell type and species-specific [2].
Finally, although most cells senesce owing engagement of p53-p21 or p16INK4A -pRB pathways, or both, there are examples of senescence that is independent of these pathways [24,57].
In general, stimuli that generate DNA damage or that activate DDR, induce senescence primarily through the p53 pathway.
p53 is regulated at multiple point, for example by MDM2, an E3-ubiquitin protein ligase which facilitates p53 degradation via proteasoma. Another p53 regulator is ARF, which inhibits MDM2 activity [58]. When activated, p53 induced the growth arrest through p21 expression. p21 is a cyclin-dependent kinase inhibitor which acts on cyclinE-A/Cdk2 complexes (Fig.4)
Fig.4: Nuclear and cytoplasmatic activity of p21
Stimuli that produce a DDR can also engage the p16INK4A-pRB pathway, but this usually occurs secondary to engagement of the p53 pathway [59,60].
Nonetheless, some senescence-inducing stimuli act primarily through the
oncogenic Ras induces p16 expression by activating ETS transcription factors [62].
The p16INK4A-pRB pathway is crucial for generating SAHFs, which silence the genes that are needed for cell proliferation [61]. SAHFs require several days to develop, during which time there are transient interactions among chromatin-modifying proteins such as HIRA (HIstone Repressor A), ASF1a (Anti-Silencing Function 1a) and HP1. Once established, SAHFs no require p16 or pRb for maintenance. Although SAHFs are not present in all senescence cells, the
p16INK4A-pRB pathway might establish chromatin states that are functionally
equivalent to SAHF [2].
Even p53-p21 pathway can be induced without the involvement of DDR, as demonstrated in PICS where p53 increase expression depends on mTOR-hyper-activation [46].
p16 and p21 are both cyclin-dependent kinase inhibitor (CDKIs) and are responsible to halt cell-cycle progression. p21 acts primarily as “universal” inhibitor of cyclin-Cdks complexes, instead p16 acts on cyclin D-Cdk4-6 complexes. p16 and p21 can keep pRb in an active, hypophosphorylated form. In proliferating cells, pRb is maintained in a hyperphosphorylated inactive form by cyclin-Cdk complexes, thereby pRb cannot inhibit the transcriptional factor E2F. The final effect of pRb inactivation is the transcription of genes which control cell proliferation.
1.1.6 Senescence in vivo
Much of the current knowledge on the causes and consequences of senescence derives from in vitro studies. Only during the past decade cellular senescence has been shown to occur in vivo [2]. In rodents, primates and humans, senescence cells are found in many renewable tissues, such as vasculature, haematopoietic system, many epithelial organs and the stroma [2,33, 63]
Cells that express senescence markers are relatively rare in young organisms, but their numbers increase with age. Senescence observed in age tissues is caused mainly by telomere dysfunction (replicative senescence).
Cells that express the typical markers of a senescent cells are found at sites of chronic age-related pathology, such as osteoarthritis and atherosclerosis [64,65].
In addition, senescent cells are associated with benign dysplastic or preneoplastic lesions [24,66,67,68] and benign prostatic hyperplasia [69] but not with malignant tumours. As previously discuss, senescent cells can be found in normal ad tumour tissues following DNA damaging chemiotherapy [53,54,55,56]. Taken together these results support the hypothesis that senescence suppress or limiting the development of cancer.
1.1.7 Senescence and tumorigenesis
Although initially the hypothesis that senescence could be correlated with tumorigenesis originated a lively debate, nowadays the idea that senescence is a powerful physiological mechanism, able to block tumour proliferation is quite well established. Several independent studies performed in human as well as in animal models, have supported the idea that senescence, as well as apoptosis, is an efficient mechanism that cells can used to suppress tumour proliferation [70]. The presence of senescent cells had been identified in animal models and in human, in close association with pre-malignant stages of tumorigenesis.
The original identification of senescent tumour cells was obtained from lung adenomas, pancreatic intraductal neoplasias and melanocytic nevi associated with the presence of oncogenic BRAFV600E, which are all pre-malignant tumours [15, 4]. Senescent cells have been found in hyperplastic lesions such as benign prostatic hyperplasia [69], and also in a familial cancer syndrome known as neurofibromatosis type 1, caused by loss-of-function mutations in NF1 tumour suppressor gene [71].
Taken together these data emphasize a close association between senescence and tumour, but it is important to underline that senescence is associated with tumours at pre-malignant stage of tumorigenesis, but not with malignant tumours [4]. As previously discuss, senescent cells are identified initially in pre-malignant tumours such as lung adenomas, pancreatic intraductal neoplasias and nevi melanocytic [68,66,39]. By contrast senescence was absent in their corresponding malignant stages, which are respectively lung adenocarcinomas, pancreatic ductal adenocarcinomas and melanomas [68,66,72]. The different behaviour observed in pre-malignant lesions compared to aggressive tumor is due to the fact that in most cases the differentiation towards a malignant phenotype is associated to an inhibition of p53 and p16 pathways.
It would however be incorrect to conclude that tumoral cells have lost their ability to senesce. It is possible to induce senescence also in malignant tumoral cells if correctly stimulated. Interestingly, in animal models, the induction of such a process in tumoral cell line can be effective from a therapeutic point of view. Initial studies conducted on humans have shown that senescence can be induce after treatment with chemotherapeutic drugs, and the result is regression of the malignant phenotype [2].
In the past few years, the concept of pro-senescence therapy has emerged as a novel theraputic approach to treat cancer [6]. To date, are in developing therapeutic strategies to activate senescence in tumour cells are under development.
These drugs can be subdivided in several categories [6]: 1) drugs that can enhance p53 activity and function;
2) drugs with the ability to modulate the cell cycle machinery, for example drugs which act on p27 and pRb;
3) drugs that target oncogene or tumour suppressor genes;
4) telomerase inhibitors for the induction of replicative senescence .
Each of these strategies is developed in order to be used alone for senescence induction and cancer treatment. However, the idea of using pro-senescence strategies in combination with traditional treatment protocols (for example chemotherapy and radiotherapy) is emerging, with the aim of combining the positive effect of single treatment and then to improve the effectiveness of treatment. Such an idea emerged from experiment conducted in mouse model affected by lymphomas.
Mouse model of chemotherapy have shown that MYC-initiated lymphomas respond to ciclophosphamide by inducing tumour cell senescence, but the most interesting data is that, activation of senescence correlated with a better prognosis following chemiotehrapy [55]. These experimental evidences suggest that senescence can improve the effectiveness of chemotherapeutic treatment [2]. Of note, two reports analysing senescence markers in biopsies from patients with lung or breast cancer after neoadjuvant chemotherapy have observed chemotherapy-induced senescence and its association with treatment success
[54,56]. More recently, the analysis of biopsy material from patients with prostate cancer has shown that chemotherapy induces marker of senescence [30].
Although are actually in developing several strategies to induce the activation of senescence, it must bear in mind the potential problems that might arise from senescence-induced therapies. One of the most important problems is that, cancer cells in a senescence-like state might remain as „dormant‟ tumour cells and therefore represent a dangerous potential for tumour relapses [2].
For this reason, the therapeutical protocols based on the use of molecules that induce senescence might induce at the same times the activation of processes which are responsible to eliminate senescence cells.
Senescent cells can secrete molecules and factors, such as IL-6 and IL-8, which are responsible to recruit immune cells (such as neutrophils, macrophages and natural killer cells) to sites of senescence and to clearance it [73]. Thus, these data suggest to promoting immune cell function, while also engaging a pro-senescence response, may prove to be beneficial for the clearance of senescence cells and may result in tumour regression. In virtù del ruolo svolto dalle cellule del sistema immunitario, è chiaro che potenziarne l‟azione è sicuramente di fondamentale importanza nel potenziare il fenomeno della regressione tumorale.
SASP component, such as interleukin, might then have an important role in sustaining senescence activation and tumour clearance, but it is important to bear in mind that some SASP molecules might also stimulate the malignant phenotype of nearby tumour cells [30].
Before introducing the use of induced senescence for therapeutic purposes, it will be therefore necessary to complete studies considering also the side effects that are generated by such a process.
1.2. mTOR
mTOR (mammalian target of rapamycin) is a serine/threonine kinase which regulates protein synthesis, cell growth and proliferation in response to pleiotropic inputs including growth factors, nutrients, stress and energy [74].
It was identified in the yeast Saccharomyces Cerevisiae during a screen for resistance to the immunosuppressant drug rapamycin [75, 76].
mTOR is a member of the phosphoinositide 3-kinase (PIKK) family, whose catalytic domain has omology to that of PI3Ks [77].
Unlike PI3K family member which phosphorylate lipids, the PIKK (ATM; ATR, DNA-PKcs, mTOR, SMG1 e TRRAP) act as serine/threonine kinases [78].
mTOR is a central signalling molecule, than it is implicated in various syndrome and hamartoma syndromes [79]. There are several hamartoma syndromes which are caused by mutations or deregulation of mTOR pathway, such as TSC1-TSC2 (Tuberous Sclerosis Complex )[81, 82], NF1 (Neurofibromatosis Type I) [82], LKB1 (Peutz-Jeghers Syndrome ) [84], PTEN (Cowden disease) [84,85] e FLCN (Birt-Hogg-Dubé sindrome) [86-88].
mTOR is a high molecular weight proteins (280Kda) that contains several structural domains. The N-terminus posses 20 HEAT repeats that are implicated in protein-protein interactions. The C-terminus contains the kinase domain, which has sequence similarity with PI3K. Upstream to the catalytic domain are present the FRB domain responsible to the interaction with rapamycin. Furthermore, upstream to FRB domain there is the FAT domain, typical of PIKK kinases. Finally in the C-terminus region is present the FATC domain, that is necessary for mTOR activity, in fact deletion or even single base mutations abrogates the activity of mTOR [89].
In mamamlial mTOR formed two distinct complexes, called respectively mTORC1 and mTORC2 (Fig. 5).
Fig.5: Domain organization of mTOR and mTORc proteins [90]
mTORC1 is a rapamycin-sensible complex. Rapamycin was originally isolated from the bacterium Streptomyces Hygroscopicus, inhibits proliferation of mammalial cells and possess immunosuppressive properties [74]. Rapamycin in
cells binds the protein FKBP12 (FK506-binfìding protein), then the complex rapamycin-FKBP12 binds and inhibits raptor-bind to mTOR, instead do not have effect on rictor [91]. Prolonged treatment with rapamycin can inhibits mTORC2 in some tissues and cell lines. This effect may be due to the sequestration of the pool of mTOR in the complex rapamycin-FKBP12 [92].
The subunits that composed mTORC1 are: mTOR, RAPTOR (Regulatory associated protein of mTOR), PRAS40, GβLe DEPTOR. RAPTOR acts as an adaptator subunit and is important to recruit substrates to mTOR, PRAS40 e DEPTOR are negative regulators of mTORC1 complex, instead GβL is a positive regulator of the complex [74,90].
mTORC2 complex is composed by the following subunits, some of which are common to mTORC1: mTOR, RICTOR, PROTOR, DEPTOR, GβL e mSIN1. RICTOR, as well as RAPTOR, acts as a scaffold; PROTOR regulates complex assembly, instead mSIN1 target mTORC2 to membranes [90].
mTORC1 and mTORC2 are responsible to regulate different processes: mTORC1 is responsible to regulate protein synthesis, proliferation and cellular growth. mTORC2 regulates proliferation and actin reorganization [90].
mTORC1 promotes cell growth through phosphorylation of various regulators of translation, including the well-characterized ribosomal S6K1, which activates the S6 ribosomal protein (S6), and the eukaryotic translation initiation factor 4E-binding protein1 (4EBP1), which leads to its uncoupling from the elongation initiation factorE (eiF4e) [74].
S6K1 and 4EBP1 associate with mRNAs and regulate mRNA translation initiation and progression, thus controlling the rate of protein synthesis.
Unphosphorylated 4E-BP1 suppresses mRNA translation: however when phosphorylated by mTORC1, 4E-BP1 dissociates from eIF4E allowing eIF4E to recruit the translation initiation factor eIF4G to the 5‟ end of most mRNAs [90]. When phosphorylated by mTORC1 S6K1 promotes mRNA translation by phosphorylating or binding multiple proteins, including eukaryotic elongation factor 2 kinase (eIF2K), S6K1 Aly/REF-like target (SKAR), 80kDa nuclear cap-binding protein (CBP80) and eIF4B, which collectively affect translation initiation and elongation [90]. eIF4B is responsible to enhances the activity of eIF4A, an RNA helicase that unwind the structured 5‟UTR of many mRNAs [90].
Moreover, studies in yeast S.Cerevisae demonstrated that mTORC1 suppress autophagy [93,94].
Recently, several experimental data have demonstrated that mTORC1 is involved in the regulation of cellular senescence. In a recent report, the persistent expression of Wnt proteins in mouse epiderms led to hyperproliferation of epithelial stem cells, ultimately causing them to undergo senescence. These action seemed to occur through Wnt-mediated activation of mTOR pathway [95].
The involvement of mTOR in the regulation of cellular senescence it has been shown even in PICS; where it was shown that p53 up-regulation is caused by mTOR-mediated translation consequent to the loss of PTEN [46,47].
Recently it has been shown in fibroblast that PI3K/AKT pathway activation in response to PTEN knockdown, mutant PI3K or activated AKT expression, induces cellular senescence. It was demonstrated that AKT-induced senescence senescence is p53-dependent, and that mTORC1 have a pivotal role in regulation p53 translation and stabilization of p53 protein following nucleolar localisation and inactivation of MDM2 [96].
mTORC1 acts as a signal integrator for four major regulatory inputs: growth factors, nutrients, energy and stress [90].
mTOR responds to growth factors via the PI3K/AKT pathway [74, 90]. Binding of insuline to its receptor activates the PI3K pathway, which converts PIP2 (phosphatidiylinositol-4,5-phosphate) in PIP3. PIP3 accumulation is antagonized by the tumor suppressor gene PTEN. PIP3 recruits PDK1 and AKT to the membrane, resulting in the phosphorylation and activation of AKT by PDK1. When AKT is activated, phosphorylates and inactivates TSC1 and TSC2 and, consequently, activates mTORC1 [97-99]. In fact, TSC1 and TSC2 form a complex which have been shown to negatively regulate mTORC1 [105]. TSC2 was shown to have a GTPase activating protein (GAP) activity towards the Rheb (ras-homolog enriched in brain) GTPase; this event stimulates the intrinsic GTP hydrolysis activity of Rheb to promote its transition from an active GTP-bound form to an inactive GDP-bound form [100].
Conversely inactivation of TSC1/TSC2 by AKT phosphorylation lead to GTP binding and Rheb activation which ultimately promotes the activation of mTORC1.
AKT also phosphorylates PRAS40 a component of mTORC1, which causes it to bind to 14-3-3 proteins and prevents it from inhibiting mTORC1 [101].
mTORC1 senses also cellular energy [90]. The mTORC1 pathway indirectly senses low ATP by a mechanism that involved the AMPK kinase. Both AMP and ATP are allosteric regulators of AMPK, when the AMP:ATP ratio increases, AMPK phosphorylates TSC2, therefore the GAP activity of TSC1-TSC2 towards Rheb is stimulating, and the mTORC1 signaling is inhibited [90]. Moreover AMPK phosphorylates Raptor, causing it to bind to 14-3-3 proteins, which lead to mTORC1 inhibition [101]. Other stressor that not primarly impinge on cellular energy can inhibit mTORC1 through the involvement of AMPK. For example, DNA damage result in inhibition of mTORC1 activity through the p53-dependent upregulation of AMPK [102, 103]. Sestrin1 and 2 are two transcriptional targets of p53 that are impliocated in the DNA damage response, and it was recently shown that sestrin potently activate AMPK, thus mediating the p53-dependent suppression of mTOR activity upon DNA damage [104]
1.3 MITOCHONDRIA
Mitochondria are cytoplasmic organell present in every eukaryotic cells, animal or vegetal with an aerobic metabolism. Mitochondria are the main producers of energy in a cell [106, 107], but they are involved in other metabolic processes, such as Krebs cycle, pyruvate and fatty acid oxidation, nitrogen metabolism and heme metabolism [108, 109]. Moreover, mitochondria are involved in calcium homeostasis maintenance, production and regulation of reactive oxygen species (ROS) and in the regulation of apoptosis [106, 107, 108]. Mitochondria are endowed with a two-membrane system in which the outer and the inner membrane differ in lipoprotein content and permeability and thus create two separate sub-compartments; the intermembrane space and the inner matrix, each hosting different metabolic reactions and molecular processes. The outer mitochondrial membrane is more permeable, mainly due to the voltage dependent anion channel (VDAC) known as porin [110], while the inner membrane is almost completely impermeable, particularly for protons, which allows the formation of the proton gradient crucial for the mitochondrial energy production. The low permeability of inner membrane is attributed to the absence of porin and to the
elevate presence of cardiolipin, a phospholipid which modulates the activities of some respiratory chain enzyme [111].
The surface of the inner membrane folds into tubular formations called christae (Fig.6) which protrude in the matrix and increasing the surface of energy production. In the christae are located almost all the protein that constitute the electron transport chain.
Fig.6: Mitochondrial structure [112]
Mitochondria are the main producers of energy in a cell; through the process called oxidative phosphorylation, protein complexes of the electron transport chain (CI, CII, CIII and CIV) and ATP synthase (CV), situated in the inner mitochondrial membrane, utilize hydrogen to reduce oxygen into water and generate ATP (Fig. 7).
Fig.7: Protein subunits of the five respiratory complexes encoded by nuclear and mitochondrial
genes. [109]
1.3.1 Mitochondrial genome
Mitochondria are unique among eukaryotic organelles in that they contain their own genetic system. Only a small number of genes necessary to account for the molecular architecture and biological function of the organelle are present in mtDNA. Because of this limited coding capacity, mitochondrial are genetically semi-autonumous, in fact they rely on the expression of nuclear genes for all of their biological function [109]. For example, the majority of subunits that comprise the complexes of electron transport chain, and the enzyme involved in replication and transcription are nucleus encoded.
Human mtDNA is a double-stranded molecules that consists of 16569 bp 113,114,115] is located in mitochondrial matrix and carries genes encoding for 13 subunits of electron transport chain complexes, as well as 2 rRNAs and 22 tRNAs (Fig. 8).
mtDNA has some characterists that are different from those of the nuclear genome (nDNA). The genetic information of mtDNA is extremely compacted, mitochondrial genes lack introns and there are little or no intergenic regions. Some respiratory protein genes overlap and finally, another characteristic of mtDNA is the use of mitochondria specific codons, which differ from the universal genetic code [116].
Although mitochondria do not contain introns, recent discoveries showed that mtDNA is actually protein-coated and packed in aggregates called mitochondrial nucleoids, together with the machinery necessary for its replication and transcription [117, 118] such as POLG (mtDNA polymerase gamma) or TFAM (mitochondrial transcription factor) to which a role in mtDNA packaging and organization has recently been assigned [118-120].
The only non coding regions in mtDNA is the D-loop (displacement loop), a control region which contains replication and transcription factor binding sites. Mitochondrial genome is inherited maternally, in fact only mitochondria from the oocyte contribute to gamete development, while sperm mtDNA tends to be eliminated via proteosoma after fertilization through their ubiquitination in spermatogonia [121-123].
Mammalial cell generally have many mitochondria, each of them carries several (2-10) mtDNA molecules [124], that are not always genetically uniform. The coexistence of both mutated and wild type mtDNA in a cell is a condition called heteroplasmia. On the other hand, homoplasmy is a condition typical of a cell that present only one mtDNA genotype [124]. A direct consequence of polyploidia and heteroplasmy is the threshold effect. The phenotypic effect of a mtDNA mutation depends on the percentage of its mutant load. The portion of mutated molecules needs to be reached before the functional consequences of a mtDNA mutation begin to arise, depending on the type of the mutation and on the tissue in which it occurred. In fact, tissue that have an elevated oxidative metabolism, such as brain, skeletale muscle and heart, have a low threshold with respect to other tissue.
1.3.2 Mitochondrial biogenesis
The energetic demands can vary substantially between different cell types and in different physiological situations requiring an adaptation in mitochondrial
biogenesis, which is a complex phenomenon that needs the participation and coordination of nuclear and mitochondrial genomes [109]. Many activators and coactivators are involved in the coordinated upregulation of nuclear and mitochondrial genes that are necessary for an efficient mitochondrial biogenesis (for example nuclear genes encoding respiratory subunits, mitochondrial transcription and replication factors, heme biosynthetic enzymes, protein import machinery).
Physiological signals may activate specific transcription factors through different pathways and this can result in an activation of genes required for mitochondrial biogenesis and respiratory function. The nuclear transcriptional factors involved in regulating mitochondrial biogenesis are: Nuclear Respiratory Factors 1 and 2 (NRF-1 and NRF-2), YY1 and CREB. They act on the majority of nuclear genes encoding subunits of the respiratory chain complexes [109], and are also involved in the expression of mitochondrial transcription and replication factors (TFAM, TFB1M and TFB2M), heme biosynthetic enzymes and other proteins required for respiratory function [125, 127].
In addition to these transcription factors, mitochondrial biogenesis is controlled by transcriptional coactivators, such as PGC-1α (PPARγ coactivator-1), PGC-1β and PRC, which interact with other transcription factors and coactivators [126]. PGC-1α is the main regulator of mitochondrial biogenesis in mammalial cells. It was identified in brown fat tissue (BAT), through its interaction with PPARγ (Peroxisome Proliferators-Activated Receptor γ), a regulator of adipocyte differentiation [109]. It is expressed at high levels in tissues where mitochondria are abundant, such as brown adipose tissue (BAT), heart and skeletal muscle. Instead, the expression level is low in tissues such as liver and white adipose tissue [131].
PGC-1α can induce mitochondrial biogenesis by interaction with several transcription factors, such as NRF-1, NRF-2, ERRα and YY1 [109].
Recently it was shown that AMPK kinase, a key regulator of cellular energy homeostasis, is the mainly regulator of mitochondrial biogenesis upon energy depletion through inhibition of PGC-1α activity[129, 130]. In condition of energy depletion, AMPK is activated and is responsible to phosphorylates PGC-1α on specific serine and threonine residues. This results in increased mitochondrial
gene expression and activation of ATP production; instead all the molecular pathways that use ATP are inhibited.
More recently, it has been demonstrated that PGC-1α gene expression is regulated by mTORC1 [132]. In skeletal muscle it has been demonstrated that pharmacological inhibition of mTORC1 is responsible to decreased PGC-1α expression and of some of its interactors such as NRF-1, NRF-2 and ERR-α. The result is a decrease in mitochondrial biogenesis, even as proteins expression than in terms of oxygen consumption [132]. It has also been demonstrated that mTORC1 and PGC-1α interact with YY1 (Ying-Yang 1), which seems directly bind mitochondrial gene promoters. mTORC1 were shown to directly interact with YY1 and PGC-1α, and mTORC1 was demonstrated to regulate the transcriptional function of YY1-PGC-1α by altering their physical interaction [132].
In another study it has been demonstrated that mTOR and raptor can be purified in mitochondrial fraction; moreover pharmacological inhibition of mTORC1 through rapamycin, resulted in a marked alteration of mitochondrial transcriptoma [133].
1.3.3 Oncocytic tumors: a model to study mitochondrial dysfunction
Oncocytic tumors are an interesting model to study the effect of mitochondrial dysfunction on cancer development. Oncocytic tumors may arise in different types of tissues, most often in those of epithelial origin such as thyroid, kidney or pituitary gland [134].
They are characterized by an aberrant mitochondrial hyperplasia, that is responsible for their “swollen” appearance [135]. This feature can be appreciated through ultrastructural analysis, which displays cells packed with enlarged globular or ovate mitochondria with a stack of lamelliform, tubular or flat cristae and occupying up to 60% of the cytoplasm [134, 136, 137].
The majority of oncocytic neoplasms is considered benign and display low-proliferating, non-invasive behaviour [134, 135, 138-144]. Moreover, a strong association between complex I disruption and HIF-1 α (Hypoxia inducible factor 1) destabilization has been shown. The mitochondrial mutation lead to an increase of α-chetoglutarate/succinate ratio, which may be responsible for a higher affinity/activity of the prolyl hydroxylase (PHD) responsible to mediate HIF-1α
degradation. Such metabolic switch was suggested to explain why onocytic tumors might excape malignancy [144].
The mitochondrial hyperplasia is caused by a compensatory effect as a consequence of a respiratory dysfunction triggered in presence of a retrograde signalling from the organelles to the nucleus [135]. This stress response can be activated in response to several kinds of stimuli, such as loss of mitochondrial function caused by collapse of electrochemical potential , impaired respiratory chain activity or by the accumulation of unfolded proteins in the organelle [135]. Several studies have investigated the increase in mitochondrial biogenesis in oncocytic tumors as well as in the only existing oncocytic model, the XTC.UC1 cell line [135]. The group of Prof. Romeo fully characterized the bioenergetic competence of XTC.UC1. It has been shown that the energetic impairment is due to a decrease in both complex I and complex III activity due to the presence of mtDNA mutations respectively in ND1 and cytocrome b [142]. A similar decrease in complex I subunits content was reported in a case of a rare nasopharynx oncocytoma, along with a mtDNA copy number ncrease [140]. Instead, decrease in activity of complex I and IV was reported in vivo in a peculiar case of Warthin tumor [144].
All these data point at a dysfunction at least in respiratory complex I as the main trigger for the subsequent increase in other mitochondrial proteins and, hence, for the compensatory effect in oncocytic cells [135].
However how mtDNA mutations contributes to oncocytic development is not so clear. It is worth noting that the mtDNA mutations underlying the oncocytic phenotype may not be the primary hit in tumorigenesis as previously discuss [141]. The hypothesis of the active contribution of the mtDNA mutation to the oncocytic transformation fits well with the model of the compensatory effect. In fact, based on this model, the mtDNA mutation may cause the respiratory dysfunction which triggers a retrograde signalking to the nucleus resulting in mitochondrial biogenesis [135].
1.4 COWDEN SYNDROME AND PTEN
Cowden Syndrome (CS) belongs to the family of the PTEN hamartoma tumor syndromes (PHTS) that also includes Bannayan-Riley-Ruvalcaba syndrome (BRRS), Proteus syndrome (PS) and Proteus like syndrome [145].
CS is a highly variable, autosomal-dominant hereditary cancer susceptibility syndrome. The patients affected by CS developed multiple hamartomas, unusual skin and facial findings, abnormal CNS findings and increased risk of malignancies.
Mutations in the tumor suppressor gene PTEN (Phosphatase and Tensin homologue on chromosome 10) are the cause of CS [146].
The majority of mutations occur in exon 5, but mutations in the other exons, except for the first, have also been reported. CS patients are characterized by germ-line mutations of PTEN including nonsense, frameshift, splice site, missense mutations, as well as deletion/insertion of one or more exons all leading to monoallelic loss of function.
PTEN is a “haplo-insufficient” tumor suppressor gene, which is particularly sensitive to dosage. Generally, tumor suppressor genes must be fully inactivated to participate in tumor initiation and progression, as explained by Knudson‟s “two-hit Hypothesis”. It has been shown in some cases, that many deleted regions in a tumor or in patients are not accompanied by mutations or deletion of the other allele. This suggests that these deletions could be passenger events, not implied in tumorigenesis. The alternative explanation is that the deleted region includes tumor suppressor genes for which the loss of one single copy has a role in tumorigenesis. Another hypothesis is that the single mutation acts as a dominant negative towards the other allele resulting in loss of both copies function, mimicking the effect of homozygous or, third hypothesis, both copies of the gene are necessary to maintain its function. In this case a single-copy loss of function mutation may be sufficient to cause the phenotype.
PTEN dosage-dependence was first demonstrated in mice [183] in which loss of one allele of PTEN has been shown to promote the progression of a lethal polyclonal autoimmune disorder with high penetrance. These findings suggested that a residual wild type allele is not enough to sustain normal function. Similarly PTEN heterozygosity appeared to promote epithelial cancers, such as prostate cancer, in mouse model of PTEN loss [184].
1.4.1 PTEN: Structure and functions.
The PTEN (Phosphatase and tensin homologue deleted in chromosome 10) tumor-suppressor gene is located on chromosome 10q23.3, a genomic region that suffers
loss of heterozygosisty (LOH) in many human cancers [147]. Somatic deletion or mutations of this gene have been identified in a large fraction of tumors, including glioblastomas, endometrial and advanced prostate cancer, thus placing PTEN among the most commonly mutated genes in human cancer [148].
PTEN encodes for a dual protein/ lipid phosphatase. There are two major domains of PTEN, the N-terminal phosphatase domain and the C-terminal domain. Tumor suppressor function requires both the phosphatase domain and the C2 or lipid membrane binding domain. The PZD domain is responsible to the interaction with other proteins, instead the PEST domain may contribute to protein stability (Fig. 9).
Fig. 9: PTEN domains structure
PTEN primary target is the phosphatydil-inositol 3,4,5 triphosphate (PPI3) which is the direct product of the phosphatidylinositol 3-kinase (PI3K). Loss of PTEN function, either in murine embryonic stem cells or in human cancer cell lines, results in accumulation of PIP3 mimicking the effect of PI3K activation and triggering the activation of its downstream effectors, PDK1, AKT/PKB and Rac1/cdc42. Activated PDK1 phosphorylates AKT at Thr308 activating its serine-threonine kinase activity.
Once phosphorylated in Thr308, further activation occurs by PDK2 (mTORC2 or DNA-PK) by phosphorylation at Ser473. AKT activation stimulates cell cycle progression, survival, metabolism and migration through phosphorylation of many physiological substrates [150].
PTEN therefore negatively regulates the AKT pathway leading to decreased phosphorylation of AKT substrates such as TSC2 and PRAS40 that control mTOR activity, p27, p21, glycone synthase kinase 3 (GSK3A), BCL-2-associated agonist cell death (BAD), apoptosis signal regulating kinase 1 (MPK3K5), WT1 regulator PAWR (also known as PAR 4) and CHK1, as well as members of the fork-head transcription factor family (for example FOXO1, FOXO3 and FOXO4) and others.
Changes in phosphorylation alter the activity and/or localization of these proteins, which in turn affects processes such as cell cycle progression, metabolism, migration, apoptosis, transcription and translation (Fig.10).
Fig.10: The PTEN-PI3K Pathway.
PTEN phosphatase also targets different proteins, including proteins that regulate cell migration and invasion, such as p130 and FAK, and pathways that control proliferation and differentiation, such as MAPK.
It has recently demonstrated that PTEN have a nuclear function [151,152]. It is important to notice that PTEN does not contain typical nuclear localization signals (NLS) or nuclear export motifs (NES). Several mechanisms for the nucleus-cytoplasmic shuttling of PTEN have been postulated, including simple diffusion; export dependent on a putative cytoplasmic localization signal, active shuttling by
the RAN-GTPase or major vault protein (MVP), phosphorylation dependent shuttling and monoubiquitylation-dependent import [151].
It has been shown that nuclear PTEN acts to maintain chromosomal stability [152]. The binding of PTEN to centromere protein C1 (CENP-C1) is required for centromere stability, and its nuclear localization is required for DNA double-strand breaks (DBS) repair that is mediated by DNA repair protein RAD51. PTEN also regulates the tumor suppressor function of anaphase-promoting complex (APC) and of its regulator E-cadherin, in the nucleus, independently of its lipid phosphatase activity. Altered APC-CDH1 activity has been implicated in multiple tumor types.
Furthermore in vitro studies demonstrated that nuclear PTEN induces G0-G1 arrest since cells expressing wild type PTEN protein exhibit a slower growth rate and higher G1:S ratio than cells expressing the nuclear-localization-defective mutant. This increase in the number of cells in G0-G1 is probably a direct result of down regulation of cyclin D1 by nuclear PTEN. It might lead to decreased tumor growth, explaining another aspect of PTEN tumor-suppressor function [50].
1.5 BIRT-HOGG-DUBE’ SYNDROME AND FLCN
Birt-Hogg-Dube syndrome (BHD) is an autosomal dominant condition, caused by germline mutations in the FLCN (folliculin) gene. Patients affected by this syndrome are characterised by skin fibrofolliculomas, multiple lung cysts, spontaneous pneumothorax, and renal cancer [153].
1.5.1 FLCN: structure and functions
FLCN is located on chromosome 17p11.2; and it consists of 14 exons [153]. The majority of mutations, identified in FLCN sequence, were predicted to introduce a premature stop codon into FLCN and therefore to result in protein truncation [154]. This includes the “hot spot” for insertions/deletions in exon 11. It is unclear whether the truncated FLCN is targeted for degradation or remains in the cell with an altered function
Somatic mutations in the remaining wild type allele of FLCN or loss of heterozygosity on chromosome 17p11.2 have been identified in BHD-associated renal tumors, supporting Knudson “two-hit” hypothesis and a tumor suppressor
role for FLCN [80]. However there is evidence that FLCN does not behave as typical tumor suppressor protein.
In a study of five BHD patients [81] the authors found no evidence of somatic mutations and loss of heterozigosity in fibrofolliculomas suggesting that haploinsufficiency is enough to cause benign tumor growth in the skin.
FLCN consisting of a short hydrophobic terminal sequence, one N-glycosylation site, three myristoylation sites and a glutamic-acid rich coiled coil domain centrally located in the protein [154].
Two interacting proteins have been described: FNIP1 and FNIP2. FLCN-binding protein 1 (FNIP1) was identified in 2006 [155] as an evolutionary conserved protein that interacts with and phosphorylates FLCN.
FNIP1 also binds AMPK, which is a negative regulator of mTOR and a key protein for energy sensing in cells [155,156] demonstrated that both FLCN and FNIP1 are phosphorylated by AMPK. This interaction between FNIP1 and FLCN was also shown to be modified by external influences, since treatment with an AMPK inhibitor (compound C), rapamycin or amino acid starvation affected the phosphorylation status of FLCN, further indicating a role for FLCN in energy sensing and the mTOR pathway.
FNIP2, is a second FLCN-binding protein and it is homologous to FNIP1 (49% identity, 74% similarity). As with FNIP1, it is conserved across species and binds AMPK [157,158] in vitro kinase assays also suggest that FNIP2 is phosphorylated by AMPK [158]. FNIP1 and FNIP2 are able to form homo- and heterodimers, as well as multimers [158] suggesting a functional association between these two proteins.
Further research has shown that Ser 62 is a phosphorylation site in FLCN, this work also suggests that ser62 phosphorylation is indirectly up-regulated by AMPK [159]. FLCN also appears to be phosphorylated at Ser302 by unknown kinases downstream of mTORC1 [160]. Since mTORC1 is known to be indirectly down-regulated by AMPK, this process could be associated with an unknown feedback mechanism that regulates mTOR signaling.
The molecular functions of FLCN are poorly understood, but it is known that FLCN and AMPK interaction, as mediated by FNIP1 and FNIP2, is involved in mTOR signaling [155].
Nevertheless the functional role of FLCN in mTOR signaling is undetermined, since several recent publications have reported contradictory effects on an indicator of mTOR activation (known as phosphorylated ribosomal protein S6 / p-S6R) when FLCN expression is reduced. Two studies recently reported that transient downregulation of FLCN by siRNA in human cell lines results in reduction of phosphorylation of p-S6R [158, 161]. Reduction of p-S6R was also observed in renal cysts developing in mice heterozygous for FLCN [162]. In contrast, kidney-specific homozygous knockout of FLCN resulted in an increase in phosphorylated p-S6R, which contributed to the development of polycystic kidneys [163].
Recent research has also indicated a role for FLCN in other signaling systems and cellular processes (Fig.11).
Fig.11: FLCN pathway and interactors.
Other cellular pathways seem to be controlled by FLCN function; using a RCC cell line derived from a BHD patient [164] demonstrated that FLCN also influences 1α signaling. The authors suggested that a high level of HIF-mediated expression in these FLCN-null cells alters cell metabolism through elevated levels of metabolic enzymes. This altered metabolic state parallels a phenomenon known as the Warburg effect, which is commonly seen in cancerous cells [165] postulated that cancer should in fact be interpreted as a mitochondrial disease, and further work [166] suggests that the loss of FLCN in BHD syndrome results in mitochondrial dysfunction, as indicated by a high level of mitochondrial gene expression.
2.MATERIALS AND METHODS
Cell lines
The following cell line was utilized for the study:
- RPE1: ephitelial cell line derived from human retina with non-rearranged cariotype
- XTC.UC1 (Thyroid Oncocytoma Cell Line): cell line derived from an oncocytic thyroid tumor [Zielke A et al., 1998].
- HCT116: human cell line derived from a colon-rectal tumor
- HEK293: an immortalized cell line derived from human embryonic kidney - HPS11: ci-hybrid cell line derived from the fusion of fibroblast enucleated from a health patient and, as cytoplasmic donors the 143B TK- deprived of their mtDNA (Rho0) [G.Attardi e M.King, 1989]
RPE1 and XTC.UC1 were cultured in DF12 medium (Dulbecco‟s modified eagle‟s medium/nutrient mixture F-12 ham (Sigma)) supplemented with 10% fetal bovine serum (FBS) and 1% penicillin G-streptomycin.
HCT116, HEK293 and HPS11 were cultured in DMEM (Dulbecco’s Modified Eagle Medium) supplemented with 10% FBS, 1% penicillin G-streptomycina and 1% L-glutammine.
Cells were maintained in 5% C02 at 37°C
γ-rays treatment
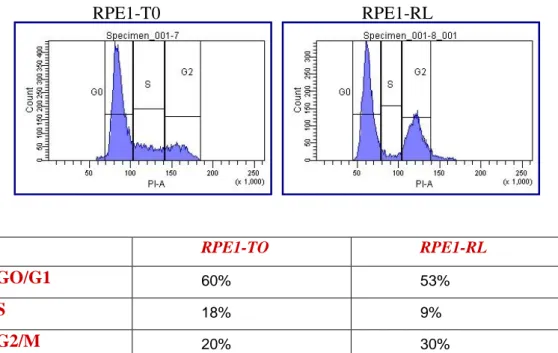
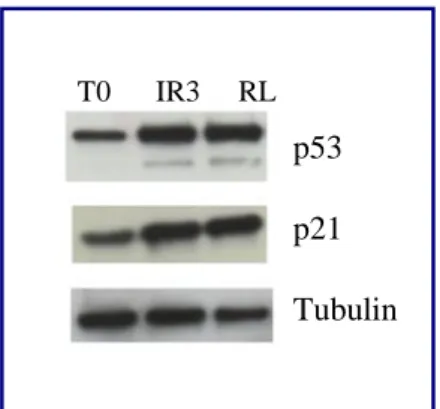
For γ-rays treatment is followed a standard protocol, previously optimized in our laboratory. The biological irradiator IBL437C (89-294) is used for the treatment. Cell are growth in T25 flaks, and the treatment is started the day after the seeding. Each cell lines is irradiated at 4Gy for 3/4 days as indicated in Table 1.
RPE1
T0 Untreated control
RL 4 doses of 4 Gy and 120 hours of recovery
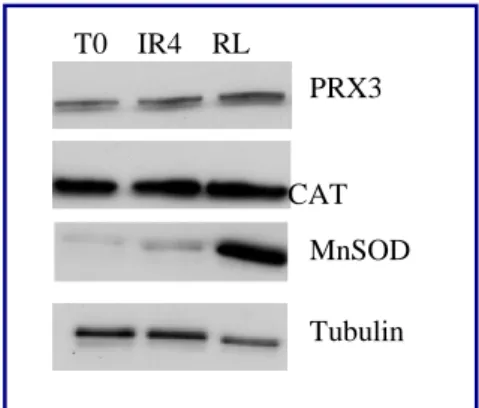
XTC.UC1
T0 Untreated control
IR4 4 doses of 4 Gy
RL 4 doses of 4 Gy and 120 hours of recovery
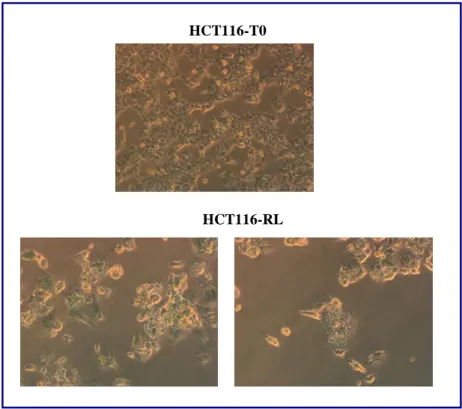
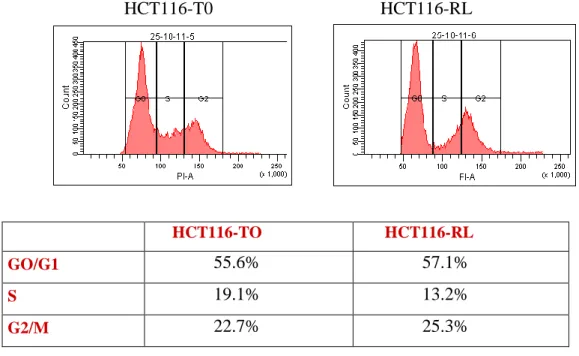
HCT116
T0 Untreated control
IR3 3 doses of 4 Gy
RL 3 doses of 4 Gy and 120 hours of recovery
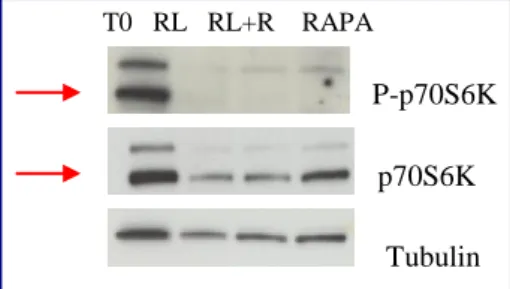
Rapamycin treatment
Cells are treated with rapamycin (Cell Signaling), a specific inhibitor of mTORC1 complex. Rapamycin is a bacterial macrolide with antifungal and immunosuppressive activity. Rapamycin forms a complex with the immuniphilin FKBP12 which then inhibits the activity of mTORC1. The treatment leads to the desphosphorylation and inactivation of p70S6K kinase.
Cells are seeded in T25 cm2 flasks, the day after the culture medium was replaced with medium containing rapamycin 10nM (optimal dose that induces dephosphorylation of p70S6K).
For each cell lines a flask was subjected to a combined treatment rapamycin+radiation. The time and doses of irradiation are the same indicated in table 1. After the last dose of radiation, the medium is substituted with fresh medium containing rapamycin. After 120h of recovery the cells are utilized for the successive analysis.
SA-β-Gal assay
The marker that is commonly used to identify senescent cells is Senescence-Associated galactosidase activity (SA-βgal) [26]. In normal cells, β-galactosidase, a lysosomal enzyme, is active at pH 4; instead senescent cells are characterized by an increase activity of this enzyme. Consequently, the β-galactosidase activity can be measured also at suboptimal pH6.
For the assay, cells are seeded in T25 cm2 flasks, washed twice with PBS and then incubated with a fixing solution for 7‟ at RT. This solution contains:
- Glutaraldeide 2% - Formaldeid 0.2% - PBS
Then the flasks are washed five times with PBS and then incubated with a staining solution. The staining solution contains:
- Citric acid+Sodium Phosphate Buffer 40mM at pH 6 - K4[Fe(CN)6]x3H2O 5mM - K3[Fe(CN)6] 5mM - NaCl 150mM - MgCl2 1mM - X-Gal 1mg/ml - H2O
The flasks are incubated at 37°C (without CO2) and protected from light.
The day after the staining solution is eliminated and the flasks washed twice with PBS and then microphotographeted.
Flow cytometry
In order to confirm the proliferative arrest induced in a senescent cell, the distribution of cells in the different phases of cell cycle was analized.
The protocol derive from the original Nusse protocol (Nusse, M., et al “Flow citometric analysis of G1- and G2/M phase subpopulations in mammalial cell nuclei using side scatter and DNA contenent measurements” . Cytometry 11: 813-821 (1990)).
Cells are seeded at low confluence and subjected to γ-rays treatment as indicated in table 1.
At the end of the treatment, cells are first pelletted at 1500rpm for 10‟, then are resuspended with Nusse 1 Solution at a final concentration of 2x10⁶ cells/mL. The Nusse 1 Solution contains:
- NaCl 584mg/L
- Trisodic Citrate 1139 mg/L - RNAsi 10mg/L
- Nonidet P40 300 μg/L - H2O
Cells are incubated for 30‟/1h in ice. Then is added Nusse 2 Solution (same volume of Nusse 1 Solution) to reach a final concentration of 1x10⁶cells/mL. The solution is vortexed and the sample is transferred in a cytoflurimetric tube and incubated with Propidium Iodide (50μg/mL) for 15‟ and then analysed with a flow cytometer (BD-FACSAria).