Alma Mater Studiorum – Università di Bologna
DOTTORATO DI RICERCA IN
CHIMICA
Ciclo XXVI
Settore Concorsuale di afferenza: 03/C2
Settore Scientifico disciplinare: CHIM/04
C
ATALYSTS AND PROCESSES
FOR NEXT
-
GENERATION
H
2
PRODUCTION
Presentata da: Rodolfo Mafessanti
Coordinatore Dottorato
Relatore
Chiar.mo Prof. Aldo Roda
Dr. Francesco Basile
Correlatore
Chiar.mo Prof. Angelo Vaccari
DOTTORATO DI RICERCA IN CHIMICA XXVI Ciclo - 2011-2013
Rodolfo Mafessanti
Tutor Prof. Francesco Basile Curriculum CHIMICA INDUSTRIALE
Catalysts and processes for next generation H2 production
Il Dott. Rodolfo Mafessanti, laureato in Chimica Industriale presso la Facoltà di Chimica Industriale dell’ALMA MATER STUDIORUM - Università di Bologna, con tesi dal titolo “Sviluppo di nuovi catalizzatori per la produzione di H2 attraverso la reazione di
water-gas-shift”, ha svolto la propria attività di tesi di Dottorato presso il Dipartimento di Chimica Industriale “Toso Montanari”.
L’attività svolta dal Dott. Rodolfo Mafessanti è connesso al progetto europeo “Next GTL” (7FP – NMP) e concerne lo sviluppo di un sistema catalitico e la produzione distribuita di gas di sintesi per la trasformazione in distillati medi e idrogeno che per purezza risulta particolarmente indicato per l’alimentazione di celle a combustibile.
Lo studio si è concentrato su un processo di reforming con vapore e ossigeno che consente all’unità industriale di lavorare in condizioni autotermiche a 750°C e su un processo di reforming a bassa temperatura. In entrambi i casi il processo si svolge in più stadi inframezzato da separazione di idrogeno a membrana. Lo sviluppo dei catalizzatori ha riguardato sistemi M-Ce1-xZrxO2 (M = Rh, Ni o Ru) preparati per microemulsione che
hanno mostrato caratteristiche chimiche e morfologiche di enorme interesse per aumentare l’attività e ridurre la disattivazione da carbone. Il metodo e le competenze sviluppate nella sintesi di materiali per microemulsione hanno ampie potenzialità e un vasto campo di applicazioni, ben più estese del processo esame del progetto.
Durante il triennio di dottorato il Dott. Mafessanti ha acquisito competenze nella gestione di impianti da laboratorio per reazioni catalitiche in fase gas e nell’analisi gascromatografica e nell’utilizzo di alcune tecniche di caratterizzazione dei materiali quali: DLS (dynamic light scattering), analisi in diffrazione dei raggi X (XRD), riduzione/ossidazione in programmata di temperatura (TPR/O), porosimetria e spettroscopia Raman, microscopia elettronica a scansione e in trasmissione (SEM e TEM) accoppiata a EDX.
Al momento il candidato ha al suo attivo numerose comunicazioni orali e posters a Congressi, complessivamente sei, per la quasi totalità presentati personalmente. Alcuni manoscritti sono in fase di avanzata preparazione e saranno presto inviati a riviste internazionali. Il dottorando ha mostrato di essere in grado di illustrare efficacemente il suo lavoro a partner industriali e accademici mediante presentazioni.
Nel corso del dottorato il Dott. Rodolfo Mafessanti ha mostrato autonomia e rigore nella conduzione delle prove sperimentali associata ad una elevata capacità di approfondimento che, insieme a buone conoscenze di base, gli hanno permesso di sviluppare la sintesi in microemulsione di materiali catalitici innovativi. Il Dott. Mafessanti ha inoltre dimostrato ottime capacità di elaborazione che gli hanno permesso di collegare efficacemente le proprietà dei materiali alla reattività catalitica.
A
BSTRACT
The present study is focused on the development of new VIII group metal on CeO2 –
ZrO2 (CZO) catalyst to be used in reforming reaction for syngas production. The catalyst
are tested in the oxyreforming process, extensively studied by Barbera [44] in a new multistep process configuration, with intermediate H2 membrane separation, that can be
carried out at lower temperature (750°C) with respect the reforming processes (900 – 1000°C). In spite of the milder temperatures, the oxy-reforming conditions (S/C = 0.7; O2/C = 0.21) remain critical regarding the deactivation problems mainly deriving from
thermal sintering and carbon formation phenomena. The combination of the high thermal stability characterizing the ZrO2, with the CeO2 redox properties, allows the formation of
stable mixed oxide system with high oxygen mobility. This feature can be exploited in order to contrast the carbon deposition on the active metal surface through the oxidation of the carbon by means of the mobile oxygen atoms available at the surface of the CZO support. Ce0.5Zr0.5O2 is the phase claimed to have the highest oxygen mobility but its
formation is difficult through classical synthesis (co-precipitation), hence a water-in-oil microemulsion method is, widely studied and characterized. Two methods (IWI and bulk) for the insertion of the active metal (Rh, Ru, Ni) are followed and their effects, mainly related to the metal stability and dispersion on the support, are discussed, correlating the characterization with the catalytic activity. Different parameters (calcination and reduction temperatures) are tuned to obtain the best catalytic system both in terms of activity and stability. Interesting results are obtained with impregnated and bulk catalysts, the latter representing a new class of catalysts. The best catalysts are also tested in a low temperature (350 – 500°C) steam reforming process and preliminary tests with H2
S
UMMARY
Summary --- 1
1
Introduction --- 1
1.1 Synthesis gas (Syngas) --- 1
1.1.1 Syngas uses: a brief overview --- 1
1.1.2 Options for Syngas and H2production --- 2
1.1.3 Syngas from renewable resources --- 4
1.1.3.1 Pyrolisis --- 5
1.1.3.2 Gasification --- 6
1.1.4 Natural gas (NG): reserves and utilization --- 8
1.1.4.1 Unconventional Gas --- 8
1.1.5 Production from Natural Gas --- 13
1.1.6 Membranes and Membrane Reactors (MRs) --- 18
1.2 Processes for H2/Syngas production --- 22
1.2.1 Steam Reforming --- 22
1.2.1.1 Thermodynamics of Steam Reforming reaction --- 22
1.2.1.2 Kinetics and reaction mechanism --- 27
1.2.2 Catalysts for Steam Reforming --- 32
1.2.2.1 CeO2 – ZrO2 mixed oxide as catalytic support --- 37
1.2.2.2 Carbon formation on reforming catalysts --- 44
1.2.2.3 Sintering of Steam Reforming catalysts --- 49
1.2.3 Practical aspects of Steam Reformer unit plant --- 53
1.3 Catalytic Partial Oxidation (CPO) Process --- 57
1.4 Autothermal Reforming (ATR) --- 61
1.5 Aim of the work --- 62
2
Experimental Session --- 65
2.1 Synthesis methods followed for catalysts preparation --- 65
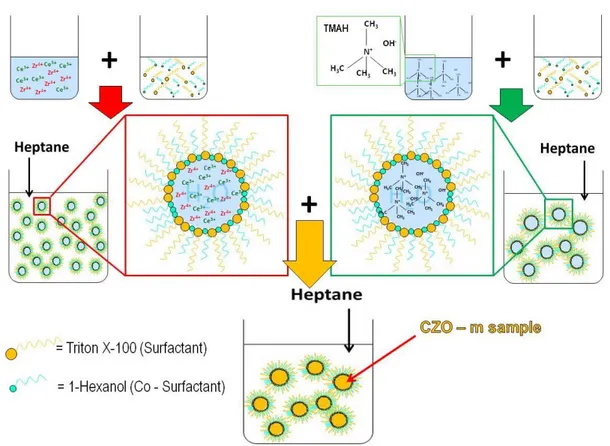
2.1.1 Water – in – oil Microemulsion --- 65
2.1.2 Co – precipitation method --- 67
2.1.3 Calcination procedure --- 67
2.1.4 Insertion of the active metal --- 68
2.1.5 Shaping of the catalysts --- 69
2.2 Membranes preparation --- 71
2.2.1 Activation step --- 72
2.2.2 Electroless Plating Deposition (EPD) --- 73
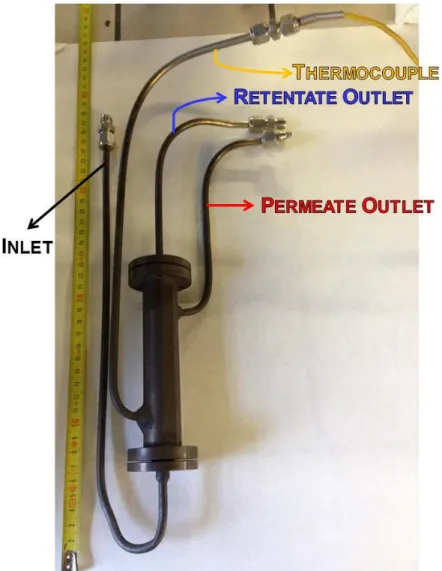
2.3 Laboratory plant description --- 75
2.4 Description of the experiments --- 78
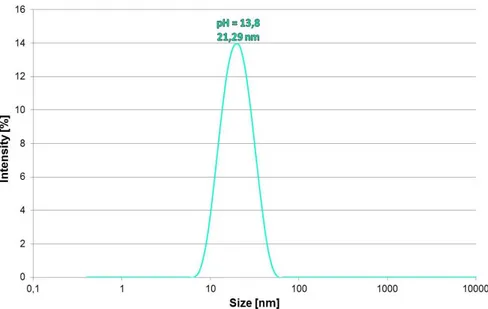
2.5 Dynamic Light Scattering (DLS) analysis--- 79
2.6 X – Ray Diffraction (XRD) analysis --- 81
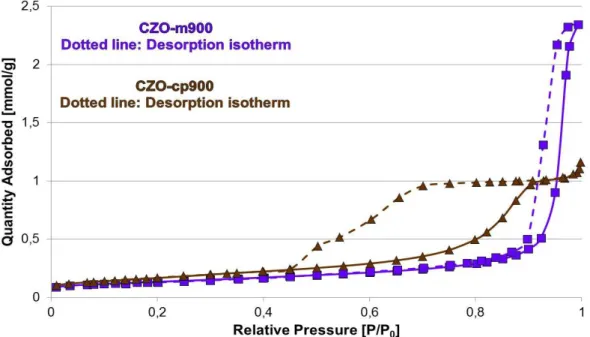
2.7 Surface area and porosimetry analysis --- 82
2.8 Temperature Programmed Reduction (TPR) and Oxidation (TPO) analysis --- 83
2.9 Transmission Electron Microscopy (TEM) --- 84
2.10 RamanSpectroscopy --- 85
3
Results and discussion --- 87
3.1 Introduction by previous studies --- 87
3.2 W/O Microemulsion synthesis --- 89
3.2.1 Effect of pH --- 91
3.2.2 Effect of TMAH molar concentration --- 93
3.2.3 Effect of Rw ratio --- 94
3.2.4 Effect of the nature of the precipitating agent --- 96
3.2.5 Effect of the amount of the organic compounds --- 98
3.3 Characterization of the calcined CZO samples --- 104
3.3.1 W/O Microemulsion vs Co-precipitation --- 105
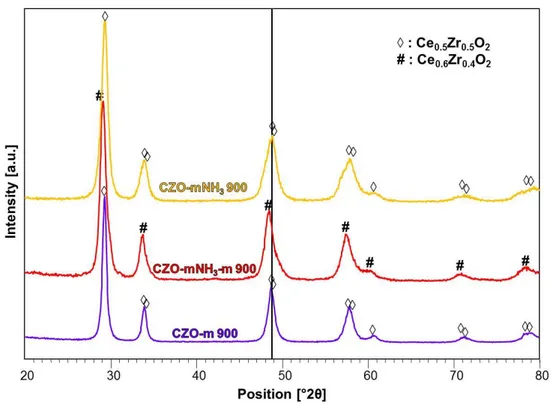
3.3.1.1 XRD Characterization --- 105
3.3.1.2 Raman Spectroscopy --- 108
3.3.1.3 TPR/O/R Characterization --- 110
3.3.1.4 TEM Characterization --- 111
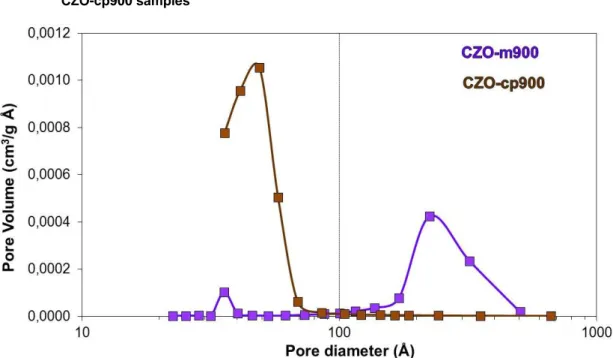
3.3.1.5 Surface Area and Porosimetry Characterization--- 113
3.3.2 Effect of the Precipitating agent: TMAH vs NH3 --- 115
3.3.3 Effect of the Ce/Zr ratio --- 118
3.3.4 Insertion of the active metal --- 122
3.3.4.1 Impregnation vs Bulk --- 122
3.4.1 Comparison with a commercial CZO-based catalyst --- 145
3.4.2 Effect of the support’ Ce/Zr ratio --- 147
3.4.3 Effect of the synthesis method: w/o microemulsion vs co-precipitation --- 151
3.4.4 Effect of the nature of the active metal --- 158
3.4.5 Effect of the metal insertion method --- 163
3.4.6 Effect of the calcination temperature --- 167
3.4.6.1 Bulk samples --- 167
3.4.6.2 Impregnated (IWI) samples --- 179
3.4.7 Effect of the reduction temperature --- 186
3.4.8 Preliminary tests with membrane reactor (MBr) --- 189
4
Conclusions --- 197
1
1 I
NTRODUCTION
1.1 Synthesis gas (Syngas)
Synthesis gas (syngas), a mixture of hydrogen and carbon monoxide, can be manufactured from natural gas, coal, petroleum, biomass and even from organic wastes, potential sources of syngas are ubiquitous in nature. The availability and flexibility of the resource base are keys to the present and future uses of syngas and of its separate components, hydrogen and carbon monoxide. Syngas is a present and increasing source of environmentally clean fuels and chemicals and is also a potentially major fuel for the production of essentially pollution-free electricity, as sulfur and nitrogen in parts per million can be removed from syngas relatively easily [1].
1.1.1 Syngas uses: a brief overview
Syngas is an important building block in the energy production market because of the multitude of processes. Syngas is involved as reagent to be transformed directly into energy or into fundamental intermediate chemicals for energy and fuels production (Fig. 1.1).
Fig. 1.1. Multitude of products that can be produced from syngas
Syngas is principally utilized for the production of H2, the reactant, together with N2,
of the ammonia synthesis process, and for the synthesis of fuels through Fisher – Tropsch process.
2
A different set of options opens up if syngas is converted intomethanol [2]. Methanol synthesistakes place over a copper zinc oxide catalyst in the temperaturerange 220 – 300°C at a pressures of 50 – 100 bar. The ideal molar ratio of H2:CO:CO2 is 11:4:1.
Starting with methanol, there are Methanol To Olefines (MTO) technologies which lead to a whole series of monomers and downstream polymers (polyethylene, polypropylene,ethylene oxide, glycols, surfactants, etc.). There are also processes for converting syngas into higher alcohols, with synthesis taking place at higher temperatures (up to 425°C) and higher pressures (up to 300 bar).
Alternatively, syngas can be converted into SNG (Substitute Natural Gas, or Synthetic Natural Gas) via a methanation process[3], which opens up a whole new set of options using the natural gas grid as a chemical fuel for transportation vehicle. In the power generation sector, syngas production from coal gasification is also becoming more common. On Integrated Gasification Combined Cycle (IGCC) plants, the idea is that coal is gasified to produce a syngas which can serve as a fuel for a highly efficient gas turbine in a combined gas/steam cycle[4,5].
Syngas can also be used as a combustion fuel in a boiler for medium/high pressure steam production or in a simple gas turbine for power generation. It has already been noted that the term “syngas” is used in many different ways. At one end of the spectrum, a low purified gas can be used as a low-grade fuel. At the other end of the spectrum, a highly processed, decarbonized syngas (which is 90% hydrogen) can be used to reduce CO2 emissions. In that case it should be noted that the decarbonized syngas has a lower energy density than natural gas and so a higher gas throughput is required. Gas turbines adapted to run in this mode have been found to produce power outputs that are 20 – 25% higher than normal due to the higher flow rate of hot combustion gases expanding through the turbine [6].
1.1.2 Options for Syngas and H
2production
Various sources and processes for syngas production yield different ratios of H2 to
CO and the availability of source material for syngas manufacture varies at different places in the world. Matching the specific method of production of syngas with the use in a particular synthesis is an important factor in determining the technical and economic value of the various processes [7].
Both non-renewable and renewable energy sources are important for hydrogen and syngas production. As an energy carrier, H2 (and syngas) can be produced from catalytic
3
oxygenates. H2 can also be produced directly from water by electrolysis, thermochemical
cycles, or photocatalytic splitting, although this process is in the early stage of laboratory research [8].
Table 1.1 show how hydrogen (and syngas in most cases) can be produced from coal (gasification, carbonization), natural gas, and light hydrocarbons such as propane gas (steam reforming, partial oxidation, autothermal reforming, plasma reforming), petroleum fractions (dehydrocyclization and aromatization, oxidative steam reforming, pyrolytic decomposition), biomass (gasification, steam reforming, biologic conversion), and water (electrolysis, photocatalytic conversion, chemical and catalytic conversion). The relative competitiveness of different options depends on the economics of the given processes, which in turn depend on many factors such as the efficiency of the catalyst, the scale of production, H2 purity, and costs of the feed and the processing steps, as well
as the supply of energy sources available [3].
H
2source
Energy source
Reaction Processes
1. Fossil hydrocarbons
Natural Gas Petroleum Coal
Tar sands, shale oil Natural gas hydrate
1. Primary Fossil energy Biomass Organic waste Nuclear energy Solar energy 1. Commercialized process Steam reforming Autothermal reforming Partial oxidation Catalytic dehydrogenation Gasification Carbonization
2. Biomass Photovoltaic Electrolysis
3. Water Hydropower 2.Emerging
approaches
4. Organic/animal waste Wind, wave,
geothermal
Membrane reactors
5. Synthetic fuels
MeOH, FTS liquid, etc.
2. Secondary Plasma reforming
6. Specialty areas
Organic compound Metal hydride, chemical complex hydride Ammonia, hydrazine Hydrogen sulfide Electricity H2, MeOH, etc. 3. Special cases Metal bonding energy Chemical bonding energy Photocatalytic
Solar thermal chemical Solar thermal catalytic Biological
Thermochemical cycling
Electrocatalytic
Table 1.1 Options of H2 (and Syngas) production processing regarding atomic H2 source,
Energy source for molecular H2 production, and Chemical reaction processes
[Adapted from Ref. [8]]
Current commercial processes for syngas and H2 production largely depends on
4
processing. Fossil fuels are non-renewable energy resources, but they provide a more economical path to hydrogen production in the near term (next 5 – 20 years) and perhaps they will continue to play an important role in the midterm (20 – 50 years). Alternative processes need to be developed that do not depend on fossil hydrocarbon resources for either the hydrogen source and energy source, such as alternative processes need to be economical, environmentally friendly, and competitive. H2
separation is also a major issue as H2 coexists with other gaseous products from most
industrial processes, such as CO2 from chemical reforming or gasification processes.
Pressure swing adsorption (PSA) is used in current industrial practice. Several types of membranes are being developed that would enable more efficient gas separation. Overall, in order for hydrogen energy to penetrate widely into transportation and stationary applications, the costs of H2 production and separation need to be reduced
significantly from the current technology, for example, by a factor of 2 [3].
1.1.3 Syngas from renewable resources
Biomass is the most likely renewable organic substitute to petroleum. Biomass is a renewable material containing appreciable quantities of hydrogen, oxygen and carbon. It is available from a wide range of sources such as animal wastes, municipal solid wastes, crop residues, short rotation woody crops, agricultural wastes, sawdust, aquatic plants, short rotation herbaceous species (i.e. switch grass), waste paper, corn, and many more. For hydrogen and syngas productions, the current biomasstechnologies include: pyrolysis, gasification, reforming [9]. Currently, there is a wide variety of biomass resources available to be converted into energy. Ni et al. [10]classified this biomass into four general categories:
1. Energy crops: herbaceous energy crops, woody energy crops, industrial crops, agricultural crops and aquatic crops;
2. Agricultural residues and waste: crop waste and animal waste;
3. Forestry waste and residues: mill wood waste, logging residues,trees and shrub residues;
4. Industrial and municipal wastes: municipal solid waste (MSW), sewagesludge and industry waste.
As already mentioned above, the two principal processes involved in the transformation of biomass into H2 and syngas are pyrolisis and gasification.
5
1.1.3.1
Pyrolisis
According to Arni et al. [11], pyrolysis is a thermal process in which biomass is converted into gas, liquid, and solid in the absence of air. The solid called char is rich in carbon and contains the ash, and has several applications such as fuel and sorbent. The condensable fraction (liquid) consists of a very complex mixture of oxygenated hydrocarbons and water, or can be used as a substitute for fuel oil inmany static applications such as in boilers, or as important source of intermediate chemicals. The gas is non-condensable fraction of the pyrolysis process, consisting mainly of H2, CO,
CO2, CH4and other lowmolecular weight hydrocarbons, and is used as fuel gas.
Parameters such as: temperature, heating rate, residence time and type of catalyst used are important in the pyrolysis process. In order to increase gaseous products especially hydrogen production, high temperature, high heating rate and long volatile phase residence time are required. Temperature is an important variable in thermal decomposition processes of biomass, significantly influencing the product distribution [10].
Pyrolysis can be further classified into slow pyrolysis and fast pyrolysis [10]. Slowpyrolysis is normally not considered for hydrogen production. Fast pyrolysis is a high temperature process,in which the biomass feedstock is heated rapidly in the absence of air, to form vapor and subsequently condensed to a dark brown mobile bio-liquid. The products of fast pyrolysis can be found in all gas, liquidand solid phases. In particular, the gaseous product is of considerable interest due to its potential as a source of hydrogen fuel. Moreover, this process has advantages as negligible production of toxic oxidized species (e.g. dioxins), less energy consumption and the production of a disposable solid waste (char). Ni et al. [10] reported hydrogen production cost of biomass pyrolysis versusthe costs of hydrogen production by electrolysis. The estimated cost for the hydrogen production from biomass pyrolysis is in the range between 8.86 US$/GJ and 15.52 US$/GJ depending on the facility size and biomass type.For comparison, the costs by wind-electrolysis systems and PV-electrolysis systems are 20.2 US$/GJ and41.8 US$/GJ, respectively. It can be seen, at least for the economical point of view, that biomass pyrolysisis a competitive method for renewable hydrogen production.
The use of catalysts in the thermo-chemical processing of biomass can be an interesting approach forincreasing the gas yield by decreasing the amount of liquid. Catalytic pyrolysis occurs at relatively lowtemperatures (≤750 °C) and the catalyst is incorporated in the same reactor where the pyrolysis ofbiomass is performed. Garcia et
6
al. [12]reported that nickel is the metal most frequently used in catalysts for biomass processing. The catalyst must have appropriate physical and chemical properties, including mechanical strength, because of its use in a fluidized bed. The thermal stability of the active phase is also very important. Ni/Al co-precipitated catalysts combine these characteristics. The calcinations and reduction conditions of the catalyst impact on the gas yield of the catalytic pyrolysis of biomass.The catalytic pyrolysis is important to reduce the tar formed during pyrolysis process. The use of dolomiteor nickel oxide as catalysts in biomass pyrolysis had been attracted much attention, because it wasinexpensive and abundant and it could significantly reduce the tar content of the product gas [13].
1.1.3.2
Gasification
Gasification is a thermochemical process that differently from pyrolysis, occurs inthe presence of oxygen air and/or steam. Usually the biomass gasification occurs at 700 – 900°C and the products are mainly gaseous.
Hydrogen and syngas production from biomass through thermo-chemical conversion, gasification in particular, have been widely studied. According to Chang et al. [14], the temperature is the most influentfactor for gasification, and increasing the temperature, resulted in increase in gas yield and more hydrogenproduction. Particle size is another factor that affects the gasification process, therefore carbon conversionefficiency and hydrogen yield increase with decreasing particle size. The optimization of gasificationtemperature is around 830ºC and the oxygen content expressed as equivalent ratio with respect to the stoichiometry of combustion around 0.3. Xie et al. [15] studied syngasproduction by two-stage method of biomass catalytic pyrolysis and gasification. The results illustrated thathigher temperature was needed in the gasification process (850ºC) than in the pyrolysis process (750ºC)to maximize syngas yield, and the maximum syngas yield could achieve up to 3.29 N m3/kg biomass (drywt.), much higher than previous studies. Gao et al. [16] investigated hydrogen production from biomassgasification with porous ceramic reforming. The results indicated that the hydrogen yield increased from33.17 to 44.26 (g H2)/(kg biomass) with the reactor temperature increase. The H2concentration ofproduction gas in oxygen
gasification (oxygen as gasifying agent) was much higher than that in airgasification (air as gasifying agent). The hydrogen yields in air and oxygen gasification varied in the range of 25.05 – 29.58 and 25.68 – 51.29 (gH2)/(kgbiomass), respectively. Nipattummakul et
al. [17]reported a study on syngas production from steam gasification of oil palm trunk waste and it was observed thatthe high initial syngas flow rate is mainly attributed to the
7
pyrolysis of volatile matter from the oil palmsample. Almost 50 % of the syngas is produced during the first 5 min. The results showed that there isover 60 % increase in hydrogen production with steam gasification as compared to that with pyrolysis. Theincrease in steam flow rate reduced the time duration of gasification, and promoted steam reformingreactions to result in increased hydrogen yield. Increase in steam flow rate provided negligible effect onthe apparent thermal efficiency. Lv et al. [18] studied catalytic gasification of pine sawdust and themaximum gas yield reached 2.41 N m3/kg biomass at 850 ºC.
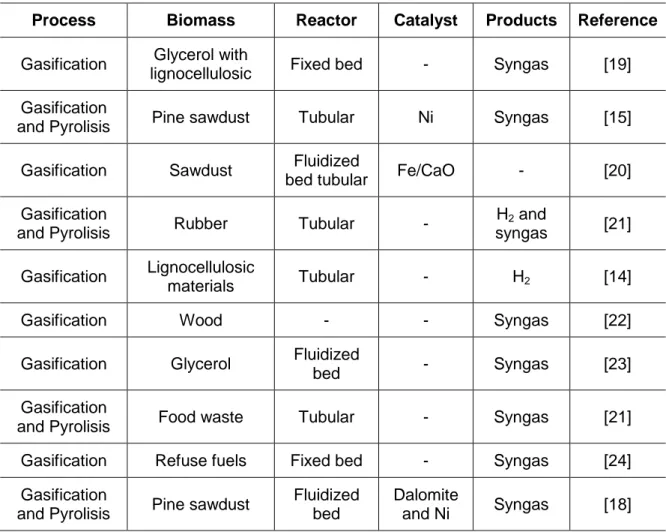
Table 1.2 summarize some of the most important processes of pyrolisis and gasification of biomass to produce H2 and syngas.
Process Biomass Reactor Catalyst Products Reference
Gasification Glycerol with
lignocellulosic Fixed bed - Syngas [19]
Gasification
and Pyrolisis Pine sawdust Tubular Ni Syngas [15]
Gasification Sawdust Fluidized
bed tubular Fe/CaO - [20]
Gasification
and Pyrolisis Rubber Tubular -
H2 and
syngas [21] Gasification Lignocellulosic
materials Tubular - H2 [14]
Gasification Wood - - Syngas [22]
Gasification Glycerol Fluidized
bed - Syngas [23]
Gasification
and Pyrolisis Food waste Tubular - Syngas [21]
Gasification Refuse fuels Fixed bed - Syngas [24]
Gasification
and Pyrolisis Pine sawdust
Fluidized bed
Dalomite
and Ni Syngas [18]
Table 1.2. Summary of the gasification and pyrolisis processes for biomass conversion into H2
8
1.1.4 Natural gas (NG): reserves and utilization
Despite of the utilization of renewable resources, and the growing of more efficient processes to convert biomass into synthesis gas, nowadays it is still produced for the major part from non – renewable sources and mainly from natural gas.
From around 2001 the proven world gas reserves have overcome those of oil toreach nearly 1’200 Billion BOE (Barrel of oil equivalent), i.e. over 196 TSCM (thousand billionstandard cubic meters).
The total amount of “Stranded Gas Reserves”, i.e. the part which is not readily usable, has beenestimated to be about 70 TSCM, about 40% of the gas proven reserves. Such an amountcould, if converted to synthetic fuels, generate around 250 billion barrels of synthetic oil, aquantity equal to one third of Middle East’s proven oil reserves.The possible options for remote gas monetization, when transport in pipelines is notpossible, are the following:
1. LNG (Liquefied Natural Gas), i.e. cooling to about 160°C for transport followed byre-gasification and introduction in the local network;
2. GTL (Gas to Liquid), i.e. conversion of NG to liquid transportation fuels. Theeconomics of GTL versus LNG depends on the oil to gas price relationship whichdepends on various aspects.
Natural gas is widely used so far as a primary energy source principally because its reserves are still very large and, especially from 2007, they even increase thanks to discovery of new technologies able to exploit parts of the enormous reserves of the so called “unconventional gas”.
1.1.4.1
Unconventional Gas
Around 45% of the world's recoverable natural-gas reserves are "unconventional" The International Energy Agency [25] reckons global gas demand will increase by more than half between 2010 and 2035, and unconventional gas will make up 32% of the total supply, up from 14% today. While Russia and the Middle East hold the largest reserves of conventional gas, available sources of unconventional gas are spread across the world, and can be found in countries that are currently net importers, such as China and America (Fig. 1.2).
9
Fig. 1.2. Global conventional and unconventional Natural Gas reserves [25] (Values reported in trillion of cubic meters)
Since 2007 two significant events have changed the market developments. The first was the global economic crisis associated with the near-collapse of the financial systemthat led to a temporary fall in gas demand. The secondwas the sudden and unexpected development of unconventional gas supplies in the United States, the so-calledshale gas revolution. Unconventional gas can be definedas resources that, after the initial well has been drilled, require further processing before it can flow, whereas conventional gas can be collected by simply drilling the well. Today these two factors have turned the relatively tightgas markets of 2006– 2007 into a buyers’ market. At the same time, many analysts have formed the view that unconventionalgas is a major ‘game changer’ which will havesignificant implications for the global supply and demandbalances, and for how gas markets work together withthe underlying geopolitics [26, 27, 28, 29, 30, 31].
There are a number of different sources for unconventional gas [32]:
o Gas hydrates: These are gas deposits trapped in icecrystals in permafrost and on the ocean floor. The gas resource contained in hydrates is estimated to belarger than all other sources of natural gas combined, but most such gas is not commercially producible with today’s technologies [33].
o Coal-bed methane (CBM): Also known as coal seamgas, this is simply natural gas contained in coal beds.Normally the coal beds are regarded as commerciallysub-optimal. The International Energy Agency (IEA, [33]) estimated
10
CBM to be the source of 10% of totalgas production in the United States in 2008, 4% inCanada and 8% in Australia. China and India, with theirhuge coal reserves, also have great interest in developingtheir CBM capability. In China, CBM has been madeone of the 16 priority projects in the 11thFive-Year Plan.
o Shallow biogenic gas: This is gas found in coal seamsgenerated by biogenic processes rather than thethermal maturation that produces CBM. At present itis mainly found in Western Canada.
o Tight gas: This refers to gas deposits found in lowpermeabilityrock formations that require fracturingto release them for production. The IEA suggestsa definition that is based upon a gas reservoir thatcannot be developed commercially by vertical drillingbecause of the lack of natural flow [33]. Also,even with horizontal drilling, hydraulic fracturing isrequired to produce commercial quantities.
o Shale gas: These are deposits trapped within shalerocks. Unusually, these rocks are both the source of the gas and the means of storing it. They also tendto overlie conventional oil and gas reservoirs. Thus if there has been extensive exploration for conventionaloil and gas the existing well-cores can generate large amounts of data to locate the potential shaleplays.
It is the last two categories, shale and tight gas, thatare currently generating the most media interest. Suchdeposits have characteristics that are important for theirprofitability and future prospects. Compared with conventional gas reserves1shale and tight gas are spread over much wider areas. For example, shale gas deposits inplace are around 0.2 to 3.2 billion cubic meters (bcm)per km² of territory, compared with 2–5 bcm per km² forconventional gas [33].
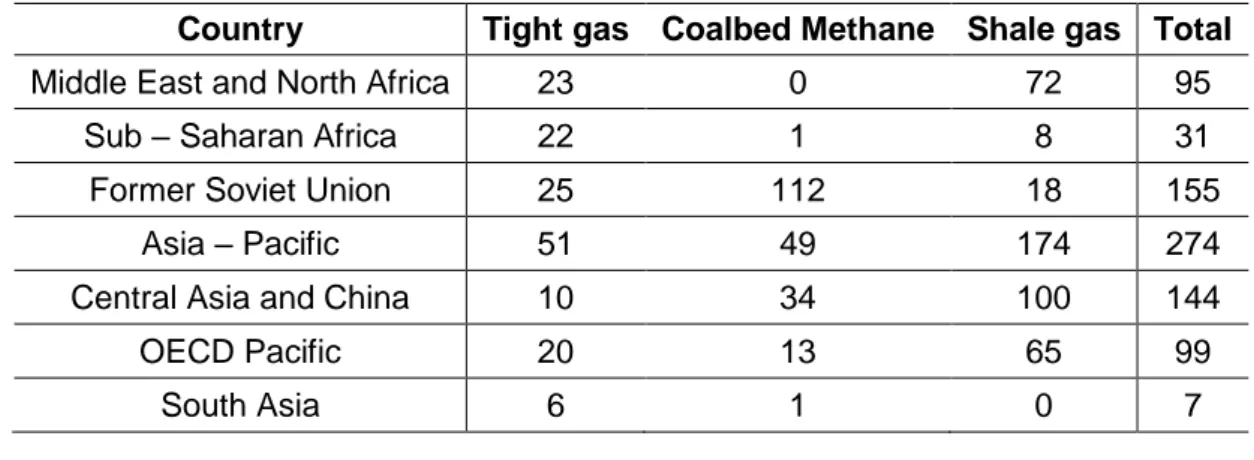
Table 1.3 summarize the world reserves of the main types of unconventional gas.
Country Tight gas Coalbed Methane Shale gas Total
Middle East and North Africa 23 0 72 95
Sub – Saharan Africa 22 1 8 31
Former Soviet Union 25 112 18 155
Asia – Pacific 51 49 174 274
Central Asia and China 10 34 100 144
OECD Pacific 20 13 65 99
South Asia 6 1 0 7
1
Conventional gas reserves are either those of associated gas produced as a by-product of crude oil production, or those of non-associated fields. These produce methane which is dry natural gas, although often methane is produced as part of wet gas. This includes various liquids such as condensates/ natural gas liquids which must be stripped out before the gas can be used as gas.
11
Other Asia – Pacific 16 0 9 24
North America 39 85 109 233
Latin America 37 1 60 98
Europe 12 8 16 35
Central and Eastern Europe 2 3 1 7
Western Europe 10 4 14 29
WORLD 210 256 456 921
Table 1.3. Global unconventional natural gas resources in place (trillion cubic meters—Tcm) [Adapted from Ref. [34] – Source [33]]
The ease of accessibility will vary from well to well. Extracting shale gas and tight gas involves hydraulic fracturing of the rocks with water and chemicals, a technique known as "fracking". This is more expensive than the methods used to produce conventional gas. Costs differ between countries, too. China's shale-gas and coal-bed methane industries are subsidized to the tune of 3 cents per cubic meter. Elsewhere there is less government support. France and Bulgaria have banned fracking for environmental reasons [35].
The shale gas has already had a serious impacton LNG capacity utilization. As a result of gas market conditions around 2007, a surge in LNG export and import capacity was expected. PFC Energy has estimated that export capacity would increasefrom 200 Mt/y in 2008 to 285 Mt/y in 2012 and to 300 Mt/y on 2013 [36]. The IEA [33] described this as an “unprecedented period of expansion” in LNG export capacity , with the largest ever plants due to be commissioned and 147 bcm under construction in11 countries – all due on-stream in 2013. Even more capacity was expected in the longer term. The forecast for2020 reported by Jensen [37] suggests a ‘high case’ LNG capacityof 450 Mt/y and a ‘low case’ of 300 Mt/y. Much of thisincrease in capacity was expected to supply the US market.Thus in Jensen’s ‘low case’, it was assumed that NorthAmerica would account for 30% of the growth in LNGdemand. This is now all looking extremely optimistic,depending upon the view taken of whether the shale gasrevolution can continue in the United States. In fact recently, in the United States there was a decline in LNG imports. While this is in part due to the lower gas demand in the United States as a result of the recession, part is due to the rise in shale gas production.
The result has been a significant under-utilization of US re-gasification capacity [32]. Over the last ten years, this capacity has increased more than tenfold to reach over 100 Mt/y in expectations of domestic gas shortages; however, the increase in shale gas production by over 5.5 bcfd is equivalent to some 41.25 Tt/y of LNG [38]. The IEA estimated that in 2008, six re-gasification plants were under construction, accounting for
12
69 bcm per year, and a further 19 plants with a total capacity of 280 bcm per year had received approval [33]. In 2009, the average utilization of the existing re-gasification capacity was only 9.3% [38]. The result is that a great many private investors in LNG in the United States have suffered considerable losses.
This development of over-capacity is a global phenomenon [28]. There was a general reduction in global gas demand by 70.4 bcm[39] as the result of the recession, leading to a significant over-supply of LNG capacity and supply, together with a reduction in the throughput of pipelines.
The current LNG surplus has caused gas prices generally tofall dramatically, as shown inFig. 1.3. In Japan andthe EU, the fall in gas prices was 28% and 26% respectively,while the fall in oil import costs (based upon anenergy content comparison) was 38%. By contrast, thefall in the United Kingdom was 55%, in the United States56% and in Canada 58%.
Fig. 1.3. Prices of domestic natural gas [32]
These considerations, can help to explain and illustrate the global scenario of natural gas reserves and availability in the world. The unconventional natural gas play a fundamental role on the utilization of this resources both from an economic point of view and regarding the quantity of natural that is possible to utilize. The latter point is of enormous importance regarding the fact that the discovery of new technologies and the improvement of the existing ones, lead to an increase of the exploitation capacity of all types of the natural gas reserves, with big changes on the global market of this energy resource. Therefore, is not difficult to understand why a non-renewable resources such as natural gas, is one of the most utilize so far, generally for the production of chemicals and energy.
13
1.1.5 Production from Natural Gas
Currently the only industrial feasible option for GTL passes through the first step ofconversion of NG to syngas (CO/H2 mixtures) followed by conversion of syngas to
eitherhydrocarbons via Fischer – Tropsch (FT) synthesis or oxygenated products (CH3OH/DME, orhigher alcohols) via well-established technologies.The Fischer –
Tropschprocess is a catalyzed chemical reaction inwhich CO and hydrogen are converted into liquid hydrocarbons[40]. Traditionally the process has been used to synthesizelongchainalkanes as a substitute for petroleum diesel [41]. The usualcatalysts are based on iron and cobalt, and are vulnerable topoisoning by sulphur, chlorides and carbonyl groups. TheFischer – Tropsch process is described by the equation(1):
( ) ( ) The reaction takes place in the temperature range 200 – 350°C at a pressures of 20 – 40 bar. As nincreases, the ideal molar ratio ofhydrogen to CO tends to 2:1. Some authors would reserve the term“syngas” for an ideal 2:1 mixture of hydrogen and CO. The Fischer – Tropsch process is optimized for the desired products distribution (e.g. diesel for road and rail transport, kerosene for air transport,naphtha for petrochemicals production) and is followed by crackingand separation stages as necessary. It can also be used to producelight alkenes for petrol blending [42]. A scheme of a Fischer – Tropsch process is reported in Fig. 1.4. In this process, play a fundamental role in term of cost of investments, the air pre – treatment unit (unit denominated Oxygen plant in Fig. 1.4Errore. L'origine riferimento non è stata trovata.), in fact the air fractioning and the syngas production units have the higher investment cost (36-48%) (Fig. 1.5) [43]. To reduce this cost, very large plants are necessary for FTproduction, but this is limited, because:
1. large investments and risks are necessary;
2. there are only few gas fields for which these large investments could be justified.
14
Fig. 1.4. Schematic of the Fischer – Tropsch process
Fig. 1.5. Costs breakdown for FT process [43]
As a consequence, the valorization of small/medium size gas fields for which pipelinesand LNG are not convenient, require the development of alternative syngastechnologies suited for this size, and direct routes for NG conversion. With this purposes has been developed an European project called Next – GTL [44]which inspired the present work, and the overall scheme is reported inFig. 1.6.
15
Fig. 1.6. Overall scheme of the Next-GTL Project [44]
This project addresses from one side the most critical and costly step to produce liquid fuelfrom natural gas using conventional routes, i.e. the stage of syngas production, and from theother side explores alternative routes (oxidative and non-oxidative) to convert natural gas toliquid transportable products for gasoline and diesel pools. The broader and ambitiousorganization of the project in three lines derives from the following industrial needs/objectives:
1. Reduce the cost and energy consumption (and related environmental impact) ofthe more costly step in the conventional GTL process, i.e. syngas production, andovercome the actual barriers in using catalysts in this process (mainly related tostability); this objective is implemented in Line 1 by developing a new low temperaturecatalytic syngas production based on the integration between catalysts and membrane in a multistep process.
2. Develop GTL technologies suitable for small-medium scale productions inremote NG areas; this objective is implemented in all the three lines of the project byusing configurations, based on the integration with membranes, suited for thisobjective. Develop direct NG routes, in particular, is an important target to reach thisobjective. In addition, the possibility in Line 3 of using NG mixtures (instead of pureCH4) in aromatization step and C2-C3 alkanes (instead of olefins)
16
for convertingbenzene to alkyl aromatics are further relevant components to reach the scope.
3. Develop processes for producing liquid fuels which can be blended in bothgasoline and diesel pools, or which may be used for chemical purpose; after syngasproduction (Line 1) different products could be obtained, but in view of point 2, it is necessary also to develop direct conversion routeswhich could meet this objective. For this reason methanol, DME and alkylaromatics aretargeted as products,.
Accordingly, three development lines are followed in this project:
Line 1: advanced, low temperature route for catalytic syngas formation from natural
gas,in which reaction steps are integrated with different types of membranes for O2, H2 and CO2separation.
Line 2: direct low temperature catalytic conversion of methane to methanol/DME,
utilizingseveral innovative concepts to overcome the drawbacks of previous approaches including theuse of supported ionic liquids/molten salts.
Line 3: direct catalytic conversion of methane to aromatics under non-oxidative
conditions followed by upgrading of the products by alkylation with ethane/propane.
Industrially, nowadays, natural gas is converted into syngas through three main processes:
1. Steam Reforming (SR)
⁄ ( ) Steam reforming (2) is used for converting natural gas (NG) and naphtha intosynthesis gas. Before being sent to SR, the hydrocarbon reagent is preheated anddesulfurized; vapor is then added and the mixture is further preheated and pre-refromed to convert the C2 and C3 hydrocarbons. The reforming takesplace in an oven in which tubes are located filled with catalyst, through which the reactionmixture flows. The synthesis gas at the outlet of the tubes is rapidly cooled and can be sent to water-gas shift processes and separation/purification. SR requires considerable quantities of vapor to reduce the formation of carbonaceous residues. Vapor is also necessary forincreasing the H2content in the synthesis gas produced which would otherwise
17
2. Partial Oxidation (POX) or Catalytic Partial Oxidation (CPO)
⁄ ⁄ ( ) A mixture of oxygen andnatural gas is preheated, mixed and ignited in a burner. In the absence of catalyst, the reactor temperature must be high enough to reach CH4conversion. Carbon and combustion products like CO2 and H2O are also formed to a
certain extent. Subsequently, endothermal reactions like steam reforming is also involved, which determine a decrease in the outlet temperature in the order of 100 – 150°C. At this stage, the gas composition is near thermodynamic equilibrium. According to the stoichiometry (2) the consumption ofO2 should be, in the absence of combustion
products, approximately 0.5 O2/CH4. However, actual use requires O2/CH4ratio of about
0.7 [45].By meansof short contact time, i.e. small reactor, the catalytic process CPO is capable of transforming at lower temperature (900 – 1000°C) the NG and other hydrocarbons fractions which cannot beused by other known catalytic technologies (SR and ATR) and which can only be convertedinto synthesis gas by means of the PO technology but with high energy consumptions andinvestment costs. The control of the temperature and the catalyst stability are the main costrains of the CPO process.
3. Auto Thermal Reforming (ATR)
Autothermal reforming (ATR) is a combination of partial oxidation and steam reforming developed by HaldorTopsoe in the late 1950swith the aim of performing reforming in a single reactor [46]. Typically, the ATR operates at high temperatures of about 1300°C in the combustion zone and 900 – 1100°C in the catalytic zone. This results in a lower oxygen consumption (O2/CH4 = 0.55 – 0.60), however, with a certain
amountof steam added to the feedstock to eliminate carbon formation. Carbon and sootformation in the combustion zone is an undesired reaction which leads to carbondeposition on downstream tubes causing equipment damage, pressure losses and heat transfer problems.
18
Fig. 1.7. Principal syngas production processes from natural gas
A CPO/membrane reactor can then be a valuable alternative with respect to conventionalSR or CPO reactors to transform methane into syngas. No attempt was previously made tointegrate CPO upsteam with an O2 membrane separator and
downstream with a H2 membraneseparator [44].
1.1.6 Membranes and Membrane Reactors (MRs)
Several scientific works [47,48,49,50,51,52] have been developed this new research area, which is becoming even more of a crucial importance mainly in reactions like the reforming ones.
Considering a IUPAC definition [53], a membrane reactor (MR) is a device for simultaneously performing a reaction (SR, dry reforming (DR), autothermal reforming (ATR), etc.) and a membrane – based separation in the same physical device. Therefore, the membrane not only plays the role of a separator, but also takes place in the reaction itself.
The membranes can be classified according to their nature, geometry and separation regime. In particular, they can be classifies into inorganic, organic and inorganic/organic hybrids. The choice of membrane type to be used in MRs depends on parameters such as the productivity, separation selectivity, membrane lifetime, mechanical and chemical integrity at the operating conditions and, particularly, the cost.
Regarding the inorganic type, they are commonly constituted by different materials as ceramic, carbon, silica, zeolite, oxides (Al2O3, TiO2, ZrO2) as well as Pd, Ag, and their
19
thanks to their high thermal and chemical resistance, but the costs are their main drawback.
According to Basile and Gallucci [54] inorganic membranes can be subdivided into four main groups:
1. Metal Membranes: dense metal membranes, are usually used for H2 separation
from gas mixture and in MR area. Pd and its alloys are the dominant materials for preparing this kind of membranes due to its high solubility and permeability of H2. They results to be very expensive, mainly due to the low availability of Pd.
Recently, supported thin metallic membranes are realized by coating a thin layer of Pd (layer thickness comprise in submicron to microns range) on a ceramic support, with the advantages to reduce the material costs, improve resistance to mechanical strength and higher permeating flux. A problem associated with this type of membranes, is the surface poisoning mainly by gases like H2S or CO,
that are adsorbed on the Pd surface, blocking available dissociation site for H2.
2. Ceramic Membranes: usually made from Al2O3, TiO2 or SiO2. They have the
advantages of being chemically inert and stable at high temperatures. This high stability makes this king of membranes suitable for food, biotechnology and pharmaceutical applications.
3. Carbon Membranes: Carbon Molecular Sieve (CMS) are porous solids
containing constricted apertures that approach the molecular dimensions of diffusing gas molecules [55]. CMS can be obtained by pyrolysis of many thermosetting polymers (PVDC, PFA, PAN, etc), cellulose triacetate, phenol formaldehyde and can be divided into supported and unsupported CMS.
4. Zeolite Membranes: are microporous crystalline alumina silicate with an uniform
pore size. One of the main drawbacks related to these membranes is represented by their relatively low gas fluxes compared to other inorganic membranes. Moreover, another important problem is represented by the zeolites thermal effect [56].
A crucial characteristic of a membrane system is its separation regime.
In porous membranes the transport mechanisms could be listed as follows [54]: 1. Poiseuille (viscous) mechanism: occurs when the average pore diameter is
bigger than the average free path of fluid molecules. In this case, no separation takes place;
2. Knudsen mechanism: when the average pore diameter is similar to the average free path of fluid molecules [57];
20
3. Surface diffusion: when one of the permeating molecules is adsorbed on the pore wall. This type of mechanism can reduce the effective pore dimensions obstructing the transfer of different molecular species [58];
4. Capillary condensation:when one of the component condenses within the pores due to capillary forces. Generally, it favors the transfer of relatively large molecules [59];
5. Multi-layer diffusion: when the molecule – surface interactions are strong. It is like to an intermediate flow regime between surface diffusion and capillary condensation [60];
6. Molecular sieving: when pore diameters are very small, allowing the permeation of only the smaller molecules.
In dense metallic membranes, molecular transport occurs through a solution – diffusion mechanism. In particular, in Pd – based membrane, H2 atoms interact with Pd
metal. H2 permeation through the membrane is a complex process with several stages
[54]:
o Dissociation of molecular H2 at the gas/metal interface;
o Adsorption of the atomic hydrogen on membrane surface; o Dissolution of atomic hydrogen into the Pd matrix;
o Diffusion of atomic hydrogen toward the opposite side;
o Recombination of atomic hydrogen to form H2 molecules at the gas/metal
interface;
o Desorption of H2 molecules
At a fixed temperature, the H2 permeation flow through a dense Pd membrane can
be expressed by means of the relation (4):
( ) ( ) where is the H2 flux through the membrane, is the H2 permeability, is the
membrane thickness, and are the hydrogen partial pressures at the retentate and permeate sides, respectively, and n(in the range of 0.5 – 1.0) is the dependence factor of the hydrogen flux on the hydrogen partial pressure.
The thickness of a dense Pd membrane is very important because it represents a compromise between two factors. On one hand, a thinner membrane offers less flow resistance and, hence, a higher permeability. On the other hand, practical fabrication
21
technology limits the thickness of the membrane with respect to mechanical integrity and strength.
In recent decades, the alternative technology of MBRs has been applied to SRM reaction in order to produce H2 separated from the others components of the outlet
stream in the same time in which the reaction is occurring. In particular, recent reviews regarding the state of the art on the hydrogen production via SRM reaction performed by MRs have been published [61,62].
Not only H2 can be separated adopting the membrane technology, but also other
gases such as O2 and CO2.
Dense ceramic membranes for the separation of O2 are mainly based on
perovskites, or O2-conducting materials as used in solid state fuel cells (Y-stabilized
zirconia, Ce-gadolinia, etc.). O2 flux at a given temperature and production of crack-free
thin films are the main issues.
For CO2 separation, either nanoporous membranes (polymeric, or based on
supported ionic liquids), or adsorbents based on zeolites (clinoptilolite or ion-exchanged zeolites) are utilized.
22
1.2 Processes for H
2
/Syngas production
1.2.1 Steam Reforming
The methane steam technology was studied in the first part of 20th century by BASF whoestablished the essential configuration of the primary steam reformer, and the technology wasused in 1931 by Standard Oil of New Jersey to produce hydrogen from off-gases at its BatonRouge and Bayway refineries.
The methane reforming process was adopted mainly in the US where natural gas was easilyavailable as feedstock, whereas reformers in Europe where initially reduced to operate onpropane and LPG [63].
The steam reforming reaction took place over catalyst in vertical tubes, which were supportedin parallel rows in a radiant furnace. The endothermic heat of reaction was supplied by burningfuel in the furnace. The process was considerably improved by ICI, who developed thefundamental engineering data for the design of the furnace, improved the catalyst formulation andintroduced the desulphurization step using zinc oxide. The process was used to produce hydrogenfrom off gases for coal hydrogenation plants, which ICI built in 1936 and 1940.
In the 1959 ICI started up the first large scale pressure steam reformer using naphtha as afeedstock, and this became the precursor of over 400 plants subsequently licensed around theworld in area were natural gas was not available. From 1959 to date development of the catalystcontinued in order to allow plants to be run at higher pressure and temperature, and withfeedstock containing quantities of unsaturated and aromatics compounds to be reformed. In more recent years the increasing availability of natural gas has resulted in its use as a major source of reformer feedstock, and this is likely to remain so for some time. Development ofcatalyst for natural gas reforming has concentrated on extending catalyst life, improving activity,inhibiting carbon formation reactions, and by improving the physical properties.
1.2.1.1
Thermodynamics of Steam Reforming reaction
The objective of the catalytic steam reforming process is to extract the maximum quantity ofhydrogen/syngas held in water and in the hydrocarbon feedstock. Thereafter the subsequentmanipulation of the gas stream depends on the purpose for which the gas is intended.
The reforming process of natural gas include two separated reaction: the steam reforming (2) and the water – gas shift (WGS) (5):
23
⁄ ( ) Therefore the overall reaction could be written as follows:
⁄ ( ) The reforming reaction (2) is strongly endothermic, so the reaction is favored by hightemperature as well as by low pressure, while the shift reaction (5) is exothermic and is favored bylow temperature but is largely unaffected by changes in pressure. To maximize the overall efficiency (and hence economics) of the conversion of carbon to carbon dioxide and theproduction of hydrogen, reformers are operated at relative high temperature and pressure. Thisis followed by the shift process that, by using two different catalysts, permits the shift reaction tobe brought to equilibrium at as low temperature as possible. It can be seen in reaction (2) that SR with methane thestoichiometric requirement is 1.0. However, it has been demonstrated that these conditions are not reliable because all catalysts so far developed tend to promote carbon formationunder steam reforming conditions. These reactions can be suppressed by using an excess ofsteam, with the results that the minimum ratio is in the region of 1.7. However, the reformingreaction itself is also promoted by an excess of steam and hence some advantage is derivedfrom this. In practice ratio of 2.5 - 3.5 are commonly used, but in some cases, there can beeconomic attractions in using lower steams ratios and there is a trend in this direction. Fig. 1.8show how the thermodynamic parameters such as temperature and pressure together with the steam to carbon ratio (S/C), have a large influence on the reformate outlet composition.
24
Fig. 1.8. Variation of the reformated gas in function of: a) Temperature; b) Pressure; c) S/C ratio [44]
Lutz and co-workers [64] examined the thermodynamics of the steam reforming process. The process must burn either a second fuel, a fraction of the primary fuel, or the residual fuels that remain in the reformate stream. This last option is often done in practice to recover heating value that would otherwise be wasted. The analysis presented by Lutz considers two levels ofsophistication in treating the chemistry. The first uses a global species balance that assumes thatthe reforming reaction goes to completion. An energy balance for the reaction allows to examinethe definition of thermal efficiency. This analysis provides a theoretical upper limit on the thermalefficiency that is independent of temperature or other influences on the reaction kinetics. Thesecond analysis replaces the global reaction step with a calculation of chemical equilibrium for the reforming reaction. The equilibrium computation brings in temperature dependence, without requiring detailed information regarding the specific reactions or catalyst performance.
According to the first method of thermodynamic analysis reported by Lutz et al. [64] a global reaction balance could be written as reported by equation (7):
a) b)
25
⁄ ( ) ( ⁄ ) ( ⁄ ) ( ) ( )
where n and m define the composition of the fuel, and S/C is the steam-to-carbon ratio for themixture. The term “global reaction” recognizes that the reaction is actually the net result of a seriesof elementary reactions, some of which include catalytic interaction with surfaces. This balanceconserves elements with two assumptions: there is sufficient steam to react with the fuel (S/C≥2),and the reaction goes to completion. Using thereaction (7), the formation enthalpies of the speciescan be added to determine the net enthalpy change (8):
( ⁄ ) ( ) ( ( )) ( ) where is the formation enthalpy per mole of species k at standard temperature and pressure.
In Fig. 1.9 are reported the efficiency of SRM (Steam Reforming of Methane) in function of temperature and S/C ratio, calculated through the equilibrium model (A), while (B) show the equilibrium composition of a reformate gas. Focusing on the solid curve (Fig. 1.9 (A)), for S/C=2, the effect of temperature is to increase the efficiency of the equilibrium reformer. This issimply due to the fact that at lower temperatures the equilibrium composition leaving thereformer (Fig. 1.9(B)) contains more unreacted methane and water. As the temperatureincreases, the equilibrium composition approaches the product stream expected from the globalbalance, except that there is still an excess of steam, and the CO concentration is 20% of themixture.
The equilibrium solutions suggest that the reformer must operate at higher temperatures.There is, however, a limit to which higher temperature improves performance. The equilibriumdoes not shift much farther towards reaction completion as the temperature goes above 900°C. Asecondary effect is that the reformate stream contains insufficient heating value, so supplementalfuel must be added prior to the burner. The effect of S/C ratio is complicated by the fact that itsinfluence depends on the temperature. The three curves (Fig. 1.9 (A)) at S/C ratios of 2, 3 and 4show that at low temperature, where the reaction is far from completion, the efficiency increasewith excess of steam. At high temperature, where maximum H2 is obtained, the equilibrium
modelbehaves like global analysis. In this limit, the excess of water does reduce the efficiency. Theobservation that the thermal efficiency intersect at some temperature means that there is a pointwhere the chemical benefit of extra steam is offset by the energy required to generate it.
26
Fig. 1.9.(A) Efficiency of methane steam reforming computed in equilibrium model versus reformer temperature at pressure of 10 atm at different S/C ratios; (B) Equilibrium composition leaving the methane steam reformer for S/C = 2 and pressure 10 atm [64]
Fig. 1.10. Thermal efficiency vs. equilibrium reformer temperature for steam reforming of methane at S/C=3 and two exhaust temperatures [64]
From thermal efficiency analysis, Lutz and co-workers concluded that definitions of thermalefficiency can be misleading. The definition should be accompanied by identification of the systemboundary and the heat flows across it. The definition should include external heat addition.Comparisons of the equilibrium model for steam reforming to experimental data showed that thechemical equilibrium is appropriate for understanding the effect of temperature. Experimentalthermal efficiencies for steam reforming were significantly lower than the thermodynamic limitpredicted by the equilibrium model. Species measurements showed the deficiency was partly dueto non-equilibrium composition, but other heat transfer losses are a dominant effect, especially forcompact steam reformers. The effect of extra steam suggested by the equilibrium analysis is toincrease the H2 conversion and thermal efficiency, at least until a high
temperature limit is reachedwhere the H2 conversion is maximized. Only in this limit is the
27
1.2.1.2
Kinetics and reaction mechanism
The results of a number of studies on the kinetics of the methane steam reforming havebeen published. There is general agreement that the reaction is first order in methane, but thereis less agreement with other kinetic parameters. In part, this is due to the use of differentcatalysts and experimental conditions, but often it has resulted from a lack of consideration ofdiffusion and heat transfer limitations. Thus, reported activation energies are spread in a widerange of values due to different degrees of diffusion limitation, and these can also causemisleading total pressure effect. Indeed, with the relatively large catalyst particle sizes used inindustrial steam reformers, these effects results in very low effectiveness of the catalyst. Effectiveness factors (η) may, depending on conditions, only be as high as 0.3 at the inlet region,and perhaps as low as 0.01 at the exit. Because of this, apparent activity increases as theparticle size is made smaller, but the increased pressure drop, which arises across the reformer,restricts the size of the catalyst that can be used in practice [65].
A wide variety of rate expressions for the steam reforming of methane have beenproposed. These models range in complexity from simple first order dependency on methane,involving two parameters, to complex Langmuir–Hinshelwood models with over tenparameters [66]. It is generally agreed that the rate of methane reforming has a first orderdependency on methane. Furthermore, it is also agreed that the rate-determining step in thereforming process is the formation of adsorbed carbon species which occurred through equation (9):
( ) This mechanism leads to the formulation of rate equations (10) of the following form:
( )
In equation (10), the value of αis found to depend on temperature, having a value close to −1at low temperatures (<700°C) and approaching to 0 at high temperatures (>700°C).
Kinetic rate expressions for the steam reforming of methane found in the literature use thesteady state approximation and take the form of the equation (11):
( )
[ ( )] (
28
Reforming rates can be rigorously obtained from measured net rates using anapproach to equilibrium parameter () evaluated from CH4-H2O thermodynamic
reaction dataand measured reactant and product partial pressures [67,68]:
[ ][ ]
[ ][ ] ( )
In the expression (12), [ ]is the average partial pressure of species j (in atm); it is also usedto correct for reactant depletion. Keqis the equilibrium constant for CH4 - H2O
reaction.Forward turnover rates (rf) are given by equation (13):
( ) ( ) where rn is the net CH4 conversion turnover rate. CH4 reaction rate increased linearly withincreasing CH4 pressure. H2 and CO products added toCH4 - H2O reactant mixture influenced net CH4 conversion rate at 600°C, but forward rates wereunaffected,
indicating that H2 and CO affected only the extent to which reforming reactionsapproach
equilibrium, but not the kinetics of CH4 reforming reaction. Thus, previously
reportedinhibition of CH4 reaction rates by products may reflect unrecognized
contributions from reversereaction rates. CO adsorption enthalpies are 135kJ*mol-1at low coverage (<0.02) and much lowerat higher coverage on Ni (100). These adsorption enthalpies indicate that CO coverage should bewell below 0.01 monolayer at 600°C and even at equilibrium CH4 conversions. The loweradsorption enthalpies typically reported
for H2 (92 kJ*mol-1) would make hydrogen coverage evenlower than for CO. Thus,
competitive adsorption is unlike to influence the availability of metal sitesfor CH4
activation and reported inhibition effects predominately reflect contributions from reversereactions.
These kinetic responses to reactant and product concentrations are consistent withdetermining CH4 activation steps on surfaces, essentially free of reactive
intermediates or co-adsorbed products. CH4-derived chemisorbed intermediates appear
to be readily removed viareactions with H2O co-reactant; as a result, the identity and
concentration of co-reactant becomekinetically irrelevant and forward rate data for the steam reforming reaction is accurately describedby equation (14):
( ) Catalytic reaction of CH4with H2O to form H2-CO mixtures on Ni depends only on the
rate ofthe initial activation of C—H bonds, catalyzed by surface Ni atoms. Co-reactant activation is easy and CH4-derived intermediates, including reactive chemisorbed
29
carbon, are kept well below monolayer coverage by their rapid reactions with intermediates derived from H2O.
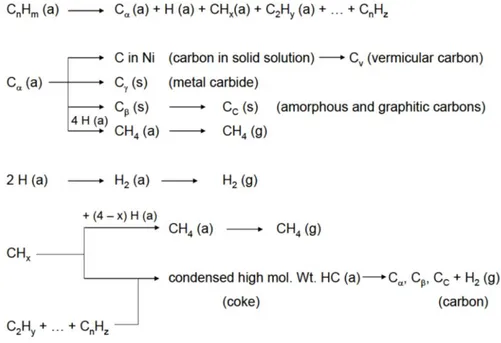
Regarding the reaction mechanism, it has been demonstrated that is in accordance with the measured kinetic effects of reactant and product concentration of forward reaction rate. The various steps involve in the mechanism proposed by Wei and Iglesia [67] are schematically reported in Fig. 1.11. Methane decomposes to chemisorbed carbon (C*) via sequential elementary H-abstractionsteps, which become faster as H atoms are sequentially abstracted from CH4reactants. Density-functional theory led to an activation energy of 142kJ*mol-1 for the first H-abstractionstep in CH4 on Ni clusters,
which decreased to 25-40kJ*mol-1 for CH2 formationfrom CH3*. This cascade process
leads to low CH* coverage and to C* as the most abundantcarbon-containing reactive intermediate. Chemisorbed carbon is then removed using CO2 orH2O as co-reactants.
These elementary steps are consistent also with kinetic andisotopic measurement on Ru, Pt, Ir and Rh catalysts. When exposed metal atoms (*) are themost abundant surface species, only the rate constant for the activation of the first C—H bondin CH4
appears in the rate expression and reaction rates become first order in CH4
andindependent of the presence or concentration of H2O or CO2 co-reactants. These
elementary steps provide pathways for reactions of CH4 with either H2O orCO2 and also
for water gas shift reaction which have been typically, but inappropriately andnon-rigorously, treated as independent kinetic process during CH4 reforming [67,68].
![A New Strategy for Glioblastoma Treatment: In Vitro and In Vivo Preclinical Characterization of Si306, a Pyrazolo[3,4-d]Pyrimidine Dual Src/P-Glycoprotein Inhibitor](data:image/gif;base64,R0lGODlhAQABAIAAAP///wAAACH5BAEAAAAALAAAAAABAAEAAAICRAEAOw==)