Smart City Analytics: state of the art and future
perspectives
Carlo Giovannella1,2, Mihai Dascalu3, Federico Scaccia1, 1 ISIM_Garagre, Dept. of Educational Science and Technologies
University of Rome Tor Vergata, Rome, Italy [email protected]
2 Creative Industries, Consorzio Roma Ricerche, Rome, Italy [email protected]
3 Department of Computer Science
University “Politehnica” of Bucharest, Bucharest, Romania [email protected]
Abstract. In accordance with a "people centred" vision, this paper critically
examines current approaches to smart cities benchmarking. In particular, by means of correlation analysis and Principal Component Analysis (PCA) we put in evidence current limitations of city rankings and, as well, the emergence of different perspectives for data interpretations. To follow, a possible redesign of the "Smart Cities Analytics" grounded on the traces left by individuals, is suggested. In particular, as an example, we focus on the potential of automatic text analysis tools to extract people perceptions and expectations that, in turns, demonstrate the need to integrate bottom-up and top-down approaches to city benchmarking. Finally a novel definition of smart city is proposed based on the
territorial state of flow and, as a consequence, a novel path toward smart city
benchmarking is brought forward.
Keywords: Smart City Benchmarking, City Smartness, Smart City Analytics,
PCA, Natural Language Processing, Text analysis, Concept Maps, Flow
1 Introduction
The adoption of a people-centred approach to the design and development of smart cities clearly highlight the problem of defining and measuring city and territorial smartness.
The centrality of the person [1,2], his/her characteristics and experiences pose significant challenges to the evaluation approaches derived from top-down functionalist models of smart cities. Within these models the space of representation has an infrastructural origin and is shaped to fit the neoclassical theory of regional and urban development based on six smart characteristics, the so called 'soft factors': smart economy, smart mobility, smart environment, smart people, smart living, smart governance [3-6]. These evaluations approaches are “useful” to produce, in a relatively short time, rankings of various kinds that, however, are affected by quite
serious criticalities. In fact, apart from the little consideration for individuals, two relevant issues are the difficulties: (a) to go beyond quantitative aspects to include qualitative metrics (e.g. quality of services); (b) to make emerge visions that inspire political decisions and, in turn, determine the local path toward city smartness (glocal smartness). As previously shown, such evaluation approaches are also affected by two additional problems [7,8]: (c) the limited insights about the dynamics of the systems whose components (people and environment) unavoidably co-evolve relatively fast and (d) the lack of checking procedures on the statistical reliability and suitability of the chosen indicators and, thus, of the multidimensional space of representation.
In order to convince the reader about the need to explore alternative approaches, we will first go more in depth into the discussion of issue d), i.e. the statistical reliability of the procedures adopted until now to benchmark cities’ smartness. Afterwards, we discuss an alternative way (text analysis) to take properly into account behaviours, expectations and characteristics of individuals, and of the communities to which they belong. This also implies also the development of appropriate analytics to interpret the traces that are continuously produced by individuals during their daily activities.
Finally we propose a novel definition of smart city and an alternative path for benchmarking cities’ smartness.
2 Reliability problems of current approaches for benchmarking
cities' smartness
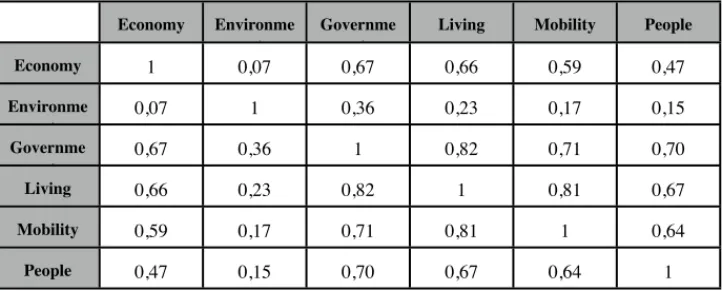
One of the main problems of the "six soft factors" approach, as discussed in [7], is the strong correlation among such dimensions, see Tables 1 and 2.
Tab. 1. Correlation Matrix among the six soft factors elaborated from the city rankings reported
in ref. [4] focused on medium size European cities Economy Environme
nt
Governme nt
Living Mobility People
Economy 1 0,07 0,67 0,66 0,59 0,47 Environme nt 0,07 1 0,36 0,23 0,17 0,15 Governme nt 0,67 0,36 1 0,82 0,71 0,70 Living 0,66 0,23 0,82 1 0,81 0,67 Mobility 0,59 0,17 0,71 0,81 1 0,64 People 0,47 0,15 0,70 0,67 0,64 1
Tab. 2. Correlation Matrix among the six soft factors elaborated from the city rankings reported
in ref. [6] focused on Italian cities Economy Environme
nt
Governme nt
Living Mobility People
Economy 1 0,20 0,55 0,58 0,62 0,57 Environme nt 0,20 1 0,38 0,37 0,28 0,58 Governme nt 0,55 0,38 1 0,50 0,65 0,49 Living 0,58 0,37 0,50 1 0,58 0,68 Mobility 0,62 0,28 0,65 0,58 1 0,51 People 0,57 0,58 0,49 0,68 0,51 1
Table 1 refers to the study performed by Giffinger et al. [4] on 70 European cities comparable by size (medium) but not by contexts. The rankings that have been worked out in such study have been drawn from indicators that are manifestly affected by a strong correlation among smart economy and four of the remaining soft factors. Smart environment appears to be the only almost independent factors and in fact is the major contributor to the second principal component derived from a principal component analysis (PCA) [7].
Fig. 1. First vs. second principal component plot derived from a PCA applied to the city
rankings reported in ref. [6] based on the six soft factors model. The green horizontal line identify the area where most of the big cities are located (upper part)
The situation does not change very much, and it is even worst, if we consider the case of ref. [6] that aimed at benchmarking Italian cities: the correlation among the soft factors extends, albeit in a more limited form, also to the smart environment (Table 2). As result, the smart environment factor ends up contributing almost as much as the other soft factors to the first principal component and, in a relevant manner, together with smart people, with which it is most closely related, to the negative value of the second principal component (see Fig. 1). It is interesting to note that also in Fig. 1, similarly, although to a lesser extend, to the case of the PCA of ref. [7], it is possible to identify regional clusters such as those formed by some Sicilian or Emilian cities. It seems also possible to identify along the axis of the first principal component lines that separate, although not so sharply, city located in the south of Italy, from those located in centre and, finally, those located in the north. Moreover, along the second principal component, it is possible to trace an approximate border that separates big cities from small to medium size ones, indicating that the care for the environment and some aspects of the individual dimension (smart people) partially depend, as one may expect, on the size of the city.
The division into subregions of the plan of representation of Fig. 1 seems also to suggest that the indicators chosen to work out the city rankings of ref. [6] do not hold the same significance for all the cities. And, in fact, if one performs a correlation analysis of the six soft factors limited to the 13 major cities considered by another city ranking - that elaborated by the group Ambrosetti [9] - it comes out that the degree of correlation between the smart environment and the other soft factors substantially increases (see table 3). This indicates that the optimal space of representation is different for cities of different sizes.
Tab. 3. Correlation Matrix among the six soft factors elaborated from the city rankings reported
in ref. [6] focused on the 13 largest Italian cities selected within the Ambrosetti report [9] Economy Environme
nt
Governme nt
Living Mobility People
Economy 1 0,36 0,36 0,77 0,67 0,64 Environme nt 0,36 1 0,37 0,47 0,51 0,76 Governme nt 0,36 0,37 1 0,29 0,59 0,21 Living 0,77 0,47 0,29 1 0,44 0,85 Mobility 0,67 0,51 0,59 0,44 1 0,53 People 0,64 0,76 0,21 0,85 0,53 1
At this point it becomes obvious that we need to reformulate the approach to both the definition and the measure of the city’s smartness. This is also due to the fact that the indicators used to determine, for each soft factor, the corresponding city ranking are almost exclusively aimed at benchmarking the infrastructures or at evaluating the outcomes of specific processes. In addition, if we refer to the multidimensional model of the "person in place" experience [10], Fig. 2, we may note that the six soft factors cover almost exclusively some of the dimensions that characterise a context and ignore almost completely the dimensions that describe the individual and/or community propensities.
Fig. 2. Placement of the six soft factors with respect to dimensions and sub-dimensions of the
“person in place” model of the experience
The problem of the correlations among the six soft factors, however, cannot be simply solved by identifying a different set of indicators or dimensions, even when the intention is to replace the top-down approach critically analysed up to now, with another one characterised by a greater attention toward the quality of the individual experience. In fact, even in the case of the set of indicators and dimensions selected by the Ambrosetti group [9] (see Table 4), many factors turn out to be strongly correlated to each other. It is not surprising that also in the case of such study the overall sense of the rankings and the interplay among the different rankings are not immediately obvious. Only by means of a PCA we were able to extract underlying
meanings behind the data and to better understand the correlation among the dimensions (see Table 4). In Fig. 3 the positive contributions to the first principal component are mainly provided by the sub-dimensions connectivity and inclusiveness of the dimension mobility and by the the level of animation of the social and cultural life, while the main negative contribution comes from the availability of personal time. Therefore connectivity fosters the development of economic and cultural centres of attraction but at the same time induces a decrease of the individual free time. Curiously, port and maritime towns occupy the left positions along the first principal component.
Tab. 4. Correlation Matrix among the nine dimensions on which the city rankings of ref. [9] are
based: D1 = mobility-security; D2 = mobility-connectivity; D3 = mobility-inclusivity; D4 = resources-efficiency; D5 = resources-urban setting; D6 = resources-sustainability; D7 = life-ecosystem defence; D8 = life-free time; D9 = life-socio cultural activities;
D1 D2 D3 D4 D5 D6 D7 D8 D9 D1 1 -0,19 -0,30 0,06 0,53 -0,23 -0,13 0,09 -0,36 D2 -0,19 1 0,62 -0,31 0,34 -0,29 -0,48 -0,30 0,63 D3 -0,30 0,62 1 -0,13 -0,25 -0,01 -0,30 -0,30 0,57 D4 0,06 -0,31 -0,13 1 -0,10 -0,16 -0,12 0,31 -0,27 D5 0,53 0,34 -0,25 -0,10 1 -0,41 -0,52 0,22 -0,11 D6 -0,23 -0,29 -0,01 -0,16 -0,41 1 0,27 -0,42 0,28 D7 -0,13 -0,48 -0,30 -0,12 -0,52 0,27 1 0,21 -0,41 D8 0,09 -0,30 -0,30 0,31 0,22 -0,42 0,21 1 -0,70 D9 -0,36 0,63 0,57 -0,27 -0,11 0,28 -0,41 -0,70 1
Positive contributions to the second main component are provided primarily by the characteristics of the urban setting and, to a lesser extent, by the sub-dimensions security and connectivity of the dimension mobility, while the negative contribution comes from the sustainability of resource consumption and from the level of the ecosystem defence: at the top area of Fig. 3 are positioned those cities that are less attentive to environment and consumption, despite the potentialities offered by the urban context. The position along the second principal component seems to depend on the size of the city.
To conclude, the critical analysis of ref. [9] demonstrates, once more, that the problems with the benchmarking of the city’s smartness are not confined to the choice of the dimensions and that one has to go beyond evaluation approaches based on multidimensional ranking for which the reliability and interplay of the chosen indicators have not been carefully investigated. This can be done by integrating the
rankings approaches discussed above with bottom-up ones based on the analysis of the electronic traces produced by individuals. In the following sections we shall introduce, as an example, one of the most promising approaches to perform meaningful qualitative, quantitative and, as well, dynamical analysis of individuals' perception and expectations: the automatic analysis of textual traces.
Fig. 3. First vs. second principal component plot derived from a PCA applied to the city
rankings reported in ref. [9] based on the nine dimensions listed in Table 4.
3 Bottom-up contribution from traces: text analysis and the
"wisdom of the crowd"
Before we get into the details of the potential offered by the specialised text analysis tools, it is important to underline that, unlike approaches described in the previous paragraph, where the dimensions of the representational space are defined a priori, in the case of the analysis of the electronic traces produced by individuals, the space of representation and the meanings, as well, emergence in a natural manner from analytics. In the following sub-sections we illustrate the possibilities offered by a simple analysis of word occurrences and, then, those offered by more complex text analytics, evidencing advantages and drawbacks of both.
3. 1 Analysis of word occurrences
Recently we have shown [11] how, by analysing the occurrences of the words used in answering the questions of a survey (in Italian) on smart cities, it is possible to extract the perception that individuals - owning a high cultural level (high and middle school teachers) - have about smart cities and, as well, their expectations about the transformation inducible by the increase of the territory/city smartness.
It came out that the classical models of territorial and urban development, as well as, the dimensions that have been derived from them to benchmark cities’ smartness (soft factors) are very far from common perception and feeling. This latter conclusion derives directly from a ‘benchmarking’ of the context operated at individual level that concentrate mainly on the well-being of the person (also when s/he is playing the role of a citizen) and on that of the environment where s/he is living and carrying on her/ his activities. While in traditional models the smart economy comes out to be the driving force that correlated to at least 5 out of the 6 pillars used to benchmark smart cities [7], from our analysis it emerged that only mobility is perceived as particularly relevant for individuals (also because it is related to the optimisation of personal time). Besides the personal sphere, the environment and the economic activities related to its preservation, together with a careful consumption of resources, are perceived as the leading key-factors of a potential growth of the territorial smartness. This result was not unexpected if we consider that smart environment is the only dimension almost orthogonal to all other soft factors considered by traditional models. The aim of this article consists of performing a double check on the results obtained in our previous work and to of being able to use automated methods of text analysis (at moment fully applicable only to English and French texts) in order to analyse the answers obtained in response to a questionnaire written in English. The survey on smart cities was proposed to experts of Technology Enhanced Learning (TEL): the participants were 35 individuals working at University or in research centres of different nationalities, about 80% from Europe. The questionnaire was composed of 8 questions on smart cities and smart city learning. In this paper we focus solely on the analysis of the answers given to the first 3 questions:
Q1: What does "smart city" mean, in your opinion? Q2: How could your city become smarter?
Q3: What should be the role of technology?
As an example in Table 5 we list the occurrences of the most frequent terms used in answering question Q3, grouped by topics and by occurrence percentage. We have filter out the words used in the formulation of the question, like role and technology. According to the analysis of the word occurrences, the ‘picture’ that emerges from the answers given to all three questions is fairly homogeneous and repetitive, and shows only some minor variations from question to question.
The focus is on improving the quality of life of individuals (both in terms of problems resolution and of needs satisfaction) also, with a social perspective, when they are
playing the role of citizens. Technologies (web/internet, sensors and mobile devices that allow access to Internet) are perceived as enablers of innovative and smart services, as well as, infrastructures.
Tab. 5. Q3: “What should be the role of technology ?” Emergent relevant meanings: actual
nouns and number of occurrences, followed by their relevance score in square brackets (described in section 3.2)
> 4 occurrences 4 & 3 occurrences < 3 occurrences Goals service 8 [7] transportation 3 [4]
quality 3 [3] decision 2 [2], process 2 economy 2 [2]
Communication information 10 [8]
datum 5 [3] knowledge 3 [3] interaction 2 [2]
Tech means devices 3 [3]
web 3 [2] internet 2, mobile 2sensor 2 [2]
Focus on person citizen 5 [4] people 4 [4] life 2 [2], human 2
Context context 3 [3] system 1 [2]
Tab. 6. Q3: “What should be the role of technology ?” Emergent relevant meanings: actual
verbs and number of occurrences, followed by their relevance score in square brackets (described in section 3.2)
> 4 occurrences 4 & 3 occurrences < 3 occurrences
Enable access 5 [5] allow 4 provide 2 [4],
facilitate 2 enable 2
Sustain support 5 [3]
help 6 promote 3 [1] assist 2
Goals learning 4 [3] interact 2 [2],
involve 2 [2], manage 1 [2], think 1 [2]
Services should be mainly directed at improving real-time access to information and knowledge, but also for educational purposes. More in general all categories of services should be part of a systemic design.
Moreover a city is considered to be smart when: a) its government and its institutions are also smart and decision making is accompanied by participatory approaches; b) transportation and mobility are not problematic; c) the environment is safeguarded, the use of resources optimised and pollution minimised; d) an adequate support to culture and education is provided; and e) the economic growth is encouraged and supported.
By comparing these findings, although obtained from a limited number of participants, significantly smaller of that involved in ref. [11], you realise that by extending the geographical origin of the participants and by moving from school teachers (with widespread cultural backgrounds) to university professors and researchers (thematically focused on TEL) the overall focus is shifted on: a) infrastructures facilitating the circulation of data, information and knowledge; b) support to culture and education; c) support to economic development; and d) and smart government.
However, the main focuses for all individuals that took part in both the surveys consist of: a) the centrality of the people, also in the role of citizen; b) the attention to the conservation and protection of the environment; and c) mobility. Moreover, despite a slightly increase of the proximity of the emerging picture with the 6 soft factors model (due to a increase of consideration for smart economy, smart government and the ICT infrastructural backbone), the soft factors remain always in the background when compared to the centrality of the persons and of their well-being and to the conservation of the environment in which they live. This confirms, once more, the need to review the approaches to the benchmarking of city’s smartness and to integrate the bottom-up approach and trace analytics with the top-down approach based on pre-selected indicators. Indicators that, in any case, should be carefully checked for their reliability and for their ‘reasonable’ level of independence.
3. 2 Automatic Text Analysis
Going beyond the analyses discussed up to now, in this section we describe how an automatic text analysis tool can be used to derive also a network of meanings (conceptual map) that can be enriched by additional terms, emerging from a comparison to a reference corpora.
Based on previous studies from information retrieval [12] addressing topic extraction, one of the author has proposed a novel analysis model [13] that combines the strengths of multiple approaches and provides a comprehensive method for extracting and visualising concepts to obtain an overview or holistic representation of the initial document, independently from its nature (general texts, chat conversations, forum discussion threads or polls) [14]. Tightly connected to the cohesion function and the
cohesion graph proposed as underlying discourse structure [15,16], topics are extracted at different levels of the analysis and their corresponding relevance score are reflected in the following factors: (a) statistical presence, (b) semantic relatedness and (c) overall coverage and linkage with the analysis element.
The statistical presence is a purely quantitative statistical dimension represented by the normalised term frequency [17]. In our extraction procedure we opted for not considering the inverse document frequency, as we intend to focus on the specificity of each single text and not on the tendencies induced by the training corpora.
The semantic relatedness reflects the similarity to the analysis element (sentence, block of text or entire document) through the cohesion function, more specific cosine similarity applied on the Latent Semantic Analysis vector space [18] and the inverse of Jensen–Shannon divergence applied on the Latent Dirichlet Allocation probabilistic model [19]. This approach ensures global and local resemblance, as well as, significance of each extracted topic with regards to a specific analysis element.
Fig. 4. Relevance rankings of lemma (left ranking: nouns; right ranking: verbs) used by the
participant to the survey in answering Q3.
The semantic coverage is deduced from the importance of the semantic chain containing a particular concept and spanning throughout the entire document. This
can be perceived in terms of Bakhtin [20] dialogism as the local importance of voice in terms of the overall dialogue. From a computational perspective, the disambiguation graph and lexical chains are extracted using WordNet [21] and the approach proposed by Galley & McKeown [22], later on to be merged into semantic chains lexical chains through cohesive links. Therefore, for each lexical chain we determine its LSA vector and LDA probability distributions using the contained concepts and we iteratively merge two by two the chains if LSA and LDA similarities exceed pre-imposed threshold. In current experiments the values were set to .75 for LSA and .85 for LDA similarity as these thresholds proved to be most accurate.
Finally, in order to identify the relevance of each word in terms of the corresponding semantic chain, we use a normalised value of the chain’s span (1+log(length of chain)) and an aggregated measure of LSA and LDA similarities between: (a) the word and the semantic chain (relevance of word in terms of the "voice") and (b) the similarities between the chain and the entire document (overall coverage of the voice).
In addition, as an empirical improvement, the selection of specific parts of speech for each lemma (nouns and verbs in particular) provided an increase in the results’ accuracy, as these concepts tend to better grasp the conceptualisation of the document in terms of main focus points and actions. Fig. 4 provides an example of the result obtained from the poll corresponding to Q3.
Moreover, based on the identified topics pertaining to a document, a new list of inferred concepts not occurring within the initial text, but semantically close, is automatically determined. The process consists of two stages. Firstly, potential candidates are identified via synset relations from WorNet or from closeness similarities while considering entire LSA and LDA semantic spaces. Secondly, all potential concepts are evaluated based on the following criteria: a) semantic similarity with the list of identified topics and with the analysis element; b) a shorter path to the ontology root for emphasising more general concepts; and c) strong relatedness to other concepts (topics from the text or other inferred concepts) as only a connected component of the conceptual network is taken into consideration (outliers and unrelated concepts that do not satisfy the imposed cohesion threshold specified within the user interface are disregarded). The strength of a link within the concept network is measured in terms of cohesion (LSA and LDA similarities above a predefined threshold) and the visualisation uses a Force Atlas layout from Gephi [23] in which the dimension of each concept is proportional with its relevance score.
Although the identification mechanism are somewhat different for topics and inferred concepts, the underlying similarity measures are similar, making on one hand the scaling between the concepts achievable and, on the other, emphasising the importance of concepts from the initial text through the use of semantic chains that can be perceived as a bonus, enhancing the weight and implicitly the trust in concepts explicitly used.
As the initial topics list can be quite limited on rather small input texts, besides the use of the previous connected network of concepts, additional filters are enforced to diminish the number of irrelevant generated terms. An example of a generated network of lemma (nouns and verbs), including the inferred ones, is shown in Fig. 5.
Fig. 5. Lemma Network derived from the answers given to Q3 that include also inferred
concepts (blue circles). The dimension of the circles is proportional to the relevance of the represented lemma.
3. 3 Comparison: advantages and drawbacks
As far as the nouns are concerned (see Table 5), the mapping between their level of relevance and the number of occurrences is pretty good and the slight differences are fully reasonable. At the moment, however, the present version of the software does not allow for the elimination of the words that have a high probability of being
retrieved in the answers because they are used to formulate the questions. On the other hand, the mapping between relevance and the number of occurrence of the verbal forms highlights some discrepancies (see Table 6). In fact some of concepts that have been identified as significant by subjective analysis turn out to be characterised by a low relevance, while an enhanced relevance is observed in the case of verbs commonly used. Most likely, this aspect needs to be improved by using more specific training corpora for the LSA and LDA semantic spaces .
Overall we may conclude that the subjective analysis enables to perform effectively, although not rapidly, ‘expert’ word clustering and extraction of emergent meanings, but certainly does not allow to extract in a reasonable time concept maps like the one shown in fig. 5 or, even more complex ones. Of course one needs to calibrate accurately the parameters that control the generation of the maps: for example, the number of inferred concepts (nouns and verbs) to prevent the emergence of concepts too general and/or irrelevant for the specific context. In the case of Fig. 5 particularly relevant are the emergence of concepts such as citizenry (associated, among others to the words citizen and access) or cognition (associated to learning and interaction); much less relevant to the specific context are the emergence of concepts like part, encourage, etc., although fully justified by their use in the corpus of reference. Overall, these can be considered lights and shadows that, anyway, demonstrate the potential of the automatic approach and ask for the development of more specific corpora.
4 Flow and territorial smartness
Despite the fact that all urban agglomerations are all over the world formidable attractors for people, the quality of the life and of the opportunities that they may offer are the real factors that actually attract the human capital (either social and intellectual). The results of the word occurrence analysis conducted on the questionnaires described in this paper and in ref. [7] clearly show that individuals consider a city to be smart when it is able to satisfy their needs, the quality of life and, as well, to generate a positive tension. Such positive tension is what has promoted, throughout history, the cultural dominance of regions, e.g. Florence during the Renaissance, and can be defined as flow [15].
By transliterating from a person to a city, we can state that a smart city is a city where the human capital, (and more in general each individual/citizen) owns not only a high level of skills (possibly innovative ones), but is also strongly motivated by continuous and adequate challenges, while her/his needs are reasonably satisfied. The state of flow of a city, thus, should be maintained by cooperative and convergent actions carried on by all main stakeholders.
A meaningful smart city benchmarking, thus, should be able to measure the city’s state of flow that is unavoidably related with the individuals’ well-being and state of flow and, as well, with the satisfactions of their expectations.
Thus, the main problem is to identify the most adequate indicators and dimensions, and to develop suitable analytics, in order, to constantly monitor the state of flow of a territory. At present, however, no procedures and analytics have been been yet defined, an issue that offers interesting opportunities for future researches.
Despite the lack of such systematic work and the problems highlighted in section two, it is already possible to identify first attempts to integrate bottom-up and top-down approaches. In the report realised by the Ambrosetti group [9], for example, as anticipated above, time is not considered only as a resource to be increased by means of an improved and smarter mobility but also a relevant resource at personal level. The quality of life of individuals, moreover, was benchmarked also for what concerns the socio-cultural opportunities and incentives offered throughout the territory. It is also worthwhile to stress that another important parameter considered in ref. [9] is, at large, the consumption of resources, on top of which is possible to build environmental conservation and eco-sustainability. This latter represents a choice perfectly aligned with the results of our analysis on individuals’ perception and expectations about city smartness.
In the same direction goes the attempt to measure the equitable and sustainable well-being (BES) [25], also specialised to urban areas (UrBES) [26]. However, these two are quite articulated sets of indicators and their in-depth analysis goes beyond the scopes of this paper, summarised here below:
a) highlight the problems associated with the bottom-up approaches currently used to benchmark city smartness and, as well, in the production of rankings of any sort; b) stress the usefulness to monitor and analyse the electronic traces produced by individuals, dwelling, as an example and without hiding the operational difficulties, on the potential of subjective and automatic text analysis tools.
c) propose an alternative conceptual framework to monitor and benchmark the appeal and smartness of cities and territories based on the concept of flow.
5 References
1.The origin of the “Person in Place Centered Design” vision is documented in Giovannella C. " ‘Person-in-Place Centered design’:educare ‘istructional designer’ e operatori dei futuri "learning places", in Didamatica 2008, ed. ed. by A. Andronico, T. Roselli, B. Lamborghini, Bari, 2008, p. 973 and later in Giovannella C. and Graf. S. “"Challenging Technologies, Rethinking Pedagogy, Being Design-Inspired The Grand Challenge of this Century" eLearn Magazine, ACM ed., 25 Feb. 2010, http:// elearnmag.acm.org/archive.cfm?aid=1734044
2.For a “human smart city” vision see http://www.peripheria.eu/library, retrieved on Aug. 20, 2013 (get inspiration also from the Human Centered Design Vision by IDEO https://hcd-connect-production.s3.amazonaws.com/toolkit/en/download/ideo_hcd_toolkit_final_cc_superlr.pdf)
3.Giffinger R., Gudrun H.: Smart cities ranking: an effective instrument for the positioning of cities? ACE: Architecture. City & Environ, 4 (12), pp. 7–25 (2010)
4.Giffinger R., Fertner C., Kramar H., Pichler-Milanovic N., Meijers E.: Smart cities. Ranking of European medium-sized cities (2007) http://www.smart-cities.eu/press-ressources.html (Retrieved on April 2014).
5.Fast company (2013), http://www.fastcoexist.com/1680538/what-exactly-is-a-smart-city (Retrieved on April 2014)
6.Forum PA, ICity Rate. La classifica delle città intelligenti italiane (2012) http://www.icitylab.it/il-rapporto-icityrate/edizione-2012/metodologia/ (Retrieved on April 2014)
7.Giovannella C.: Territorial Smartness and Emergent Behaviors, in ICSCS 2013, IEEE publisher, 2013, pp. 170--176
8.De Santis R., Fasano A., Mignolli N., Villa A.: Smart city: fact and fiction, MPRA Paper No. 54536 (2014), http://mpra.ub.uni-muenchen.de/54536/ (Retrieved on April 2014)
9.Ambrosetti (2012), Smart Cities in Italia: un’opportunità nello spirito del Rinascimento per una nuova qualità della vita.
10.Giovannella C., Moggio F.: "Toward a general model of the learning experience", ICALT 2011, IEEE publisher, 2011, pp. 644-645
11.Giovannella C.,. Smart Territory Analytics: toward a shared vision, in SIS 2014, CUEC Ed.
12.Manning, C.D., Raghavan, P., Schütze, H.: Introduction to Information Retrieval, Vol. 1. Cambridge University Press, Cambridge, UK (2008)
13.Dascalu, M., Dessus, P., Bianco, M., Trausan-Matu, S., Nardy, A.: Mining Texts, Learners Productions and Strategies with ReaderBench. In: Peña-Ayala, A. (ed.) Educational Data Mining: Applications and Trends. Springer (in press)
14.Dascalu, M.: Analyzing Discourse and Text Complexity for Learning and Collaborating. Springer (in press)
15.Trausan-Matu, S., Dascalu, M., Dessus, P.: Textual Complexity and Discourse Structure in Computer-Supported Collaborative Learning. In: 11th Int. Conf. on Intelligent Tutoring Systems (ITS 2012), Vol. LNCS 7315, pp. 352–357. Springer, Chania, Grece (2012)
16.Dascalu, M., Dessus, P., Trausan-Matu, S., Bianco, M., Nardy, A.: ReaderBench, an Environment for Analyzing Text Complexity and Reading Strategies. In: 16th Int. Conf. on Artificial Intelligence in Education (AIED 2013), Vol. LNCS 7926, pp. 379–388. Springer, Memphis, USA (2013)
17.Manning, C.D., Schütze, H.: Foundations of statistical Natural Language Processing. MIT Press, Cambridge, MA (1999)
18.Landauer, T.K., Dumais, S.T.: A solution to Plato's problem: the Latent Semantic Analysis theory of acquisition, induction and representation of knowledge. Psychological Review, 104(2), 211–240 (1997)
19.Blei, D.M., Ng, A.Y., Jordan, M.I.: Latent Dirichlet Allocation. Journal of Machine Learning Research, 3(4-5), 993–1022 (2003)
20.Bakhtin, M.M.: Problems of Dostoevsky’s poetics. University of Minnesota Press, Minneapolis (1984) 21.Miller, G.A.: WordNet: A Lexical Database for English. Communications of the ACM, 38(11), 39–41
(1995)
22.Galley, M., McKeown, K.: Improving Word Sense Disambiguation in Lexical Chaining. In: 18th International Joint Conference on Artificial Intelligence (IJCAI’03), pp. 1486–1488. Morgan Kaufmann Publishers, Inc., Acapulco, Mexico (2003)
23.Bastian, M., Heymann, S., Jacomy, M.: Gephi: an open source software for exploring and manipulating networks. In: International AAAI Conference on Weblogs and Social Media, pp. 361–362. AAAI Press, San Jose, CA (2009)
24.Czisikszentmihalyi M.: Flow - The Psychology of Optimal Experience. Harper & Row (1990) 25.BES report 2014 ww.misuredelbenessere.it/index.php?id=66 (Retrieved on April 2014) 26.UrBES (2013), http://www.istat.it/it/files/2013/06/Urbes_2013.pdf (Retrieved on April 2014)
![Table 1 refers to the study performed by Giffinger et al. [4] on 70 European cities comparable by size (medium) but not by contexts](https://thumb-eu.123doks.com/thumbv2/123dokorg/8056401.123450/3.892.89.782.765.1176/table-refers-performed-giffinger-european-cities-comparable-contexts.webp)