Politecnico di Milano
Facolt`
a di Ingegneria
Dipartimento di Elettronica, Informazione e Bioingegneria
Corso di Laurea in
Computer Science
Binary Function Vulnerability
Discover through LLVM IR
Relatore:
Stefano Zanero
Co-Relatori:
Mario Polino
Tesi di Laurea di:
Daniele Marsella
matr. 10482136
Abstract
The existence of security vulnerabilities in programs is one of the problems that mostly defines modern computer era; as a consequence, nowadays, soft-ware analysis has become one of the most relevant fields in computer security and an increasing number of researchers is currently working on the develop-ment of tools that could discover security vulnerabilities in the shortest time possible. In particular, there is a type of software analysis based on the anal-ysis of program executables in binary format, which is binary analanal-ysis, that is quite useful because it can be employed to find vulnerabilities in softwares that have already been released.
Recently, the usage of intermediate representation languages, which are de-signed to simplify and enhance the analysis of program executables, has acquired an increasing interest in binary analyses researches. We decided to employ one of such languages also in our project in order to cover different machine architectures and also to make our tool easily extendable.
In our thesis we focus on a specific type of binary analysis, static binary analysis, which analyzes the executable without actually executing or emu-lating it, building an intermediate representation of it. We chose to use this approach because it ensures the coverage of the whole binary code inside the executable.
Our project’s goal is to design a security tool that is capable of detecting a particular type of vulnerability, known as buffer overflow, in compiled soft-wares (binary executables). In particular, we are interested in a specific type of buffer overflow, the loop-based buffer overflow: this type of vulnerability happens when the program contains a loop that at each iteration stores an element of a source buffer into a destination buffer without checking the desti-nation size. This loop is typically controlled by an user input, hence allowing the attacker to overwrite variables stored in program memory next to the destination buffer and, in the worse case, to execute malicious injected code. Moreover, this type of vulnerability is very common in strcpy-like functions. In order to identify such vulnerabilities in binaries from different archi-tectures, our tool translates the binary input into an intermediate language designed for program analyses and scans this intermediate representation to find any vulnerability. This solution allows also to produce a modular tool that can be easily extended and enhanced. After that, the tool scans the functions call chain of the program executable and tracks user input propa-gation from specific source functions to all the other functions, implementing
2
a simple taint analysis. This approach allows to filter out functions that contain buffer overflows but are not controlled by user input.
We designed three experiments to demonstrate the abilities of our tool in detecting buffer overflow vulnerabilities in different types of binaries. The first experiment tests tools abilities against both dynamically and statically linked binaries taken from public CVE lists of vulnerable programs. The second experiment tests tools abilities against binaries extracted from an ARM-based router’s embedded firmware that had never been analyzed be-fore. The last experiment tests our tools abilities against DARPA Cyber Grand Challenges example binaries, built on top of a custom operating sys-tem.
Our tests show that tool is able to identify 11 of the 15 vulnerabilities cho-sen in the first experiment, as well as a not yet discovered vulnerability inside one of the binaries of the firmware for the second experiment. The results of the third experiment show that the tool marks as vulnerable at least one function in all the binaries that are known to contain a buffer overflow vul-nerability. Overall results demonstrate that our tool can be efficiently used to simplify vulnerability detection in binaries, but it still requires improvements on the detection precision.
Sommario
L’esistenza di vulnerabilit`a di sicurezza nei programmi `e una delle problem-atiche che maggiormente caratterizzano la moderna era informatica, tanto che ormai l’analisi del software `e divenuta uno degli argomenti pi`u discussi e un sempre crescente numero di ricercatori in una corsa contro il tempo alla ricerca di una soluzione efficace che permetta di individuare le vulnera-bilit`a nei programmi il pi`u velocemente possibile. In particolare, esiste una specifica tipologia di analisi dei programmi basata sull’analisi degli eseguibili dei programmi in formato binario, chiamata binary analysis, la quale risulta particolarmente utile perch´e pu`o essere utilizzata per trovare vulnerabilit`a in software che sono gi`a stati rilasciati.
Di recente l’utilizzo di intermediate representation languages, che sono lin-guaggi ideati per semplificare e migliorare le analisi di software eseguibili, ha ricevuto una particolare attenzione nelle ricerche di binary analysis. Per questo motivo, anche noi abbiamo deciso di adottare uno di questi linguaggi all’interno del nostro software, in modo da poter gestire facilmente diverse architetture e rendere il nostro tool modulare.
Nel nostro progetto ci soffermiamo principalmente sulla static binary anal-ysis poich´e essa garantisce la copertura completa del codice all’interno del binario, mentre la dynamic binary analysis non pu`o testare tutti gli input del programma per via delle dimensioni in genere troppo grandi del dominio degli input.
In questo progetto presentiamo un tool di sicurezza informatica in grado di trovare un particolare tipo di vulnerabilit`a software, chiamato buffer over-flow, all’interno di programmi gi`a compilati. In particolare, il nostro progetto si sofferma su un particoalare tipo di buffer overflow, i loop-based buffer over-flow: questo tipo di vulnerabilit`a `e presente nei programmi che contengono loop che ad ogni iterazione copiano un elemento da un buffer sorgente a un buffer destinazione, senza controllare le dimensioni della destinazione. Generalmente, la condizione di tali loop `e controllata dall’input dell’utente e questo permette a un possibile attacker di poter sovrascrivere varibili in memoria adiacenti al buffer di destinazione, permettondogli inoltre, nel caso peggiore, di eseguire del codice malevolo.
Il nostro tool traduce i binary in input in una rappresentazione intermedia utilizzando un intermediate representation language, dopodich´e analizza tale rappresentazione in cerca di vulnerabilit`a. Questa soluzione ci ha permesso di creare un tool modulare che pu`o essere facilmente esteso e migliorato. Inoltre, il tool `e in grado di tracciare la propagazione dell’input dell’utente,
2
attraverso le chiamate di funzioni, a partire da specifiche funzioni sorgente. Questo permette al nostro tool di eliminare dai risultati quelle funzioni che contengono dei buffer overflow che non sono controllati dall’utente.
Abbiamo delineato tre esperimenti che dimostrano le abilit`a del nostro tool nella individuazione delle vulnerabilit`a di tipo buffer overflow all’interno di binari di diverso genere. Il primo esperimento testa le abilit`a del tool usando binari linkati sia dinamicamente che staticamente a librerie esterne, presi da liste pubbliche di programmi vulnerabili. Il secondo esperimento, invece, testa le sue abilit`a usando binari estratti dal firmware di un router basato sull’architettura ARM. Il terzo e ultimo esperimento infine testa il tool impiegando i binari di esempio offerti dalla DARPA Cyber Grand Challenge, costruiti usando un particolare tipo di sistema operativo usato per queste competizioni.
I nostri test dimostrano che il tool `e capace di identificare 11 dei 15 binari pubblicamente noti come vulnerabili nel primo esperimento, e ci ha permesso inoltre di identificare una vulnerabilit`a non ancora nota all’interno di uno dei binari estratti dal firmware del secondo esperimento. I risultati del terzo esperimento mostrano inoltre che il tool `e stato capace di identificare come vulnerabili tutti i binari contenenti almeno un buffer overflow. Nel complesso, i risultati dimostrano che il nostro tool pu`o essere utilizzato efficacemente per semplificare l’individuazione di questo tipo di vulnerabilit`a, anche se necessita ancora dei miglioramenti per la precisione dei risultati.
Contents
1 Introduction 3
2 Background and Motivation 6
2.1 Binary Analysis . . . 6
2.1.1 Control-Flow Graph . . . 6
2.1.2 Data-Flow Graph . . . 7
2.2 Static vs. Dynamic Analysis . . . 8
2.2.1 Static binary analysis . . . 9
2.2.2 Dynamic binary analysis . . . 10
2.3 State of the Art . . . 12
2.3.1 BAP: Binary Analysis Platform . . . 12
2.3.2 Valgrind . . . 13
2.3.3 BitBlaze . . . 14
2.4 LLVM : a modular compiler framework . . . 15
2.4.1 LLVM IR . . . 16
2.5 REV.NG : a unified binary analysis framework . . . 22
2.5.1 CFG reconstruction . . . 23
2.5.2 Function-boundaries detection . . . 24
2.6 Project Goal . . . 24
3 Design and Implementation 27 3.1 Design . . . 27
3.1.1 Buffer Overflow structure . . . 28
3.2 Implementation . . . 29
3.2.1 Preparation . . . 30
3.2.2 Max Steps Pass . . . 31
3.2.3 Backward Propagation Pass . . . 31
3.2.4 Revng Function Params . . . 32
3.2.5 Function Parameters Usage . . . 33
3.2.6 Loop Dependencies Pass . . . 34
3.2.7 Security Wrapper Pass . . . 34
3.2.8 Analysis Output . . . 34 4
4 Experiments 37
4.1 Sanity Check . . . 37
4.2 DARPA Challenges binaries . . . 38
4.3 Real World Binaries . . . 39
4.4 Unknown binaries . . . 41
4.5 Taint Analysis Performances . . . 42
5 Related Works 46 5.1 Static Value Flow Analysis . . . 46
5.2 Monotone Framework . . . 47
6 Limitations 51 6.1 Structural limitations . . . 51
6.2 Weeknesses . . . 52
7 Conclusions and Future Works 54
List of Figures
2.1 An example of a Control-Flow Graph . . . 72.2 An example of a Data-Flow Graph . . . 8
2.3 An overview of Bitblaze Vine component . . . 15
2.4 An overview of Bitblaze TEMU component . . . 15
2.5 An overview of Bitblaze Rudder component . . . 16
2.6 A representation of the structure a LLVM IR Module . . . 18
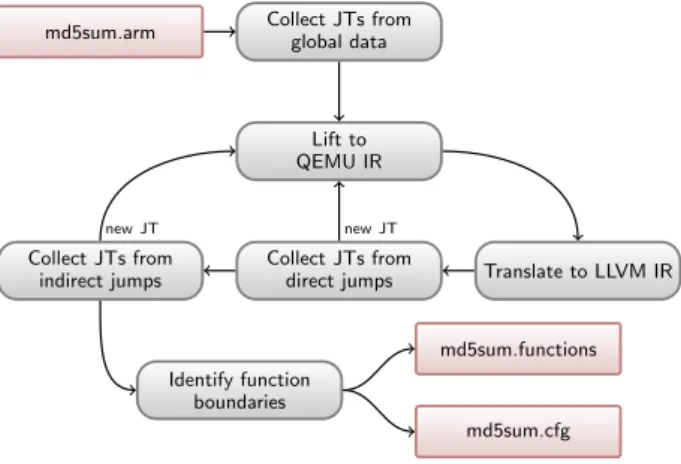
2.7 An overview of the REV.NG system. JT stands for jump tables, and new JT means that a new jump target has been found . . 22
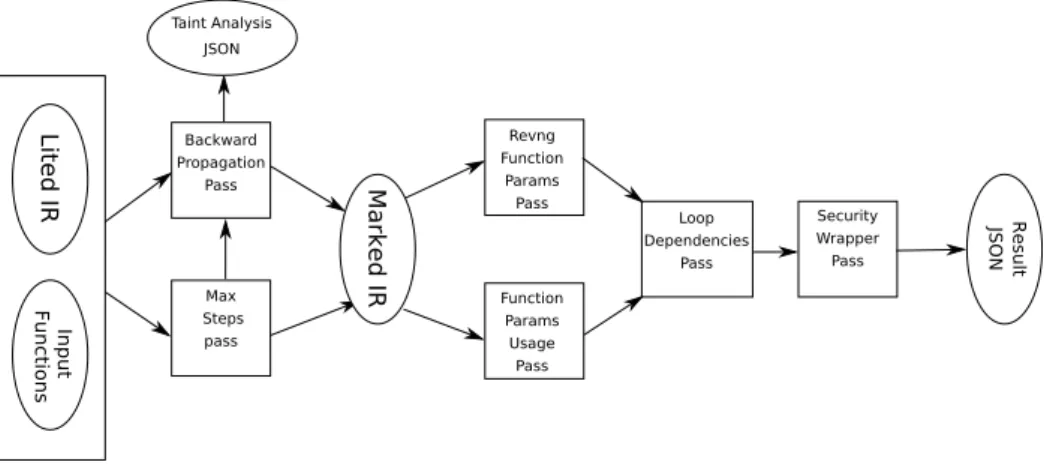
3.1 High-level design of the pass pipeline of the analysis . . . 30
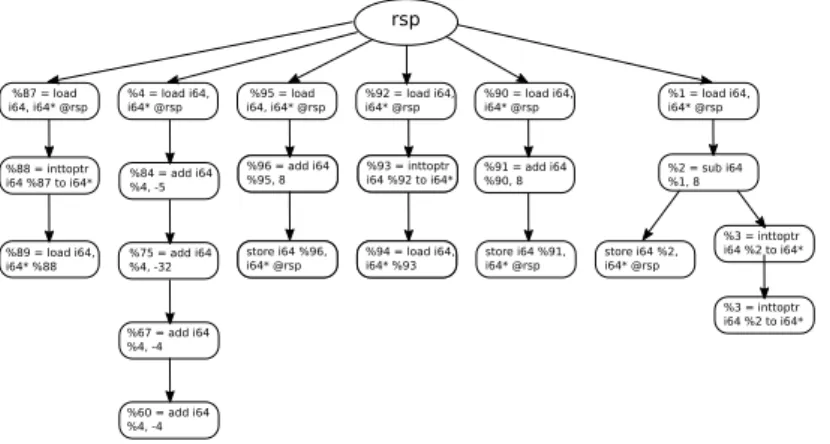
3.2 An example of a variable-flows produced by Function Params Usage Pass . . . 33
LIST OF TABLES 1
List of Tables
4.1 Results of the validation tests . . . 38 4.2 Experiment results on the binaries extracted from DARPA
CGC binaries . . . 39 4.3 Experiments results on the real world vulnerable programs . . 40 4.4 Experiment results on the binaries extracted from router firmwares 42 4.5 This table reports the performances of taint analysis on
bina-ries of the experiment described in Section 4.3 . . . 42 4.6 This table reports the performances of taint analysis on
bi-naries of the experiment described in Section 4.4 and other extracted from the same firmware . . . 43 4.7 This table reports the performances of taint analysis on
1
Introduction
The production of secure softwares has become of the utmost importance both for developers and businesses that are based on software technologies, though detecting vulnerabilities in a program is not always a straightforward task.
In this thesis we are going to present a security tool, developed using modern compilation and computer security technologies, capable of detecting security vulnerabilities in already compiled softwares. The solution proposed by our project is able to identify vulnerabilities at function-level inside binary executables, already deployed and used in different use-cases, extracting a lot of information about the usage of function arguments and dumping them into a standard format that can be further analyzed later by other tools.
Proprietary softwares are shipped with only the executable binary, so users cannot analyze their source code for vulnerability. This is the case also for the so called Component Off-the-Shelf or COTS software, and the same reasoning applies also to legacy softwares, which are old programs critical in particular businesses that cannot be replaced and whose source code in many cases is not available, or even embedded softwares, used in many electronic devices like routers or modems . In all these cases, the only way to discover vulnerabilities is through a direct analysis of binaries.
A common example of vulnerabilities discovered in binaries is buffer over-flow,which is a type of vulnerability among all type of applications actually present on the market. A buffer overflow occurs when a value is stored be-yond the memory region occupied by the variable that should contain that value. The most common example of this kind of vulnerability is the strcpy function in C standard libraries: this function copies the characters from a string and transfers them to another one, but in many implementations the destination buffer size is not checked, causing some characters to override values of contiguous variables in memory. The buffer overflow vulnerability is often used by many attackers to inject vulnerable code inside variables and to manipulate the program instruction order to execute it.
Over the years, many countermeasures have been developed to secure programs against buffer overflow, but attackers have always managed to find a way to elude them. One of the first countermeasure consisted in a
4 CHAPTER 1. INTRODUCTION nary before the return address stored on the stack, which was introduced by compilers in order to detect if there was a buffer overflow during execution and then make the program quit instantly. Unfortunately, the first imple-mentations of this solution used a fixed canary that did not change between different invocations of the program, and which made it possible for attackers to overwrite the canary with the same value, consenting them to bypass the whole countermeasure.
Therefore, compilers developers began to work on an enhanced version of this countermeasure, which required the canary to be generated randomly at each function invocation: theoretically this manoeuvre should have made it impossible for malicious actors to know canary value before program execu-tion. However, even in this case, these actors found a way to reconstruct the value of the canary, typically by exploiting some information leakage of the application.
Years later, even some of the most important computer companies started to study and develop their own version of a countermeasure which could be able to avoid buffer overflows attacks, one of the most prominent was the GCC StackGuard detector proposed at USENIX Security Symposium in 1998 [6]. But still attackers were able to counteract to this new solution thanks to other types of overflows, which were not covered by the newly released countermeasures, like heap-based buffer overflow.
A review of the known attacks and possible defenses was in a paper by C.Cowan et al. [5] published at the beginning of 2000.
Nowadays it is still impossible to write a perfectly secure software against buffer overflows because of the many possibilities that attackers discover, which enable them to exploit program vulnerabilities. Every year many com-puter security competitions are organized to search for all possible attacks on binaries, hoping this would help developers to figure out new defenses for their applications.
For these reasons, and also since buffer overflow is still one of the most common vulnerability (the CVE database CVE Details show that only in 2019 1,247 overflow vulnerabilities were discovered, making it one of the most common types among all 2019 vulnerabilities), we focused our effort on the detection of this particular type of vulnerability.
We have tested our tool using different binaries extracted from different use cases, analyzing the performance of the results and designing future solu-tions that can be employed to enhance detection precision and also add new functionalities to the tool. With our tests we have been able also to iden-tify a new buffer overflow in a firmware installed on a ARM-based router, vulnerability that was never detected before.
2
Background and Motivation
2.1
Binary Analysis
Binary analysis is the technique used to scan programs executables (that are typically in binary format) for different reasons, first of all to find vulnera-bilities and bugs directly inside it. While different binary formats provide features that simplify many binary scan operations (i.e., symbol tables and sections), it is much more difficult to analyze binaries behavior with respect to source code because it contains much less information. For, example in machine code all values are interpreted as integers and there is a finite set of registers used to access all program variables, one at a time, while many high level languages allows programmers to declare variable types and to use an infinite number of variables. Moreover, machine code expressiveness is much lower than the one of any high level language, and for this reason there is a loss of information during compilation process. The information removed by compilation often is about non-executable aspects of the program and ex-poses information about its semantic that is very useful for security analyses, while any vulnerabilities discovery tool strives to reconstruct the same infor-mation from only machine code. Lastly, another disadvantage is introduced by aggressive compilation optimizations that alter an intermediate represen-tation of the source code before producing the final binary executable.
In the last decade, many researchers developed numerous projects in bi-nary analysis, steadily improving this field of computer science.
Modern binary analyses are based on control-flow and data-flow inspec-tion of programs. Each of them is a different applicainspec-tion of the concept of flow-graph applied to a different property of the binary.
2.1.1 Control-Flow Graph
A Control-Flow Graph (CFG) is a representation of the instructions and branches contained in a program and order in which they are executed. Typ-ically each node in a control flow represent a single instruction (or a sub-set of instructions without branches) and each of them can be connected by arrows to one or more node of the diagram. Nodes with outgoing links to more than
2.1. BINARY ANALYSIS 7 one instruction are called branch instructions and contain conditions which are useful to choose which of the following instructions will be executed. An example of a simple CFG is represented in Figure 2.1 : I1, I2,. . . , I7 are simple instructions and C1, and C2 are branch instructions.
I1 I2 I3 I4 I5 I6 I7 C1 C2
Figure 2.1: An example of a Control-Flow Graph
For a binary analysis it is important to build or recover a CFG of the input binary in order to have a correct representation of the possible outcome of the program execution. Branch instructions conditions are analyzed by tools that help understanding when it is possible that an instruction or control-flow path is taken or, more importantly, they help identifying dead instructions, that are instructions which are never executed, since they include a condition a condition that can never be true.
2.1.2 Data-Flow Graph
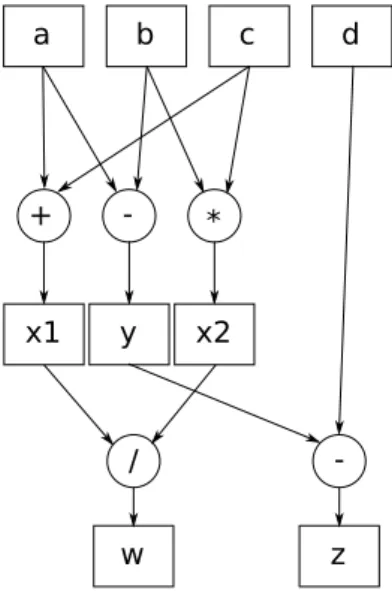
Another important property of binaries for analyses is the data-flow. While control-flow takes into account how instructions are related during execution, data-flow keeps track of values flows between variables. A data-flow graph or DFG contains different types of nodes: a variable node defines where and
8 CHAPTER 2. BACKGROUND AND MOTIVATION how a variable is defined (the incoming edge indicates how it is defined and the outgoing one how it is used), an operational node defines operation that can transform variables values . Figure 2.2 shows an example of what a DFG looks like. a b c d + - * x1 y x2 / w z
-Figure 2.2: An example of a Data-Flow Graph
DFG are very useful in binary analyses: they can be exploited to recover value ranges for variables and for pointer-aliases analyses too. Pointer-aliases analyses are also very important in control-flow reconstruction, because they can help finding the targets of indirect jumps and calls. Data-Flow analyses are able to identify malicious assignments on variables, or bad behavior in the program that can lead attackers to execute malicious code, like the already mentioned buffer overflow exploit.
2.2
Static vs. Dynamic Analysis
Nowadays binary analysis is grouped into two macro-areas based on two different approaches for vulnerability detection in already compiled programs, and each of them has its own pros and cons:
• Dynamic Binary Analysis • Static Binary Analysis
2.2. STATIC VS. DYNAMIC ANALYSIS 9
2.2.1 Static binary analysis
Static binary analysis is the technique to scan input binary without executing or emulating it, but by merely reading the machine code contained in the input. This kind of binary analysis aims at understanding the assembly code, reconstructing which function calls other functions and which memory area is pointed by any pointer in each execution time. In order to work properly, static binary analysis often needs to draw some assumptions on input binaries and make massive use of different advanced mathematical tools. Anyway, even with these measures, sometimes it still is not able to obtain precise results, thus demanding the use of different statistical tools to make predictions on the hypothetical execution of the binary, i.e., which branch is taken at a given point by a conditional instruction. To sum up, the main challenges in static binary analysis are:
• Value ranges for variables
• Memory Areas pointed by different pointers (also known as pointer aliasing)
• Branch conditions predictions
Clearly though, the main complication of this kind of binary analysis consists in the difficulty in reasoning about low-level code because of its nature, leading to the recent birth of different intermediate languages that try to make it Static Binary Analysis easier. A more in depth view of the most used intermediate languages will be covered in a later chapter.
Finally, one of the biggest project on static binary analysis in recent years has been BitBlaze [22], that is a complete binary analysis framework for computer security, with a component called Vine studied specifically for static analyses of binaries.
Intermediate Languages
For many years static analysis of binary was built on top of reverse engineer-ing, an approach that tries to translate back binary into its source code. The main idea behind this approach was to analyze the recovered source code for vulnerabilities, but it proved to be quite ineffective in practice: due to compiler optimizations, the recovered source code turned out far different from the original code and in many cases was very difficult to understand by analyzers. In an attempt to resolve these complications, researchers started to design languages that had binary analysis as the main goal. The idea
10 CHAPTER 2. BACKGROUND AND MOTIVATION of an intermediate language between the high level code and the machine code was not new, in fact compilers already used intermediate languages to simplify code optimization process, but those intermediate languages were not well suited for computer security analyses. This is why new intermediate representation languages (IL) were born, like Vine, the Bitblaze intermediate language or BIL for Binary Analysis Platform [3]. The latter is a type of IL that represents the operational semantics of the binary input on which all analyses will depend, implying also that any error or bug in the IL might invalidate all previous analyses and emphasizing the critical role of IL design. Furthermore, the translation to IL of a binary, a process also called lifting, starts from an input language that is incredibly complex: ARM and Intel specifications of processors machine code are reported in manuals of 6,354 and 4,700 respectively. The research of Kim, Soomin et al. in 2017 [10] tested recent ILs of the most known binary analysis tools looking for se-mantic bugs. The research tested the expressiveness of each intermediate language by looking at two important characteristics of any IL: explicitness and self-containment. An IL is explicit when no instruction updates more than one variable, a property very useful for control-flow and data-flow based analyses. On the other hand IL is self-contained when it represents all the binary characteristics without relying on external functions or components. It also means that the IR is side-effects free. For example QEMU IL, called TCG, uses some external functions for some logical operations, and for this reason it is not self-contained. While self-containment is very important for the expressiveness of the IL, a non-explicit IL is not always less expressive than an explicit one. Thanks to their works, the researchers found 23 se-mantic bugs in three state-of the art lifters, which helped us choosing a lifter based on LLVM IR.
2.2.2 Dynamic binary analysis
Dynamic binary analysis is based on the execution or emulation of the in-put binary inside an instrumented environment, that allows to test program with real inputs, by not only supporting the simulation of execution, but also consenting its modification and without side-effects on the outside environ-ment. It is an efficient approach in terms of response time and complexity of design, but it does not ensure that the whole code is covered. The main problem of this type of analysis is that the input domain can be very large even for a simple program, thus making it essentially impossible to cover the whole domain by enumerating of all possible value, even with the help of most powerful supercomputers.
2.2. STATIC VS. DYNAMIC ANALYSIS 11 It is precisely for this reason that researchers developed some tools that try to cover as much input domain as possible, drawing information from dif-ferent approaches. Nowadays, the most common dynamic analyses are based on input fuzzing, a technique that scans the program for invalid input which could make it crash or behave unexpectedly. Since these input data can be generated randomly or algorithmically, one of the most common solution is to generate input that tries to cover all possible conditions for branches in-structions.
A study conducted by Shoshitaishvili et al. [21] on binary offenses identi-fies two common types of fuzzing used in dynamic analyses: coverage-based fuzzing and taint-based fuzzing. Coverage-based fuzzing tries to find input that maximize the coverage of executed code. The idea behind this approach is that executing most instructions in the code raises the probability of dis-covering an hidden vulnerability in the program. While this can be true in many cases, it is also possible that an instruction leverages a vulnerability only when it is executed with some specific inputs, so this approach does not ensure that all vulnerabilities are discovered. This type of approach is used in a famous state of the art fuzzer, named American Fuzzy Lop or AFL [25]. Taint-based fuzzers instead track how the input is propagated inside the pro-gram (typically observing the function call stack) and use this information to modify input that are generated next. These fuzzers are typically use-ful when the analysis has a specific target function to track, but in a more general approach it is very difficult to understand how to modify input in order to identify an hidden vulnerability. Taint-based fuzzers are still under development, but one of the most promising is the one presented in the pa-per by S. Bekrar et al. [2] Another famous fuzzer, maybe the most powerful fuzzer actually available, is OSS-Fuzz [19], developed by Google : it is able to generate 4 trillion inputs a week, and it is mainly used to search bugs in Google’s software, like Google Chrome. This fuzzer is so effective that, until now, it has been able to find over 16,000 vulnerabilities in more than 250 open-source projects
The paper by Shoshitaishvili et al. [21] also identifies another more com-plex and recent approach used in dynamic binary analysis, the dynamic sym-bolic execution. This technique represents a mix of static and dynamic ap-proaches: first the binary is statically analyzed to identify and understand expressions and conditions inside of it; then a symbolic representation of each of them is built, highlighting how input can change their values; in the end these symbols are used as insights by a fuzzer for input generation. Dynamic symbolic execution has the added value of a more concrete knowledge of the program semantic compared to to classical fuzzers, allowing the analyzer to target specific states of the program by simply looking at conditions or
ex-12 CHAPTER 2. BACKGROUND AND MOTIVATION pressions and propagating its symbols backwards to the input. This powerful technique can be used for different purposes: classical dynamic symbolic ex-ecution engines employ it to directly find vulnerabilities inside the program
Dynamic binary analysis is sometimes also used to validate results of static binary analysis, typically to narrow down the number of false positives reported.
2.3
State of the Art
As of today, the most popular static binary analyzers are BAP and BitBlaze, while for the decompilation of binaries business tools like IDA Pro and open-source projects like radare2 are commonly used.
On the subject of reverse engineering, there are two main open-source projects that use LLVM IR as intermediate representation language (IR): Remill and Retdec. Retdec was developed by Avast [11] and is the most recent reverse engineering project, it already offers many advanced func-tionalities like RTTI and Class Hierarchy reconstruction for C++ projects, instruction idioms recognition and stack structure reconstruction. Actually Retdec has been opened to the public and its source code is accessible on Github, and, even if it is still an ongoing project, its performances are already incredible: it is able to lift a complex binary of some megabytes in a couple of minutes at most.
Unfortunately though, the decompilation feature to C language is not perfect yet and the output code can still come out as “dirty”, with a lot of goto instructions, making it a bit more difficult to analyze compared to standard C code.
2.3.1 BAP: Binary Analysis Platform
BAP is the third version of the project developed by David Brumley et al. [3] to build a unified platform for binary analysis. The first version of the project started with a simple decompiler, called asm2c, that translated binary code into C code and then performed analyses on the high-level language. Then developers opted for a custom IR, called Vine, that was based on VEX, the IR developed and used by Valgrind [15] (another state of the art project that will be discussed later). In this last version researchers tried to fix Vine in order to make all code side-effects explicit in the IR, allowing to perform syntax-based analyses. BAP is now formed by two components: a front-end that takes the binary as input, search for executable code in it and translate it into Vine code, and a back-end that performs analyses based on
2.3. STATE OF THE ART 13 Vine language. Additionally, the back-end can be interfaced with other tools to enrich analyses results (i.e., it can be interfaced with an SMT solver to compute better data-flows or with Intel Pin framework for dynamic symbolic execution). Another feature introduced with the last version of BAP are the Verification Conditions (or VC): BAP can analyze the program and build particular conditions that can be verified and tested with specific inputs over all program execution.
Currently BAP supports only binary compiled for x86 and ARM archi-tectures.
2.3.2 Valgrind
While BAP represents the state of the art of static binary analysis, the project developed by Nethercote et al. [15], called Valgrind, represents the actual state of the art for dynamic binary analysis. Valgrind is a binary instrumentation framework designed to build heavyweight dynamic-binary analyses and shadow values tools. Shadow values tools are particular dynamic-binary analysis that, during program execution, replace each emu-lated register value with a description of that value, allowing the recovery of a brief history of that value for each register. In addition to simple instrumen-tation framework, shadow value tools have additional complex requirements that must be met for their building. Valgrind paper defines nine requirements that are grouped into four categories.
A shadow tools has to keep a program state that represents memory areas used by variables. Then, each possible machine instruction must be instru-mented in order to populate descriptive values about each shadow value.
All analyses and interpretations are performed using an intermediate rep-resentation language developed by Valgrind researchers: this intermediate representation language, called VEX, had received a lot of changes until the third implementation, when it was finally reliable enough to be used as de-fault IR. VEX language is an architecture independent, SSA language, simi-lar to RISC machine languages composed by blocks called superblocks. Each superblock contains a list of instructions and each instruction is composed by one or more expressions depending on the behavior of the instruction. Instruction expressions can be represented in two ways: a tree VEX IR con-tains expressions arranged in tree-form, or a flat VEX IR that concon-tains only linear expressions. It is always possible to convert a tree VEX IR into a flat VEX IR, and viceversa.
Valgrind is composed by a core program and additional plug-ins that are attached to the core when the tool starts. With this architecture,
Val-14 CHAPTER 2. BACKGROUND AND MOTIVATION grind users can easily implement new tools by writing only new plug-ins, reusing the same core features. The core is responsible for translation into the VEX language using the disassemble-and-resynthetize (D&R) approach, in contrast with more common copy-and-annotate (C&A) approaches used by other dynamic instrumentation frameworks.
Thanks to its ability, Valgrind is actually used in different common tools employed in many computer security fields: Memcheck, developed by Seward Julian and Nethercote Nicholas [20], is a tool capable of identifying frequently undefined errors vulnerabilities, common in programs written with unsafe imperative languages like C or Fortran; TaintCheck, developed by Newsome James and Song Dawn Xiaodong [16], is a dynamic taint analysis tool able to follow input propagation from specific source functions in instrumented binaries, automatically detecting input correlation of exploit attacks; Re-dux, developed by Nethercote Nicholas and Mycroft Alan [14], is a dynamic data-flow tracer tool able to build dynamic data-flow graphs (or DDFG) in analyzed binaries, that represents the entire computation history of the pro-gram. Redux, in particular, developed a whole new way to analyze program using DDFG, allowing also to understand how values can affect the outside environment.
These are only few of the many use-cases in which Valgrind has been used to develop dynamic binary analysis tools.
2.3.3 BitBlaze
BitBlaze is a project conducted by Dawn Sang et al. [22] that aims at provid-ing basic and common useful tools for binary analyses in computer security, and from those it builds new complex and effective solutions to security problems.
It was designed with accuracy and extensibility in mind, building models that can accurately represent program execution and re-using core function-alities for more sophisticated and complex analyses. BitBlaze developers decided also to mix together static and dynamic binary analyses to benefit from both advantages for their results.
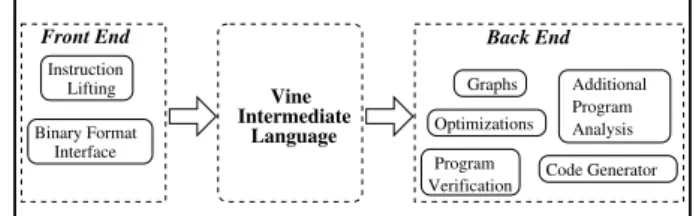
To achieve that, BitBlaze relies on three components: Vine component for static analyses tasks, TEMU component for dynamic analyses tasks and Rudder component for mixed concrete and symbolic analyses based on the other two components. Figures 2.3, 2.5, and 2.4 from the research paper offer an overview of these Bitblaze components.
Rudder is the most innovative part of the project: it takes as input sym-bolic specification computed by TEMU and explores execution path
condi-2.4. LLVM : A MODULAR COMPILER FRAMEWORK6 D. Song et al. 15 Instruction Lifting Binary Format Interface Front End Code Generator Optimizations Vine Language Intermediate Back End Program Verification Graphs Additional Program Analysis
Fig. 2. Vine Overview
The Vine end supports a variety of core program analysis utilities. The back-end has utilities for creating a variety of different graphs, such as control flow and program dependence graphs. The back-end also provides an optimization framework. The optimization framework is usually used to simplify a specific set of instructions. We also provide program verification capabilities such as symbolic execution, cal-culating weakest preconditions, and interfacing with decision procedures. Vine can also write out lifted Vine instructions as valid C code via the code generator back-end.
To combine static and dynamic analysis, we also provide an interface for Vine to read an execution trace generated by a dynamic analysis component such as TEMU. The execution trace can be lifted to the IL for various further analysis.
3.2 The Vine Intermediate Language
The Vine IL is the target language during lifting, as well as the analysis language for back-end program analysis. The semantics of the IL are designed to be faithful to as-sembly languages. Table 1 shows the Vine IL.
The base types in the Vine IL are 1, 8, 16, 32, and 64-bit registers (i.e.,n-bit vec-tors) and memories. A memory type is qualified by its endianness, which can be either little(e.g., for little-endian architectures like x86),big(e.g., for big-endian archi-tectures such as PowerPC), ornorm for normalized memory (explained later in this section). A memory type is also qualified by the index type, which must be a regis-ter type. For examplemem t(little, reg32 t)denotes a memory type which is little endian and is addressed by 32-bit numbers.
There are three types of values in Vine. First, Vine has numbersn of type τreg.
Sec-ond, Vine has memory values {na1 → nv1, na2 → nv2, ...}, where nai denotes a number used as an address, and nvi denotes the value stored at the address. Finally, Vine has a distinguished value ⊥. ⊥ values are not exposed to the user and cannot be constructed in the presentation language.⊥ is used internally to indicate a failed execution.
Expressions in Vine are side-effect free. The Vine IL has binary operations♦b(“&” and “|” are bit-wise), unary operations ♦u, constants,letbindings, and casting. Cast-ing is used when the semantics requires a change in the width of a value. For example, the lower 8 bits ofeaxin x86 are known asal. When lifting x86 instructions, we use casting to project out the lower-bits of the correspondingeaxregister variable to anal register variable whenalis accessed.
Figure 2.3: An overview of Bitblaze Vine component
BitBlaze: A New Approach to Computer Security via Binary Analysis 13
Engine
Taint Analysis Semantics
Extractor Emulated System TEMU API TEMU Plugin A TEMU Plugin B TEMU Plugin C
Fig. 5. TEMU Overview
DynamoRIO, Pin) only provide a local view (i.e., a view of a single user-mode
pro-cess). This is particularly important for analyzing malicious code, because many
attacks involve multiple processes, and kernel attacks such as rootkits have become
increasingly popular.
– A whole-system emulator provides an excellent isolation between the analysis
com-ponents and the code under analysis. As a result, it is more difficult for the code
under analysis to interfere with analysis results.
The design of TEMU is motivated by several challenges and considerations:
– The whole-system emulator only provides us only the hardware-level view of the
emulated system, whereas we need a software-level view to get meaningful analysis
results. Therefore, we need a mechanism that can extract the OS-level semantics
from the emulated system. For example, we need to know what process is currently
running and what module an instruction comes from.
– In addition, many analyses require reasoning about how specific data depends on
its data sources and how it propagates throughout the system. We enable this using
whole-system dynamic taint analysis.
– We need to provide a well-designed programming interface (i.e., API) for users
to implement their own plugins on TEMU to perform their customized analysis.
Such an interface can hide unnecessary details from users and reuse the common
functionalities.
With these considerations in mind, we have designed the architecture of TEMU, as
shown in Figure 5. We build the semantics extractor to extract OS-level semantics
in-formation from the emulated system. We build the taint analysis engine to perform
dy-namic taint analysis. We define and implement an interface (i.e, TEMU API) for users to
easily implement their own analysis modules (i.e. TEMU plugins). These modules can
be loaded and unloaded at runtime to perform designated analyses. We implemented
TEMU in Linux, and at the time of writing, TEMU can be used to analyze binary code
in Windows 2000, Windows XP, and Linux systems. Below we describe these three
components respectively.
Figure 2.4: An overview of Bitblaze TEMU component
tions in the binary, automatically discovering behaviors hidden by particular complex conditions. The Mixed Execution Engine (MEE) behind Rudder is able to collect necessary information from symbolic execution and it is also able to formulate a symbolic program of the binary: in fact when a symbolic execution marks an instruction to be executed, it is first lifted to the Vine IL, allowing to reconstruct a symbolic version of the program in the end . In addition to it, MEE uses also an SMT solver to reason about symbolic expressions provided by TEMU.
2.4
LLVM : a modular compiler framework
Low Level Virtual Machine (LLVM ) framework was born from the effort of researchers C. Lattner and V. Adve [12] who wanted to design retargatable compilers that, starting from the same code, were able to produce executa-bles for different architectures. LLVM ’s most valuable feature is that it is able to easily introduce new optimizations in the compiler without specific knowledge, neither of the input high level language nor of the target architec-tures. This feature was achieved thanks to the well-engineered design of the
16 CHAPTER 2. BACKGROUND AND MOTIVATION BitBlaze: A New Approach to Computer Security via Binary Analysis 17
5
Rudder: The Mixed Concrete and Symbolic Execution
Component
In this section, we give an overview of Rudder, the mixed concrete and symbolic
execution component of BitBlaze Binary Analysis Platform, describing its
compo-nents for performing mixed execution and exploring program execution space and its
implementation.
5.1
System Overview
We have designed and developed Rudder, to perform mixed concrete and symbolic
execution at the binary level. Given a binary program and a specification of symbolic
inputs, Rudder performs mixed concrete and symbolic execution and explores multiple
execution paths whenever the path conditions are dependent on symbolic inputs. By
doing so, Rudder is able to automatically uncover hidden behaviors that only exhibit
under certain conditions.
Figure 6 shows a high level picture of Rudder. Rudder consists of the following
components: the mixed execution engine that performs mixed concrete and symbolic
execution, the path selector that prioritizes and determines the execution paths, and the
solver that performs reasoning on symbolic path predicates and determines if a path is
feasible. Rudder takes as inputs a binary program and a symbolic input specification. In
TEMU, the binary program is executed and monitored. Rudder runs as a TEMU plugin
to instrument the execution of the binary program. During the execution, Rudder marks
some of the inputs as symbolic according to the symbolic input specification. Then
the mixed execution engine symbolically executes the operations on symbolic inputs
and data calculated from symbolic inputs. When a symbolic value is used in a branch
condition, the path selector determines, with assistance of the solver, which branches
are feasible and selects a branch to explore.
5.2
Mixed Execution Engine
Determine Whether to Symbolically Execution an Instruction. For each instruction,
the mixed execution engine performs the following steps. First, it checks the source
operands of that instruction, and answers whether they are concrete or symbolic. If
all source operands are concrete, this instruction will be executed concretely on the
emulated CPU. Otherwise, the mixed execution engine marks the destination operand
as symbolic, and calculate symbolic expressions for the destination operand. To mark
Engine Execution Mixed Symbolic Input Specification Binary Program Path Selector Solver Rudder
Fig. 6. Rudder Overview
Figure 2.5: An overview of Bitblaze Rudder component
framework and also through the effort put in the implementation of the Inter-mediate Representation Language LLVM IR. In less than ten years LLVM has managed to become the main competitor of the old and great GCC compiler and it has developed so much that now Clang, that is C and C++ compiler based on LLVM , is the default compiler used by Apple in their operating systems .
2.4.1 LLVM IR
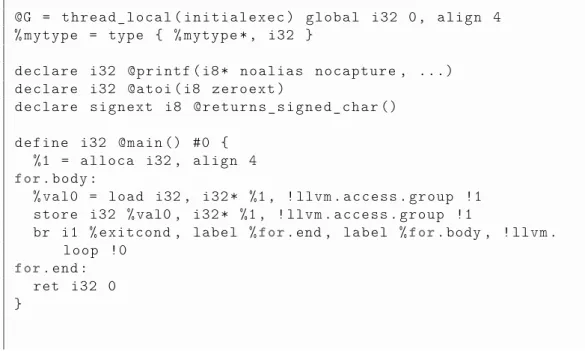
The core strength of the LLVM framework is its well engineered intermediate representation language named LLVM IR: it is used to translate any input high level language into a middle form that can be easily manipulated and optimized independently from the target architecture and the input language. The Listing 2.1 contains an example of a LLVM IR sample program.
@G = t h r e a d _ l o c a l ( i n i t i a l e x e c ) g l o b a l i32 0 , a l i g n 4 % m y t y p e = type { % m y t y p e * , i32 } d e c l a r e i32 @ p r i n t f ( i8 * n o a l i a s n o c a p t u r e , ...) d e c l a r e i32 @ a t o i ( i8 z e r o e x t ) d e c l a r e s i g n e x t i8 @ r e t u r n s _ s i g n e d _ c h a r () d e f i n e i32 @ m a i n () #0 { %1 = a l l o c a i32 , a l i g n 4 for. body :
% val0 = load i32 , i32 * %1 , ! llvm . a c c e s s . g r o u p !1 s t o r e i32 % val0 , i32 * %1 , ! llvm . a c c e s s . g r o u p !1
br i1 % exitcond , l a b e l %for. end , l a b e l %for. body , ! llvm . loop !0
for. end : ret i32 0 }
2.4. LLVM : A MODULAR COMPILER FRAMEWORK 17
; Some u n n a m e d m e t a d a t a nodes , w h i c h are r e f e r e n c e d by the n a m e d m e t a d a t a . !0 = !{!" z e r o "} !1 = !{!" one "} !2 = !{!" two "} ; A n a m e d m e t a d a t a . ! name = !{!0 , !1 , !2}
Listing 2.1: An example of LLVM IR Module
LLVM IR’s structure is very similar to assembly language, with three-addresses statements and not so many high level constructs, but at the same time introducing some important features that increase its expressiveness: it has a full type system for variables, it allows the definitions of functions and local or global variables and, most importantly, it is in Static Single Assignment form (SSA).
Definition. A language is in SSA form when any modification or use of
variables leads to the definition of a new variable.
This property makes it very easy to decouple different uses of the same variable in different statements of the program. This also means that theo-retically it is possible know to which value a variable will assume for every single statement in any execution moment (or at least a range of possible values). The use of this structure also facilitates tracking the flow of a vari-able with the so called define-use chains (or def-use chain): in this type of chain any ring is composed by an use of a variable previously defined in the program and a definition of a new variable. If two rings are consecutive, the second ring must contain a use of the variable defined in the first one. Formally a def-use chain can be defined as following:
Definition. A define-use chain in an SSA form language is a ordered
se-quence of instructions < i1, . . . , in> where the following property must hold:
if < i, j > is a sub-sequence of the def-use chain ⇒ ∃v s.t.
v ∈ def (i) v ∈ use(j) where def (i) is the set of variables defined by i and use(j) is the set of variables used by j.
SSA form languages are preferred for data-flow analysis, in fact thanks to SSA property each variable in the DFG has a single definition node.
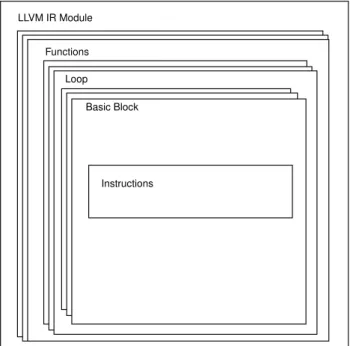
The structure of a single LLVM IR compilation unit, also called Module, is composed by blocks: the top-most block is the Module block that contains all other blocks in the module. Inside a Module blocks there are different
18 CHAPTER 2. BACKGROUND AND MOTIVATION Function blocks, each of them representing a single function in the program. One Function block can be formed by only Basic-block blocks or also by Loop blocks (containing only Basic-blocks). A Basic-block is a block of instructions that are executed always in the same order and it is defined typically by a label at the beginning and a ending instruction (called also Terminator Instruction) that connects it to other blocks. This type of block is the unit that compose the CFG of the LLVM IR Module. An high-level overview of a generic LLVM IR Module structure is represented in the Figure 2.6
LLVM IR Module
Functions Loop
Basic Block
Instructions
Figure 2.6: A representation of the structure a LLVM IR Module Inside the Basic-blocks there are only Instruction blocks, each of them representing a single LLVM IR Instruction. Additionally, a Module can also be enriched with other information about the program using metadatas: a metadata is a non-executable instruction or variable that can be attached to each component of the module, adding additional information that can be useful for optimizations or debugging.
The most relevant aspect for developers using LLVM Framework is that each element of the IR Language is implemented in a beautiful and well-engineered hierarchy of C++ classes in the LLVM libraries. The hierarchy starts with the top most class, that is Value: anything inside the LLVM IR is a direct or indirect subclass of it. At the same time, any value inside the IR can be an User of other values and the relation between user and used values is represented by Use class. Then, using the polymorphism properties
2.4. LLVM : A MODULAR COMPILER FRAMEWORK 19 of C++, all other types and constructs of IR are implemented. Some of them are: • Constants • Instructions • Basic Blocks • Functions • Loops
Each of them inherits or overrides Value’s methods depending on the behav-ior. All the objects in the libraries are implemented following at least C++ 11 standards, making it very easy for developers to iterate over a vector of variables uses, for example using standard methods “.begin()” and “.end()” or the most common standard libriaries of C++. Anyway, in order to en-hance performance, LLVM designers decided also to reimplement some of the basic types in C++, like arrays with ArrayRef or SmallVector and strings with StringRef and Twine. Third party developers have the possibility to continue using standard C++, but if they need to increase the performance of their tools they have to take into account also LLVM base classes. All these aspects are well documented inside the LLVM programmer manual which lists many examples that help developers with design decisions.
LLVM Passes
All optimizations and transformations performed by LLVM are built on top of the concept of Pass, that is a component which has to perform a spe-cific operation on the input module at a spespe-cific granularity. Passes can be categorized into two classes:
• Analysis Pass: a pass that reads the input module and does not modify it, retrieving information that could be useful for other passes.
• Transformation pass: a pass that actually modifies the input producing a new module. It can invalidate previous analyses.
Passes are used by LLVM optimizer tool, called opt, that builds a pass pipeline in which passes are ordered based on their dependencies on other passes. Each pass can have different granularity, that specifies on which IR level the pass is iterated:
20 CHAPTER 2. BACKGROUND AND MOTIVATION • Module pass: a pass that iterates once on the whole input module
having the possibility to modify and analyze any component.
• CallGraphSCC pass: a pass that iterates over the module call-graph, letting the developer decide in which order to visit it (depth-first or breadth-first).
• Function pass: a pass that iterates on each function of the input module and that can modify a function and all its internal component one at a time.
• Basic Block pass: a pass that iterates over the basic blocks of the module and can modify only instructions inside of it.
• Loop Pass: a pass that iterates over all the loops inside the module and that can modify only the instructions inside it
• Instruction Pass: the most granular type of pass, it iterates over all instructions of the module and it can modify one at a time.
An important note must be discussed about CallGraphSCC passes: since a CallGraph can contain loops caused by recursive functions or groups of functions calling each other, it is transformed into an acyclic graph before execution using Strongly Connected Component (or SCC) algorithms. The default algorithm used by LLVM is the Tarjan’s SCC algorithm, defined by Robert Tarjan in its study about depth-first visiting of linear graphs [24]. Eventually, developers can modify its behavior by overriding the default pass constructor. Then, developers have to override the “runOnSCC” method, that analyzes one SCC of the CallGraph at a time. Each SCC is formed by one or more functions, with relation links that represent which function calls other functions inside the SCC. Finally, developers are able to analyze the whole CallGraph overriding the method “doFinalization” that takes as input the CallGraph without SCCs.
LLVM Pass Managers
The passes pipeline in LLVM is built by a specific class called PassBuilder. After building, another class (the Pass Manager) executes each pass in or-der and registers which analyses have been performed and which need to be re-executed. This Pass Manager supports the class hierarchy of passes described in the previous section. Each pass can declare, through an over-loaded function, on which analyses and transformation it depends on; after that, PassBuilder and PassManager can ensure that they are executed in the
2.4. LLVM : A MODULAR COMPILER FRAMEWORK 21 correct order. In the LLVM documentation it is assured that each pass can depend only on specific types of other passes, which are:
• Module Pass can depend on any type of pass.
• CallGraphSCCPass can depend only on other CallGraphSCCPass. • Function Pass can depend on other function passes and basic block,
loop pass or instruction pass.
• Loop pass can depend on other loop passes and basic block or instruc-tion pass.
• Basic Block Passes can depend on other basic block passes or Instruc-tion passes.
• Instruction Pass can depend only on other Instruction passes.
Unfortunately, the Pass Manager is affected by a bug due to its design, which invalidates the dependencies of passes on other types of passes: the problem is caused by the instantiation of each Pass inside the Pass Manager, which leads to a crash of the program when a pass tries to access a result for a unit from different the one that is being analyzed in that moment from that instance.
New Pass Manager The above-mentioned problem, alongside other known disadvantages of the current implementation, lead LLVM developers to work on a new pass manager restructuring all the previous designs. With the new pass manager, passes are classified into two different class hierarchies: Anal-ysisInfoMixin and PassInfoMixin. In this way it is easier to identify which passes can modify the input module. Additionally, the passes do not declare if they modified the module with a simple boolean variable, but they return a set of Preserved analyses and transformations at the end of their execution. In this way the pass manager can reschedule only needed analyses and not all of them, while the old pass manager re-executed all previous analyses. Another important change has been introduced in the new pass manager to simplify the access to analysis results: each analysis can declare a specific in-ternal type named “Result” that must be returned at the end of the analysis. The new pass manager registers all analyses in the pipeline and cache also results for already processed units. During the execution each pass can access the instance of the pass manager and ask for a particular result of analyses. If the analyses has a different granularity, the pass can access a particular
22 CHAPTER 2. BACKGROUND AND MOTIVATION proxy built by pass manager to facilitate the communication among those types of passes.
At this moment the new pass manager is still in beta state, but since LLVM 7.0.0 both versions coexist and developers can choose which type of pass manager to use for their analyses.Moreover, the new pass manager still has some disadvantages (no possibility to define pass-specific command line options for example) so we had to use the old pass manager approach for our project.
2.5
REV.NG : a unified binary analysis framework
REV.NG [8] is a unified binary analysis framework covering a very large set of processor architectures, and at the same time it is also a decompilation and translation tool that can translate a binary compiled for a specific architec-ture into an executable binary for a different architecarchitec-ture. Differently from BAP , REV.NG is able to target so many architectures because it relies on QEMU (a generic open-source machine emulator and virtualizer) as front-end for input binaries and it uses Low Level Virtual Machine IR (LLVM IR), which is architecture-independent by design, as intermediate representation language for the analyses. Thanks to this decision, REV.NG has the ability to manipulate binary from different architectures without having different specific components for each of them (while other common binary analysis tools have to). The Figure 2.7 from the original paper shows an overview of the system behind REV.NG .jump, all the destination basic blocks might not be considered part of the function, leading to a loss in accuracy.
Another issue is deciding whether a certain basic block is the entry point of a function or not. The presence of an explicit function call to its address is a strong indication, but it may not always be available. Specifically, a certain function might never be called
directly but only through a function pointer, a C++virtual call, or a
tail call.
Further, several common challenges emerge while trying to identify function boundaries across architectures. In the following we report some of the most relevant:
Call thunks. In ISAs where the program counter is not address-able, it is a common practice to perform a function call to the next instruction so that the program counter becomes available on the stack or in the link register. The destination of such a function call should not be mistakenly interpreted as the entry point of an actual function.
noreturnfunctions. A noreturn function, in C terms, is a
func-tion that never returns (e.g., exit or longjmp). These funcfunc-tions are sometimes called through a function call instruction and not through a simple jump. This leads to a spurious path from the call site to the next instruction, which might even be part of a distinct function.
Shared code. Two functions may share a portion of their bodies, in particular, two hand-written assembly functions might share the footer or a sequence of instructions for error handling. Calls to the middle of a function. In certain cases, a function
might have multiple entry points. This case is mostly seen in hand-written assembly and it is usually employed to provide a faster version of a function that does not verify certain precon-ditions that are known to hold.
Tail calls. Tail calls appear in the code as simple unconditional jump instructions, and, therefore, have to be handled in a way that prevents them from being mistakenly identified as part of the function-local CFG.
3. First Steps: Binary Lifting and a Basic CFG
This section discusses preliminary steps on how a high-level pro-gram representation and a basic control-flow graph is obtained from binary code. Leveraging the ISA-independent QEMU binary lator, binary code is lifted into QEMU IR which can then be trans-lated into LLVM IR. Starting from this LLVM IR, a set of analyses (OSRA and SET) [6] recover a basic control-flow graph.
3.1 An ISA-independent Binary Analysis Framework A primary objective of our work consists in developing ISA-independent analyses. While this is challenging in itself, supporting different instruction sets in a unified manner increases these chal-lenges. The ideal situation would be to work on an intermediate representation while abstracting all the details specific to an archi-tecture and making the behavior of each instruction explicit, along with all its side effects. While this has been done in the past [3, 14], from an engineering point of view, it requires a large amount of work, in particular for large and complex CISC instruction sets such as x86 and its successors. Moreover, such an effort has a non-diminishing marginal cost for supporting new architectures, since, in most cases, the opportunities for code reuse in different archi-tectures are limited. Therefore, related works typically focus on a limited set of architectures (usually one or two) and often only support a subset of instructions in complex ISAs like x86, thus ignoring, e.g., vector instructions or floating point instructions.
md5sum.arm Collect JTs fromglobal data
Lift to QEMU IR
Collect JTs from
direct jumps Translate to LLVM IR
new JT Collect JTs from indirect jumps new JT Identify function boundaries md5sum.cfg md5sum.functions
Figure 1. Overview of the REV.NGsystem. JT stands for jump
target, and the new JT notation represents the fact that at least a new jump target has been discovered.
REV.NGdecouples the problem of CFG recovery from
interpret-ing an ISA by offloadinterpret-ing the task of handlinterpret-ing different architectures to an existing abstraction layer: QEMU. The core component of QEMU enabling this kind of abstraction is the tiny code generator (TCG) which translates instructions of a supported ISA into TCG instructions, QEMU’s IR. In emulator mode, QEMU translates its IR to executable code for the host architecture. In our case, instead of generating machine code, we further translate the QEMU IR into a higher level IR, namely the LLVM IR. By employing QEMU’s tiny code generator as a frontend, we obtain an IR from any of the architectures it supports with minimal effort.
While our analyses are agnostic with respect to the underlying IR, leveraging LLVM has several advantages. For example, the LLVM IR is in SSA-form and provides use-def chains out of the box. LLVM has a well-developed and clean API. As a compiler framework, LLVM allows the recompilation of generated code for any of the supported target architectures. Employing LLVM in a binary analysis framework allows building a static binary translator with minimal effort [6].
3.2 From Binary Code to LLVM IR
As shown in Figure 1, the translation process begins by parsing the binary image and loading its segments into memory. Then, the program’s global data is scanned in search of pointer-sized values pointing to an address in the executable segment. Each target address (or jump target), is passed to QEMU, which translates the basic block at the corresponding address into TCG instructions. The sequence of TCG instructions are then expanded to equivalent LLVM IR and collected into a set of basic blocks. These basic blocks, in turn, are collected into a function, known as root.
Destination addresses of direct jumps observed during transla-tion are registered as jump targets for further exploratransla-tion. The pro-cess proceeds iteratively until there are no known untranslated ad-dresses. Then, as we will describe in more detail in the next section, targets of indirect control flow transfers are recovered, and, if nec-essary, fed back to QEMU. Once all the possible jump targets have been recovered, the CFG is analyzed for the recovery of function boundaries, leading to the desired output.
Note that the translation from TCG instructions to LLVM IR is straightforward. In particular, each TCG register (i.e., each part of the CPU state) is mapped onto a local variable in the root function, which we call CPU State Variable (or CSV). In case of recompilation, the register allocator takes care of lowering such variables in the most efficient way.
133
Figure 2.7: An overview of the REV.NG system. JT stands for jump tables, and new JT means that a new jump target has been found
2.5. REV.NG : A UNIFIED BINARY ANALYSIS FRAMEWORK 23
2.5.1 CFG reconstruction
As previously described , CFG is one of the main properties of programs that are utilized by vulnerabilities analyses. For this reason, CFG reconstruction is one of the first challenges in any binary analysis tool. For example, in the already mentioned research by C. Zhang et al.[26] , two common approaches are described, depending on the disassembler type used: while linear disas-semblers are simpler and cover most of the instructions, though they are not very effective in case of indirect calls and jumps, recursive disassemblers are more complex but handle indirect calls and jumps more effectively.
REV.NG has the ability to recover the CFG and the function boundaries for binaries that do not have debug or any other additional information. It can also recover program data-flow using some custom analyses developed by REV.NG researchers. The output produced by REV.NG is an LLVM IR module that can be compiled or processed with standard LLVM passes, allowing to write architecture agnostic analyses. REV.NG workflow starts by searching executable portions in input binary, and then it goes on to reconstructing basic blocks of instructions. Each basic block can be labeled from differ-ent sources, i.e. program differ-entry point, or harvested with custom analyses. When all basic blocks are labeled, their connections are reconstructed fol-lowing direct pointer calls and jump tables in the global data sections (i.e., “.rodata” ELF section). After that, REV.NG starts to build the CFG of the binary: direct jumps can be translated easily into CFG nodes, while indirect branches and indirect function calls are more complex to analyze. It is not always practical to enumerate all possible indirect jumps for those cases, and REV.NG categorizes indirect branches and indirect function calls into three macro-cases:
• Compiler-Generated, function-local CFG • Hand-written assembly
• Indirect function calls
At the moment, REV.NG aims at handling correctly only the first macro-case, while a lot of work still needs to be done in order to achieve proper manip-ulation of the other ones, even if they are often involved in many situations for function boundary detection. In fact, indirect function calls are typically implemented for virtual tables and used for example in C++ methods that can be overridden. Researchers tested REV.NG CFG reconstruction perfor-mances against most known decompilers and binary analysis tools and the results showed that REV.NG was able to recover more blocks than all other
24 CHAPTER 2. BACKGROUND AND MOTIVATION competitors but IDA pro. While IDA pro was able to reconstruct more code than REV.NG , researchers have noticed that REV.NG reconstructed CFG was in general more precise than IDA pro one.
2.5.2 Function-boundaries detection
Another important feature of REV.NG is function-boundaries detection: the tool identifies the entry points of function and assign to each of them the reached basic blocks. At the beginning, all discovered basic blocks are col-lected into a “pool” function called root, then after a subset of basic blocks is identified as the body of a specific function, the root is copied into a new function named either with the real name of the function, if debug symbols are present, or with the address of the starting basic block. This solution al-lows REV.NG to reconstruct also functions that can contain shared code inside their body. Thanks to the Offset Shifted Register Analysis and SET Analy-sis, REV.NG is able to reconstruct also the structure of function stack, and in many cases it is also able to understand which are the function parameters, independently from the call convention of the architecture
REV.NG was born as a thesis project developed inside our university by Alessandro Di Federico and Giovanni Agosta, and currently it is maintained by a large team of developers. Nowadays REV.NG has a stable code and also an ongoing development of a decompiler that can translate a executable binary into High Level C source code.
Recently the team behind REV.NG has released a new version that intro-duced supports for LLVM 9.
2.6
Project Goal
Since programs can be affected by multiple and different types of vulnera-bilities, we decided to set buffer overflow vulnerability, which are among the most widespread ones, as target for our analyses.
The goal of this project is to develop a security tool capable of detecting functions that contain at least a buffer overflow vulnerability and that are reached by a user input inside binary programs. The final program should be able to identify such vulnerable functions in all type of binaries independently from the linking type (statically or dynamically linked libraries) and the architecture (i.e., x86 or ARM). Additionally, the tool should be able to understand when user input is propagate from one function to its callers.
In order to achieve this goal we will face many problems related to dif-ferences of available instructions sets architectures (or ISA). Even if machine