SCUOLA DI SCIENZE
Dipartimento di Chimica Industriale“Toso Montanari”
Corso di Studio in
Chimica Industriale
Classe L-27- Scienze e Tecnologie Chimiche
Study of Co-based hydrotalcite-derived
mixed metal oxides partially modified with
silver as potential catalysts for N
2
O
decomposition
CANDIDATO
Lorenzo BuselliRELATORE
Chiar.mo Prof. Fabrizio Cavani
CORRELATORI
Dott.ssa Magdalena Jabłońska Prof.ssa Regina Palkovits
__________________________________________________________________________________________________________ ______________
Anno Accademico 2015-2016
__________________________________________________________________________________________________________ ______________
Acknowledgements
Firstly, I want to thank Prof. Regina Palkovits, for the opportunity to work in her research group, the ITMC, and my supervisor Prof. Cavani. I want to thank my supervisor in Aachen Magda, who helped and supported me during my internship, and let me grow up under many viewpoints. Then, I want to thank all the people that I met in Germany: my lab and office colleagues, my little Italian team Christian and Francesca, my flatmates Alex and Pippo, and all my other friends who made me feel like at home.
Tengo particolarmente a ringraziare tutti coloro che mi hanno accompagnato durante il mio percorso universitario, da Pisa a Bologna: la mia famiglia di Via Fiorentina 54, poi Togno, Solve, Vanessa e tutti coloro con cui ho condiviso qualcosa a Pisa. Spostandoci in Emilia, voglio ringraziare miei compagni di corso e di laboratorio, il buon Molly, i miei amici siculi-e non, concludendo con i ragazzi del Due Torri.
Un doveroso ringraziamento va a tutti i miei amici piombinesi, con i quali mi sentirei in famiglia anche qualora dovesse passare un secolo tra una visita e l’altra.
Per finire, grazie alla mia famiglia che rappresenta le fondamenta di tutto quello che sto costruendo, e al mio amore Ludovica, che è sempre qui, accanto a me.
Grazie a tutti Thank you Dankeschön
The Erasmus + project is acknowledged for the opportunity to do my exchange and for the financial support.
Acronym list
deN2O: decomposition of N2O deNOx: reduction of NOx
HT-l compounds:hHydrotalcite-like compounds XRD: X-ray diffraction.
TGA: thermogravimetric analysis BET: Brunauer-Emmett-Teller method
H2-TPR: hydrogen temperature-programmed reduction XPS: X-ray photoelectron spectroscopy
IR: infrared
WHSV: weight hourly space velocity
Catalysts code:
CHT-CoxAly: mixed metal oxides obtained by calcination of HT-l compounds with molar ratio of Co/Al = x/y
TD-CoxAly: mixed metal oxides obtained by thermal decomposition with molar ratio of Co/Al = x/y
(X wt.% Ag)CHT-CoxAly: mixed metal oxides obtained by calcination of HT-l compounds with molar ratio of Co/Al = x/y, and subsequently modified with X wt.% of Ag
Contents
Acknowledgements ... 2
Acronym list ... 3
Chapter 1: Introduction ... 5
1.1 N2O as greenhouse and ozone layer depleting gas ... 6
1.2 Catalytic decomposition of N2O ... 8
1.3 Hydrotalcite-like compounds ... 10
1.3.1 DeN2O over hydrotalcite-derived mixed metal oxides ... 12
1.4 Silver-based catalysts ... 14
1.5 Aim of the thesis ... 16
Chapter 2: Experimental section ... 18
2.1 Catalysts preparation ... 19 2.1.1 Coprecipitation ... 19 2.1.2 Thermal decomposition ... 20 2.1.3 Silver-doping ... 20 2.1.4 Rhodium doping ... 20 2.2 Catalysts characterization ... 21 2.2.1 X-Ray Diffraction (XRD) ... 21
2.2.2 Thermogravimetric analysis (TGA) ... 23
2.2.3 N2 physisorption ... 23
2.2.4 Hydrogen temperature-programmed reduction (H2-TPR) ... 25
2.2.5 X-ray photoelectron spectroscopy (XPS) ... 26
2.3 Catalytic tests ... 28
Chapter 3: Results and discussion ... 30
3.1 Catalysts characterization ... 31
3.1.1 XRD, TGA and N2 physisorption ... 31
3.1.2 H2-TPR and XPS ... 40
3.2 Catalytic tests ... 47
3.2.1 Calibration of the IR spectrometer ... 47
3.2.2 Test with empty reactor and various weight hours space velocities (WHSV) ... 48
3.2.3 Catalytic tests over Co(Cu)-(Mg)-Al-Ox ... 49
3.2.4 Catalytic tests over Ag-doped Co-(Mg)-Al-Ox ... 52
3.2.5 Catalytic tests over (1 wt.% Ag)CHT-Co3Al ... 55
3.2.6 Catalytic tests with H2-pretreatment ... 57
3.2.7 Summary ... 58
Chapter 4: Conclusions ... 61
Chapter 1: Introduction
This chapter describes the environmental problems associated with N2O and its possible
abatement through catalytic decomposition of N2O over hydrotalcite-derived mixed
1.1 N
2O as greenhouse and ozone layer depleting gas
Nitrous oxide, also known as laughing gas, has been discovered (1772) by Joseph Priestley. The British chemist used the experimental apparatus designed by Stephen Hales, to discover a host of gases, including N2O, which he called “nitrous air, diminished”.1Humphrey Davy initiated the applications of N2O as anaesthetic, because he noticed the exhilaration effect of nitrous oxide mixed with a certain amount of oxygen. Furthermore, Kenneth M. Swezey published in Popular science (1949) an article with the instruction for the synthesis of N2O dedicated for young scientists (Fig. 1.)..2
Fig. 1 Apparatus for N2O production (Popular Science, 1949, 154, 236-238)
Afterwards, the physicochemical properties of N2O was recognized and published. Under the normal condition nitrous oxide is a colourless gas, with a typical pleasant week smell and a sweet taste. The molecule is slightly polar (μ=0.17) and it has a linear asymmetric structure, with a bond lengths of N-N 1.126Ǻ and N-O 1.186Ǻ, and two resonance structures (Fig. 2.).3
N2O has been present in the atmosphere since life on heart had begun, and its concentration did not change appreciably for thousands of years. The concentration of N2O in atmosphere started to increase rapidly from around 1850, and much more dramatically from 1950 (in parallel with the increase in global population and industrialization) (Fig. 3.).4
Fig. 3 General trend of atmospheric N2O concentration in the atmosphere (ACS Catal. 5, 6397–
6421 (2015))
The main N2O sources are natural processes in lands and oceans. However, for N2O increase is also related to the anthropogenic sources, such as fertilizers use, biomass burning, combustion of fossil fuels, industrial activities (especially adipic acid and nitric acid production) and wastewater treatment, etc.5
Due to significant increase of N2O concentration over years the Third Conference of the Parties (COP-3) UN Framework Convention on Climate Change in Kyoto (1997), approved N2O as one of the most dangerous greenhouse gas emission among CO2, CH4, HFCs, PFCs, SF6. N2O is considered as the third most important greenhouse gas (after CO2 and CH4) due to its long lifetime in atmosphere (114 years), leading to a Global Warming Potential (GWP) of approximately 310 times higher compared to CO2.4–6 Furthermore, N2O is the most important stratospheric-ozone-depleting substance, which depletes the stratospheric ozone in a way similar to CFCs and other ozone-depleting halocarbons. Nevertheless, N2O emissions are not regulated by Montreal protocol,4 which is the international treaty designed to protect the ozone layer by controlling the emissions of the ozone depleting substances. Consequently, the control of N2O emissions has been one of the biggest environmental challenge of the last twenty years.
1.2 Catalytic decomposition of N
2O
N2O emissions abatement can be generally achieved in two different ways by: (i) limiting the formation of N2O,
(ii) employing after-treatment technologies.
Concerning the emission of N2O from the agricultural sector - the major anthropogenic sources - the first approach is the best solution. On the other hand, regarding the control of N2O emission from combustion and industrial sources, the employment of end-of-pipe remediation technologies is the most feasible way.5 In general two ways for N2O abatement are promising form practical and economical point of view:
(i) N2O decomposition,
(ii) N2O reduction with CO, NH3, etc.
One of the biggest advantages of N2O decomposition (deN2O) is the fact that there is no need for additional co-feeding of other gases. Such simplicity led to application of deN2O in adipic or nitric acid production plants, which are the main N2O industrial sources. During nitric acid production, N2O is formed as an undesired by-product in the catalytic oxidation of ammonia over the Pt–Rh gauzes. The possible locations for N2O abatement technologies are marked in a typical flowsheet of a dual-pressure nitric acid plant (Fig. 4.):7,8
Fig. 4 Flowsheet of a dual pressure nitric acid production plant (Applied Catalysis B: Environmental 44 (2003) 117–151)
The primary and secondary possible abatement points concern respectively a modification in the ammonia oxidation catalyst or in the high-temperature zone immediately downstream of the ammonia burner. While the first one is economically unfeasible (the catalytic conversion process is already one of the most efficient processes known), the second one requires extreme thermally stable catalysts. Thus, low temperature applications of catalytic deN2O technologies: ternary (upstream of the expander) or quaternary (downstream of the expander) abatement, seem to be interesting alternatives.
N2O decomposition is an exothermic reaction, but it presents kinetic restriction at low temperature (pure nitrous oxide is stable up to 500 °C, at atmospheric pressure) (Eq. 1):3,9
2N2O → 2N2 + O2 ∆H0 (25°C): 163 KJ/mol (1)
The catalytic deN2O involves the adsorption of N2O at the active centres, followed by its dissociation in a nitrogen molecule and a surface oxygen one. The last step is the regeneration of the active site (*) by recombination of two surface oxygen molecules or by direct reaction between a surface oxygen species and another molecule of N2O9 (Eq. 2-5):
N2O + * N2O* (2)
N2O → N2(g) + O* (3)
O* + O* O2(g) + 2* (4)
N2O + O* → N2(g) + O2(g) + * (5)
The adsorption of N2O takes place on an active metal ion, through electron-back donation from d metal orbitals to the antibonding π* orbitals of N2O. This lead to the destabilization of the N-O bond, and its consequent scission. The catalysts dedicated for deN2O are required to donate electrons for the N2O dissociative adsorption. They include metal surface, oxides with some local charge donation properties, isolated transition metals with multiple oxidation state, but also F-centres and coordinatively unsaturated sites in transition-metal-exchanged zeolites.9,10 The regeneration of the catalyst surface can occur via Langmuir−Hinshelwood (LH) mechanism (Eq. 4) or Eley–Rideal (ER) mechanism (Eq. 5). For most of the catalysts, the desorption of O2(g) through recombination of two surface oxygen molecules is the rate-determining step of deN2O. Therefore, also the oxygen mobility on the surface of the materials is a crucial parameter which limits the efficiency of deN2O for several catalysts.10–12
(i) supported and unsupported metals, (ii) pure and mixed metal oxides, (iii) zeolite-based catalysts.
Most of the pointed catalysts are deactivated in the presence of O2, H2O, NO, SO2, which appear in real exhausts. For example, O2 can adsorb on the catalysts active sites, decreasing the number of available sites for N2O. Therefore, potential catalysts need to maintain high catalytic activity also in real conditions.9
Among the catalysts presented in literature, rhodium-modified materials serve as one of the most active for deN2O.13–15 An important drawback of this group of catalysts is high price of rhodium nitrate (the most efficient precursor in deN2O). However, silver-modified materials represent a promising alternative mainly due to the lower cost of metal precursor, as well as satisfying catalytic activity.16–18 Mixed metal oxides represent a valid alternative to noble metal-modified materials, since they show satisfactory deN2O activity and stability during reaction, and relative low price.5 Mixed oxides prepared by thermal decomposition of hydrotalcite-like compounds (HT-l compounds), serve as one of the most attractive classes of mixed oxide-based catalysts for deN2O. Starting from the work of Kannan et al., several HT-derived mixed metal oxides with different compositions were tested for deN2O, e.g. Cu-Al-Ox, Ni-Mg-Al-Ox, Co-Cu-Mg-Al-Ox, etc.
Although lots of efforts were already done in order to develop satisfactory catalysts for deN2O, the challenges remain to find selective, stable, non-toxic, cheap and working at low-temperatures catalysts.
1.3 Hydrotalcite-like compounds
Hydrotalcite is a hydroxycarbonate of magnesium and aluminium that was first discovered in Sweden (1842). It is described with general formula Mg6Al2CO3(OH)16·4(H2O), and characterized by a typical layered structure similar to the octahedral brucite, Mg(OH)2, but Mg2+ ions are partially replaced by Al3+ ions, leaving a positive charge in the layers. The charge is then compensate by carbonates anions, which lay in the interlayer space together with some water molecules.19 The hydrotalcite-like compounds (HT-l compounds) correspond to the synthesized materials with general formula of:
where MII: divalent metal, e.g. Mg, Ni, Zn, Fe, Co, Cu etc., MII: trivalent metal, e.g. Al, Mn, Cr, Fe, Co etc., A: interlayer anion, e.g. Co32-, NO3-, OH-, etc., x is usually 0.20<x<0.34 and m depends on the amount of water in the interlayer.19,20 (Fig. 5).
Fig. 5 Layered structure of an HT-l compound
Due to wide variety of possible cations and anions that can be introduced within the brucite-like layers it is possible to synthesize compounds with different compositions and stoichiometries. The cations with ionic radius similar to Mg2+, e.g. (M2+ = Mg2+, Fe2+, Co2+, Ni2+, Cu2+, Zn2+, etc. or M3+ = Al3+, Cr3+, Mn3+, Fe3+, Co3+, etc.) and almost all anions (not forming strong complex with the cations) can be applied to form HT-l compounds.20
The synthesis of HT-l compounds can be carried out by various methods: (i) coprecipitation in alkaline conditions (the most common), (ii) anion exchange,
(iii) hydrothermal synthesis, (iv) sol-gel.
The calcination of HT-l compounds at temperature above 400°C leads to a dispersed mixed metals oxides with high specific surface area and synergetic effect among the elements due to the intimate interdispersion of the metal oxides. Furthermore, such low calcination temperatures of HT-l compounds allow reconstructing the HT-l structure by rehydration, when the calcined materials are put in contact with aqueous solutions containing various anions (so called memory effect). Due to their unique properties, these materials find application in many fields of catalysis. E.g. they are suitable catalysts for deN2O, because of the great variety of elements that can be accommodated into the structure, the synergetic effect between different oxides homogeneously dispersed and their relative low price.
Interlayer anions
Water molecules
1.3.1 DeN
2O over hydrotalcite-derived mixed metal oxides
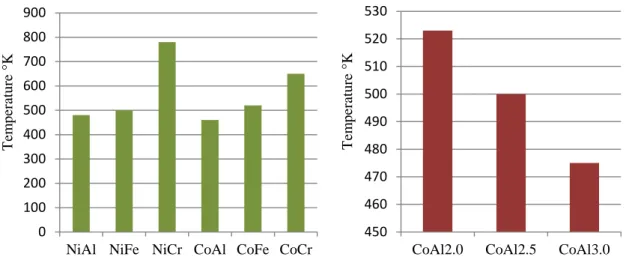
Recently, the catalytic deN2O over HT-derived compounds was extensively reviewed by Jabłońska and Palkovits.21 Kannan et al 22,23. investigated several calcined HT-l compounds, combining various metals (M2+: Mg, Co, Ni, Cu or Zn and M3+: Al, Fe or Cr) and varying their M2+/M3+ molar ratio. The first studies on the effect of the divalent cation underlined the superior catalytic activity of Co- or Ni-modified catalysts (Fig. 6):
Fig. 6 Plot of temperature required for 50% conversion of N2O over calcined HT-l compounds
(Applied Clay Science 13 (1998) 347–362)
Cobalt- or nickel-doped catalytic systems provide a partial electron donation to the N2O, which is a primary requirement for deN2O. On the other hand, materials containing Mg
and Zn are inactive due to their completely fill electronic configuration. The slightly higher activity of the containing compounds was explained due to the weaker Co-Oads bond compared to corresponding Ni-analogue. For Co-doped catalysts, after calcination of the precursors, only spinel phases were identified (Co3O4, CoAl2O4), with some oxygen defects. The good dispersion of cobalt oxide species on the surface of the materials and the presence of such defects are responsible for the high activity of these catalysts.
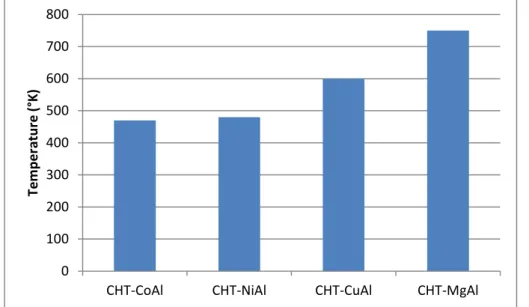
Among the trivalent cations (including Fe, Cr, Al), Al were reported for providing the highest activity, especially with cobalt-containing material (Co/Al = 3/1) (Fig. 7.).
0 100 200 300 400 500 600 700 800
CHT-CoAl CHT-NiAl CHT-CuAl CHT-MgAl
Tem p e ratu re ( °K)
Fig. 7 Plot of temperature required for 50% conversion of N2O over calcined HT-l compounds
(Applied Clay Science 13 (1998) 347–362)
A synergetic effect of metal oxides can be obtained through the introduction of more than one divalent or trivalent cation within the HT-l structure, for example Cu-Co-Mg-Al-Ox as presented by Chmielaraz et al.24. The presence of copper, in fact, facilitates the electron transfer between Co and N2O.Similarly, the enhanced activity after incorporation of small amount of copper into cobalt spinels for deN2O was also reported by Franken et al.25 The simultaneous presence of copper and cobalt, together with magnesium, leads to the formation of highly crystalline mixed spinels phases26 (MgAl2O4, CuAl2O4, CoAl2O4, Co3O4, CuxCo3-xO4). These materials show synergetic interactions between copper and cobalt.
Pèrez-Ramirez et al.27–29 studied the effect of magnesium loading on activity in deN2O over calcined HT-l materials. MgO itself was proved to be inactive in deN2O; however, Mg acts as a structural promoter for calcined Co-Al HT-l compounds, improving the textural properties of the materials, i.e. the introduction of magnesium give rise to smaller crystallite sizes and leads to higher specific surface areas. Furthermore, doping with Mg eliminates the initial deactivation of the catalysts in the presence of SO2 and O2.
Obalova et al.30–32 investigated numerous combinations of Co-Mn-Al HT-derived mixed metal oxides, and reported promising activity (also in presence of O2 and H2O) for material with a Co:Mn:Al molar ratio of 4:1:1. Other authors obtained additional improvements on deN2O activity, by doping Co-based calcined HT-l compounds with small amounts of promoters including:
(i) alkali metals (Li, Na, K), 33,34 (ii) noble metals (Rh, Pd),29,34,35
0 100 200 300 400 500 600 700 800 900
NiAl NiFe NiCr CoAl CoFe CoCr
T em p er atu re °K 450 460 470 480 490 500 510 520 530
CoAl2.0 CoAl2.5 CoAl3.0
T em p er atu re °K
(iii) rare earth metals Ce36 and La29,34,
which were introduced during coprecipitation or by impregnation with an aqueous solution containing the desired metal precursors. E.g. Pacultova et al.37 tested a K-doped Co-Mn-Al-Ox (Co:Mn:Al = 4:1:1) for deN2O in a pilot scale reactor at the bypassed tail gas from a nitric acid plant downstream. The authors reported an average value of N2O conversion of about 90% at 450°C for 112 days.
1.4 Silver-based catalysts
Silver-doped materials are applied as catalysts for the selective oxidation of methanol, and the epoxidation of ethylene, or the removal of NOx from exhaust gases 38–42. An important characteristic of these studies – compared with other noble metal catalysts – is high deNOx activity together with high N2 selectivity (low N2O formation). Silver-based catalysts were also investigated for the photocatalytic deN2O,43–46 as well as for the direct decomposition; however, these studies remain relatively scarce. Angelidis et al. and Tzitzios et al. 16,18,47 studied deN2O over Ag-(Pd/Rh) supported on γ-Al2O3. Silver deposited on alumina showed poor catalytic activity, and suffered from strong oxygen inhibition (N2O conversion decreased from 50% to 15% at 650C in presence of O2). The doping with Pd or Rh significantly enhanced the activity of the Ag/Al2O3 catalyst, even in presence of O2. The highest activity showed by 5 wt.%Ag-3 wt.%Pd/γ-Al2O3 and 5 wt.%Ag-0.05 wt.%Rh/γ-Al2O3, revealed a synergetic effect between the deposited metals. Kumar et al.17 investigated the effect of the combination of Ag with La deposited on γ-Al2O3. The authors reported full conversion of N2O at 600°C with 5 wt.%Ag-1 wt.%La2O3/γ-Al2O3. Konkol et al.48 prepared (34.6 wt.%)Ag/Y2O3 via thermal decomposition of a coordination polymer precursor. This material showed 50% conversion at temperatures as high as 400°C.
Silver was also used as a promoter for different mixed metal oxides. E.g. Liu et al.49 studied the effect of Ag doping on some perovskite-type oxides for deN2O and the reduction of NO. They reported 1 wt.% of Ag as an optimum amount for doping La0.6Ce0.4CoO3. The incorporation of Ag1+ altered oxidation state of cobalt, the density of oxygen vacancies and the mobility of lattice oxygen. The silver doped perovskite-type oxides were also successfully prepared and tested in deN2O by Kumar et al.,50. The activity of La0.8Ba0.2MnO3 significantly improved by adding 1 wt.% of Ag, especially in
the range of 400-500°C. The presence of silver altered the redox properties of the catalyst, modifying the ratio Mn4+/Mn3+ (Fig. 8.).
Fig. 8. XPS deconvoluted spectra for Mn2p core level: La0.8Ba0.2MnO3 (LBM) and 1wt.%
Ag/La0.8Ba0.2MnO3 (ALBM) (Journal of Molecular Catalysis. A, Chemical 348, 42–54 (2011).
Zhao et al.51 investigated the promotional effect of silver deposition into Co-Al-Ox calcined HT-l compounds and tested it for methane combustion. As evidenced by the H2-TPR profiles, the deposition of silver modified the redox properties of the catalyst, leading to the formation of more reducible cobalt oxide species (Fig. 9.).
Fig. 9. H2-TPR plots of calcined Co-Al and Co-Al-Ag HT-l compounds (ChemCatChem 7, 1966–
1974 (2015))
These results indicate the possibility to obtain considerable improvements of the catalytic activity of various mixed metal-based catalysts after doping with silver. A small amounts of silver (0.7-1 wt.%) can be easily deposited onto oxide’s surfaces or
even incorporated into the oxide structure, altering the physiochemical properties of the potential catalyst with unusual activity.
Several studies reported the enhanced activity of H2-pretraeted silver-containing materials before deNOx52–55, however, there is not a clear explanation about such boosting effect. One of the possible reason refers to formation of Agnδ+ clusters after the treatment with H2.
However, the enhanced activity from the addition of H2 to the feed cannot be attributed exclusively to the formation of silver clusters, but it has proposed that hydrogen itself participates directly in the reaction mechanism.56 It has reported that H2 enhanced the removal of O(ads) molecules on the catalysts’ surface: (Eq 6-7)57,58
H2 + 2* 2H(ads) (6)
2H(ads) + O(ads) H2O + 3 * (7)
Kondratenko et al.59,60 showed that the formation of N2O in NO SCR with NH3 over Ag/Al2O3 significantly decreased in presence of hydrogen, especially for low-temperature operations. H2 led to the formation of reduced Ag species, which decompose the N2O produced during the SCR of NO with NH3. These studies may be helpful not only for the suppression of the N2O emissions in NH3-SCR of NO over Ag-containing catalysts but also for deN2O from exhausts.
1.5 Aim of the thesis
This work is focused on the study of cobalt-based mixed metal oxides, partially modified with silver, for application in deN2O. The Co(Cu)-(Mg)-Al-Ox or Ag-Co-(Mg)-Al-Ox catalysts were obtained from calcination of hydrotalcite-like precursors. The silver was incorporated during coprecipitation process in order to achieve a close interaction among the metals and yields homogeneously distributed oxides. The specific goals of this thesis are:
synthesis of Co(Cu)-(Mg)-Al hydrotalcite-like precursors;
preparation of Co(Cu)-(Mg)-Al-Ox through two synthesis route: (i) thermal decomposition of hydrotalcite-like compounds or (ii) aqueous solution of metal nitrates;
preparation of Ag-doped catalysts through two modifications route: (i) introduction during coprecipitation or (ii) impregnation with aqueous solution of silver nitrate;
characterization of the materials applying XRD, TGA, N2 physisorption, H2 -TPR and XPS;
N2O decomposition test in ideal conditions (only N2O/N2 in the feed) and real conditions (in presence of O2 and/or NO);
Chapter 2: Experimental section
This chapter is divided into three main parts. The first one describes the methods used to prepare precursors and modify their calcined forms. The second part briefly presents the techniques employed for the catalysts’ characterization. The final part describes the set-up used to perform catalytic tests of N2O decomposition.
2.1 Catalysts preparation
The Co(Cu)-(Mg)-Al-Ox catalysts were synthesized by two different routhes:
(i) coprecipitation of hydrotalcite-like precursors, and then it subsequent calcination.
(ii) thermal decomposition of aqueous solution of metal nitrates.
The materials obtained through both syntheses were calcined in static air, at 600°C, for 6 h, with a temperature ramp of 10 °C/min. The materials with molar ratio of Co/Al = 3/1 and Co/Mg/Al = 3/1/1 were selected for further modifications with noble metals (Ag or Rh) by coprecipitation or impregnation. Table 1 summarizes all prepared catalysts.
2.1.1 Coprecipitation
The hydrotalcite-like compounds with intended molar ratio were prepared by coprecipitation, using the following metal nitrates as precursors:
Co(NO3)2 ∙ 6H2O (Sigma-Aldrich) Purity: ≥98%. Cu(NO3)2 ∙ 3H2O (Sigma-Aldrich) Purity: ≥98%. Al(NO3)3 ∙ 9H2O (Sigma-Aldrich) Purity: ≥98%. Mg(NO3)2 ∙ 6H2O (Sigma-Aldrich) Purity: 99%.
The metal’s precursors were dissolved in distilled water, and afterwards the obtained solution was added dropwise and under vigorous stirring, to a solution of Na2CO3 (Sigma-Aldrich, purity: ≥98%). During the whole synthesis process the pH was maintained constant at 10±0.2, by adding a 1 M solution of NaOH (Sigma-Aldrich, purity: ≥98%), and the temperature at 60°C. The obtained solution was left under vigorous stirring at 60°C for 0.5 h (Fig. 10). Afterwards it was filtered and washed several times with distilled water,. The obtained solid was dried at room temperature, crushed in a mortar and then calcined (600C, 6 h, 10C/min).
Fig. 10 Synthesis of HT-l compounds by coprecipitation.
2.1.2 Thermal decomposition
The catalysts prepared by thermal decomposition were obtained from aqueous solution of precursors’ nitrates dissolved in distilled water, and subsequently dried in the oven at 80°C for 24 h. The obtained solid was crushed in a mortar and calcined (600C, 6 h, 10C/min).
2.1.3 Silver-doping
In order to obtain silver-doped catalysts, two different methods were applied:
coprecipitation: the appropriate amount of an aqueous solution of silver nitrate (AgNO3, Sigma-Aldrich, purity: ≥98%) was added during the HT-l compounds synthesis in order to incorporate silver into the brucite-like structure,
impregnation: 1 g of the calcined material (600C, 6 h, 10C/min) was impregnated with 0.2 M aqueous solution of silver nitrate (AgNO3, Sigma-Aldrich, purity: ≥98%). Subsequently, the Ag-doped solid was dried at room temperature and calcined in static air at 600°C, for 3 h with a temperature ramp of 10°C/min.
2.1.4 Rhodium doping
The procedure for Rh-containing materials were similar, thus, rhodium nitrate (Rh(NO3)3, Sigma-Aldrich, ~36% rhodium basis) were added during coprecipitation in
order to incorporate the rhodium into the brucite-like structure. The obtained precursor was calcined according to above given calcination procedure.
Table 1 List of prepared catalysts together with their molar ratio. TD: prepared by thermal decomposition, CHT: prepared from calcination of HT-l compounds.
Sample code Co3Al Co3MgAl Co2CuAl Co1.5Cu1.5Al CoCu2Al
Molar ratio Co/Al
3/1 Co/Mg/Al 3/1/1 Co/Cu/Al 2/1/1 Co/Cu/Al 1.5/1.5/1 Co/Cu/Al 1/2/1 CHT TD CHT+0.7 wt.% Ag imp. CHT+0.7 wt.% Ag cop. CHT+0.7 wt.% Rh cop. CHT+1 wt.% Ag cop. CHT+1.4 wt.% Ag cop. CHT+2.1 wt.% Ag cop. CHT+2.8 wt.% Ag cop.
2.2 Catalysts characterization
The catalysts were characterized by the following techniques:
X-ray diffraction,
thermogravimetric analysis (TGA),
N2 physisorption,
hydrogen temperature-programmed reduction (H2-TPR). X-ray photoelectron spectroscopy (XPS).
2.2.1 X-Ray Diffraction (XRD)
X-ray powder diffraction (XRD) is a rapid analytical technique primarily used for phase identification of a crystalline material and it can provide information on unit cell dimensions.61 The interaction between an incident beam of monochromatic X-rays with a target material produces diffracted rays, depending on the distance between planes d and the diffraction angle ϴ.62
Fig. 11 X-rays diffraction (http://www.chimicamo.org/chimica-generale/diffrazione-dei-raggi-x.html)
The diffracted rays that can overlap and produce constructive or destructive interferences, according to Bragg’s law (Eq. 8):
𝑛𝜆 = 2𝑑𝑠𝑖𝑛(𝛳) (8)
where:
n - integer number,
d - distance between crystalline planes,
λ: wavelength of the incident ray,
ϴ:- diffraction angle.
The interference is at least partially destructive unless the path difference 2dsin(ϴ) is equal to an integral number of wavelengths63. When an XRD analysis is carried out the diffracted radiation intensity is recorded as function of the incident angle ϴ, producing a diffractogram characteristic for every crystal. Mixtures of crystalline materials can also be analysed and the relative peak heights may be used to obtain semi-quantitative estimates of abundances7.
XRD analysis were carried out using a Siemens D5000 with Cu-Kα radiation (λ = 1.54056Å, 45 kV, 40 mA) in order to investigate the phases present and to determine the lattice parameters of the HT-l precursors. The cell parameters were calculated using a position of (1 1 0) reflection: a = 2(d110) and positions of basal reflections: c = [3(d003) + 6(d006)]/2. The crystal sizes were calculated from the Scherrer equation (Eq. 9):
D = 0.89
cos
(9) where:
D - crystallite size, λ: wavelength of the incident ray,
ß: reflection broadening
ϴ: diffraction angle.
2.2.2 Thermogravimetric analysis (TGA)
Thermogravimetric analysis (TGA) is a thermal method that measures the weight loss of the sample by increasing the temperature, under a controlled atmosphere. It is used to investigate the material’s thermal stability, filler content in polymers, and the percent composition of components in a compound. A TGA analysis is performed by gradually raising the temperature of a sample in a furnace as its weight is measured on an analytical balance that remains outside of the furnace. In TGA, mass loss is observed if a thermal event involves loss of a volatile component, like after a combustion process. The results of a thermogravimetric analysis can be expressed in terms of:
weight loss versus temperature (thermogravimetric curve),
rate of loss of weight versus temperature (differential thermogravimetric curve).64
Thermogravimetric analysis was carried out in order to investigate the thermal transformation of the HT-l precursors. The analysis was carried out using a Netzsch STA 409C/CD, operating under a flow of air (10 cm3/min) in the temperature range of 30-1000°C with a linear heating rate of 5°C/min.
2.2.3 N
2physisorption
Gas physisorption is the most common experimental method used for the surface and pore characterization of porous materials, since it allows assessment of a wide range of pore size and it is not that cost intensive compared to some of the other available method. The analysis of surface area and pore volume of the materials were carried out by measuring the absorption isotherm of N2 at -196°C of the samples using a QuadrasorbTM-evo device (Quantachrome Corporation, Fig. 12).
Fig. 12 Quadrasorb for N2-Physisorption measurements
Prior to the determination of an isotherm, all samples were outgassed under high vacuum at 200°C with a Quantachrome Flovac degasser. The sample was then placed in a bulb cell kept at –196°C with liquid nitrogen and the analysis was carried out. The specific surface area (SBET) and the total pore volume (VP) were calculated using the BET model (developed by Brunauer, Emmett and Teller, Eq. 10).65
𝑝 𝑝0 𝑛(1 −𝑝0)𝑝 = 1 𝑛𝑚𝐶+ (𝐶 − 1)𝑝 𝑛𝑚𝐶𝑝0 (10)
with p/p0 in the range of 0.05-0.3; where: p - pressure,
p0: saturation pressure, n: number of moles adsorbed,
nm: number of moles adsorbed in the monolayer, C: BET constant, relative to the heat of absorption. By plotting 𝑝 𝑝0 𝑛(1−𝑝 𝑝0) versus 𝑝
𝑝0 a linear relationship is obtained and the values of C and nm
can be calculated. From the value of nm the specific surface areas of the materials was determined by the following equation (Eq. 11):65
𝑆 = 𝑛𝑚 ∙ 𝑎𝑚 ∙ 𝑁𝑎 ∙ 10exp (−21) (11)
S - apparent surface area (m2/g),
Am: area occupied by one adsorbed molecule (m2/molecule), Na: Avogadro’s number (molecules/mol).
2.2.4 Hydrogen temperature-programmed reduction (H
2-TPR)
Temperature-programmed reduction with H2 (H2-TPR) is a common technique used to investigate the redox properties of the catalysts. In analysis gas (H2 in an inert carrier gas such as N2, Ar or He) flows through the sample, usually at room temperature. While the gas is flowing, the temperature of the sample is increased linearly with time and the consumption of H2 by reduction processes of transition metal oxides is monitored. The obtained H2-TPR profile is a plot of the amount of hydrogen consumed versus the temperature.66
The H2-TPR analysis was carried out using a ChemBET Pulsar TPR/TPD device (Quantachrome Corporation, Fig. 13). Prior to the analysis, 30 mg of the sample was pretreated using an Ar flow of 20 cm3/min, with a temperature ramp of 25°/min until 600°C. Then the sample was treated with a flow of 5.0 vol.% of H2 in Ar (25 cm3/min), and heated up from room temperature to 1000°C with a heating rate of 10°C/min. The hydrogen consumption was detected by a thermal conductivity detector, while the water generated during the measurement was removed by a cold trap, placed before the detector.
Fig. 13. ChemBet Pulsar for H2-TPR measurements.
2.2.5 X-ray photoelectron spectroscopy (XPS)
X-ray photoelectron spectroscopy is a surface spectroscopy technique that involves the irradiation of the sample in vacuum with monoenergetic soft x-rays (Mg Kα X-rays or Al Kα X-rays are ordinarily used) and sorting the emitted electrons by energy. The photons of the incident X-ray beam are low penetrating, so they interact only with the atoms on the surface of materials, causing the emission of electrons by photoelectron effect (Fig. 14).
Fig. 14 Photoelectric effect (https://fas.dsi.a-star.edu.sg/equipments/xps_10.aspx)
The electrons leaving the sample are detected by an electron spectrometer, according to their kinetic energy (Eq. 12):
𝐸𝑘 = ℎ𝜈 − 𝐵𝐸 − 𝛷𝑠 (12)
where:
Ek - kinetic energy of the emitted electron; hν: energy of the photon;
BE: binding energy of the orbital from which the electron originates;
Φs: spectrometer work function.
The obtained spectrum (unique for each element) is a plot of the number of emitted electrons for energy interval, versus their binding energy, determined by the previous equation. From XPS analysis is then possible to obtain information regarding the oxidation state, the electronic structure and the atomic composition of the sample’s surface. 67
X-ray photoelectron spectra were measured on a VSW spectrometer equipped with a hemispherical analyzer. The photoelectron spectra were measured using a magnesium MgKα source (E = 1253.6eV). The base pressure in the analysis chamber during the measurements was 3 ∙ 10-6 Pa and the spectra were calibrated on a main carbon C1s peak at 284.6 eV. Mathematical analyses of the XPS spectra were carried out using the XPSpeak4.1 computer software (RWM. Kwok, The Chinese University of Hong Kong).
2p X-ray (photon) 2s 1s E fermilevel Photoelectron 3/2 1/2 Binding Energy
XPS analysis was carried out in order to obtain information regarding the s the oxidation state and the atomic ratio of cobalt to silver.
2.3 Catalytic tests
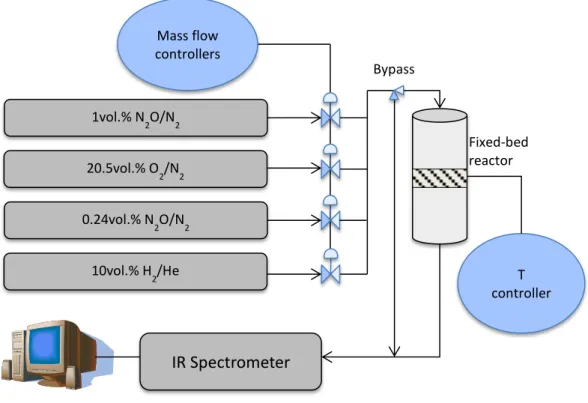
Catalytic N2O decomposition tests were carried out in a quartz fixed bed reactor under atmospheric pressure, using 350 mg of calcined catalyst (grain dimensions selected between 250 and 500 µm), and the effluent gases of the reactor were analysed by an IR spectrometer. Prior to the catalytic tests the catalysts were pretreated with a N2 flow of 100 cm3/min, raising the temperature from 50 to 600°C, with a temperature ramp of 10°C/min, and then cooling to 50°C. During the catalytic tests the temperature of the reactor was raised from 50 to 600°C or until full N2O conversion, using 50°C steps. Each temperature was set constant for 30 min before recording an IR spectrum. Fig. 15 presents the set-up diagram i.
Fig. 15 Set-up diagram
The catalytic tests were carried out in two different reaction conditions:
ideal conditions with 0.1 vol.% N2O diluted in N2;
real conditions with 0.1 vol.% N2O, 4.5 vol.% O2, 0.03 vol.% NO diluted in N2. The contact time Mcatalyst/ V̇feed was 0.0583 g∙h∙L-1
1vol.% N 2O/N2 20.5vol.% O 2/N2 0.24vol.% N 2O/N2 10vol.% H 2/He Mass flow controllers T controller Fixed-bed reactor IR Spectrometer Bypass
For the most active catalysts (1 wt.% Ag/CHT-Co3Al) an additional stability test was performed at 400C for 30 h under real conditions. An IR spectrum was collected every 1 h.
Furthermore, for a selected group of materials, catalytic tests were carried out using an H2-pretreatment. Thus, before reaction the catalyst was heated up from 50 to 600°C, using a flow of 5.0 vol.% H2 diluted in Ar with a flow rate of 100 cm3/min. Subsequently the material was cooled down in pure N2. The catalytic test was carried out under ideal conditions.
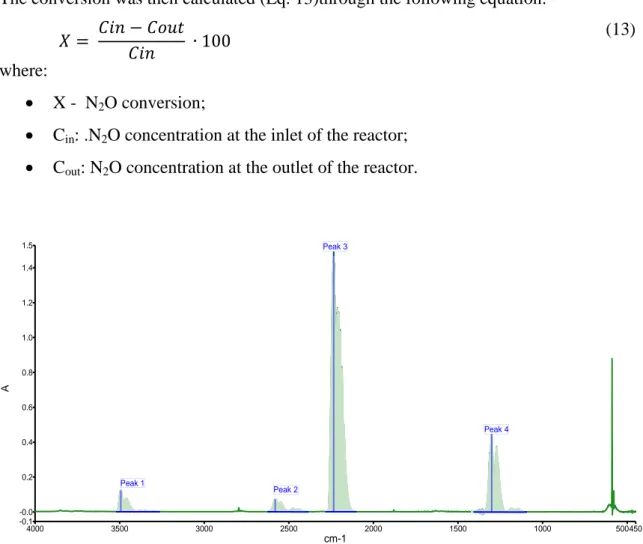
The N2O conversion was calculated for every temperature step in order to investigate the performances of the catalyst. The calculations were done using the areas of the characteristic peak related to the N2O stretching at 1298 cm-1 (peak 4), since there is a linear correlation between peaks areas and N2O (Fig. 16).
The conversion was then calculated (Eq. 13)through the following equation: 𝑋 = 𝐶𝑖𝑛 − 𝐶𝑜𝑢𝑡
𝐶𝑖𝑛 ∙ 100
(13) where:
X - N2O conversion;
Cin: .N2O concentration at the inlet of the reactor; Cout: N2O concentration at the outlet of the reactor.
Fig. 16 IR spectrum of N2O
N2O 900ppm 001_100 Name
Sample 002 By ITMC date Dienstag, März 15 2011 Beschreibung 4000 3500 3000 2500 2000 1500 1000 500450 1.5 -0.1 -0.0 0.2 0.4 0.6 0.8 1.0 1.2 1.4 cm-1 A Peak 1 Peak 2 Peak 4 Peak 3
Chapter 3: Results and discussion
This chapter contains the interpretation of the obtained results. The first part focus on the physicochemical characterization of the catalysts, while the second one concerns the catalytic N2O decomposition tests.
3.1 Catalysts characterization
The catalysts were characterized by the techniques described in the Chapter 2.2. The first part presents the results obtained from XRD, N2-physisorption and TGA, which provide information regarding the structural, textural properties as well as thermal stability of the materials. The second part concerns the H2-TPR and XPS analysis, related to the redox properties and the oxidation state of transition metal of the catalysts.
3.1.1 XRD, TGA and N
2physisorption
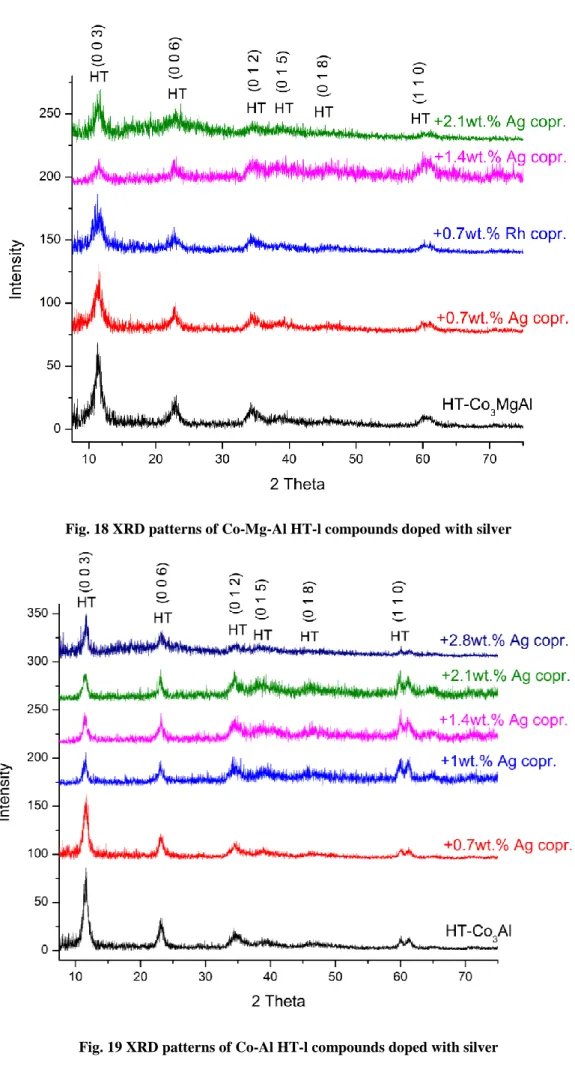
The crystal structure of the materials (before and after calcination) were investigated by X-ray diffraction (XRD). Figures 17-19 presents the XRD patterns of the hydrotalcite-like precursors.
Fig. 18 XRD patterns of Co-Mg-Al HT-l compounds doped with silver
All the compounds showed the typical reflections of hydrotalcite-like compounds with reflections at (0 0 3), (0 0 6), (0 1 2), (0 1 5), (0 1 8), and (1 1 0).19,68,69 The crystallinity of the samples decreased by increasing the amount of silver. The modification with silver led to HT phases reflections progressively broader and less intensive. Table 2 summarizes the cell parameters a and c, and the crystal sizes (Dc and Da) of the HT-l precursors.
Table 2 Unit cell parameter (a and c) and crystal dimensions (Dc and Da) of the HT-l precursors
Catalysts code c (Å) a (Å) Dc (nm) Da (nm) HT-Co3Al 22.97 3.079 19 29.1 HT-Co3Al + 0.7 wt.% Ag copr. 22.95 3.079 20 28.9 HT-Co3Al + 1 wt.% Ag copr. 23.09 3.084 21.9 31 HT-Co3Al + 1.4 wt.% Ag copr. 23.04 3.082 20.5 35.3 HT-Co3Al + 2.1 wt.% Ag copr. 23.1 3.086 25.6 41 HT-Co3MgAl 23.33 3.085 12.9 20.5 HT-Co3MgAl + 0.7 wt.% Ag copr. 23.33 3.084 13.3 22.9 HT-Co3MgAl + 0.7 wt.% Rh copr. 23.4 3.079 9.5 13.2
HT-Co3MgAl + 1.4 wt.% Ag copr. 23.19 3.079 12.3 19.8
HT-Co3MgAl + 2.1 wt.% Ag copr. 23.2 3.077 11.6 18.1
HT-Co2CuAl 22.87 3.077 15 13.6
HT-Co1.5Cu1,5Al 22.66 3.073 15.8 13.7
HT-CoCu2Al 22.73 3.077 15.9 11.6
The values of the lattice parameters a around 3.08 Å and c around 23 Å were in good agreement with literature for HT-l compounds with CO32- as interlayer anion.19 The value of a is related to the average cation-cation distance in the brucite-like sheets and depends on the ionic radius of the cations in octahedral coordination. The partial substitution of Co2+ with Cu2+ in the HT-l compounds did not lead to a significant change of a, due to their similar ionic radius (0.0745 nm and 0.073 nm, respectively). On the other hand, the introduction of Mg2+ (0.072 nm), caused a slight increase of a, because its bigger ionic radius compared to Al3+ (0.0535 nm). 70
The parameter c is related to the thickness of the interlayer space and depends on the layer-charge density, the nature of the interlayer anion, and the number of water molecules in the interlayer space19. Therefore the interlayer distance should increase by
decreasing the electronegativity of the cations in the brucite-like sheets:71 Cu (1.75) > Co (1.70) > Ag (1.42) > Mg (1.23), according to Allred and Rochow electronegativity scale.72 Accordingly, Mg-modified samples showed higher values of c, compared to Co-Al-Ox. Oppositely, the partial replacement of cobalt with copper caused a slight decrease of the parameter c. However, it has to be taken into account that also the interlayer water amount influences this parameter.71
The incorporation of small quantity of silver in the HT-l structure caused a distortion of the crystal structure, as evidenced by XRD patterns. Both lattice parameters a and c increased after the introduction of silver up to 1 wt.%.
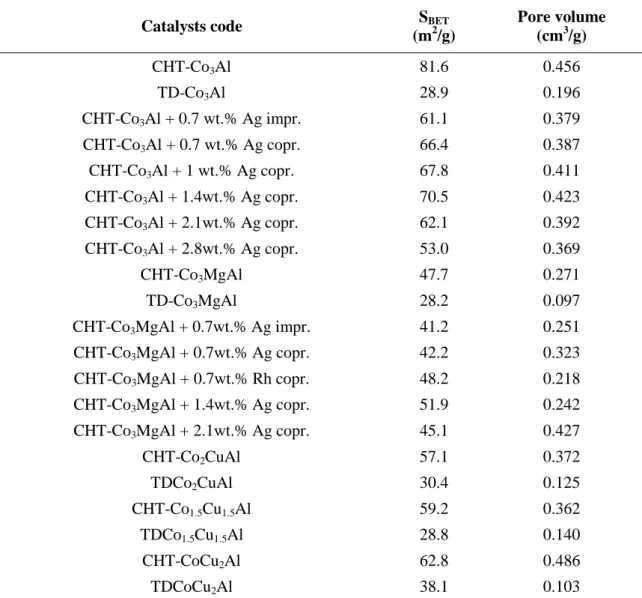
Table 3 summarizes the specific surface areas (SBET) and total pore volumes (Vp) of the calcined samples.
Table 3 Specific surface areas (SBET) and total pore volumes (Vp) of the calcined samples
Catalysts code SBET
(m2/g) Pore volume (cm3/g) CHT-Co3Al 81.6 0.456 TD-Co3Al 28.9 0.196 CHT-Co3Al + 0.7 wt.% Ag impr. 61.1 0.379 CHT-Co3Al + 0.7 wt.% Ag copr. 66.4 0.387 CHT-Co3Al + 1 wt.% Ag copr. 67.8 0.411 CHT-Co3Al + 1.4wt.% Ag copr. 70.5 0.423 CHT-Co3Al + 2.1wt.% Ag copr. 62.1 0.392 CHT-Co3Al + 2.8wt.% Ag copr. 53.0 0.369 CHT-Co3MgAl 47.7 0.271 TD-Co3MgAl 28.2 0.097
CHT-Co3MgAl + 0.7wt.% Ag impr. 41.2 0.251
CHT-Co3MgAl + 0.7wt.% Ag copr. 42.2 0.323
CHT-Co3MgAl + 0.7wt.% Rh copr. 48.2 0.218
CHT-Co3MgAl + 1.4wt.% Ag copr. 51.9 0.242
CHT-Co3MgAl + 2.1wt.% Ag copr. 45.1 0.427
CHT-Co2CuAl 57.1 0.372 TDCo2CuAl 30.4 0.125 CHT-Co1.5Cu1.5Al 59.2 0.362 TDCo1.5Cu1.5Al 28.8 0.140 CHT-CoCu2Al 62.8 0.486 TDCoCu2Al 38.1 0.103
The samples showed specific surface area in the range of 28-82 m2/g. The hydrotalcite derived mixed metal oxides showed specific surface areas around 2/3 times higher than analogous materials synthesized by thermal decomposition. This effect could be related to the formation of well-crystallized cobalt spinels, characterized by low specific surface areas.23 Furthermore, Reichle et al.73 reported that the calcination of Co-HT-l compounds led to the generation of pores on the surface of the material through which water molecules and CO2 were removed from the layered structure. This contributed to the formation of slightly amorphous cobalt spinels with high surface area.
Figure 20 shows the XRD patterns of the calcined catalysts prepared from hydrotalcite-like compounds (CHT) and thermal decomposition (TD).
Fig. 20 XRD patterns of Co-Mg-Cu-Al non-doped catalysts
The calcination of the precursors resulted in the disappearance of diffraction lines typical of the HT-l structure and formation of the characteristic reflection of the cobalt spinels, corresponding to the (1 1 1), (2 2 0), (3 1 1), (4 0 0), (4 2 2), and (5 1 1) planes. The different indistinguishable spinel phases, such as Co3O4, CoAl2O4, MgCo2O4, appeared at similar positions.23,27,30 The incorporation of copper led to formation of cobalt spinels phases, copper oxide (CuO), whose intensities increase by increasing the amount of copper in the catalysts, and also possibly mixed copper-cobalt spinels
(CuxCo3-xO4). 24,74–76 The catalysts synthesized by thermal decomposition showed similar phase composition, but higher crystallinity compared to hydrotalcite-derived mixed metal oxides. Figures 21-22 show the XRD patterns of the Ag or Rh-doped catalysts.
Fig. 22 XRD patterns of Co-Al calcined HT-l compounds doped with silver
Neither noble metal phase nor their oxides were identified in these catalysts. An exception was the sample containing 2.8 wt.% of Ag: the XRD pattern of (2.8wt.% Ag) CHT-Co3Al shows the characteristic reflection of Ag2O, suggesting that a separate Ag2O phase emerges at higher amount of silver incorporation.50,77,78
The thermal transformation of the hydrotalcite-like compounds was also investigated by TG-DTG analysis (Fig. 26).
Fig. 23 TGA and DTGA of HT-l compounds
The thermograms show the presence of two endothermic transitions:
(i) below 200°C: associated with the removal of the interlayer and weakly adsorbed water molecules,
(ii) in the range 200-300°C: due to the decomposition of hydroxyl groups and interlayer anions.19,27,31
For the Cu-containing catalysts an additional endothermic process appeared around 530°C, which was related to the thermal decomposition of strongly stabilized structural CO32-. According to Chmielaraz et al., copper introduced into the HT-l structure stabilized CO32- anions, and thus they decomposed at higher temperature 24,79. Similar thermograms were obtained for Ag- or Rh-doped catalysts (Fig. 27, 28).
Fig. 24 TGA and DTGA of Co-Mg-Al HT-l compounds doped with silver
3.1.2 H
2-TPR and XPS
The redox properties of the catalysts were investigated by temperature-programmed reduction with hydrogen (H2-TPR) analysis. Figure 26. summarizes the H2-TPR profiles for the Co(Cu)-(Mg)-Al-Ox hydrotalcite-derived mixed metal oxides.
Fig. 26 H2-TPR profiles of calcined HT-l compounds
The catalysts with compositions Co/Al = 3/1 and Co/Mg/Al = 3/1/1 showed two main reduction peaks at around 450°C and 850°C. The first one appeared due to reduction of Co3O4. Since in Co3O4 the cobalt is present in mixture of Co2+ and Co3+, two reduction peaks should appears (Eq. 14-15):25,26,36
Co3O4 + H2 → 3CoO + H2O (14)
CoO + H2 → Co0 + H2O (15)
Such reduction stages were indiscernible, in the H2-TPR profile of both Co(Cu)-Al-Ox and Co-Mg-Al-Ox, thus only a broad reduction peak of Co3+ to Co0 appeared at 450°C. The high temperature reduction peak centred at 850C was related to the reduction of cobalt in CoAl2O4 (Eq. 16).
The presence of Al influenced the reducibility of the cobalt spinels, thus the reduction peaks shifted to higher temperature.26,30,80 Arnoldy et al. claimed that Al3+ polarized the covalent Co-O bonds, increasing the charge of Co2+. Consequently, the lattice energy increased, resulting in higher reduction temperatures of cobalt spinels in both Co-Al-Ox and Co-Mg-Al-Ox.80 For the material with molar composition Co/Mg/Al = 3/1/1, the formation of MgCo2O4 cannot be excluded. Cobalt in such spinel is reduced at around 690°C with the following steps (Eq. 17-18):26
MgCo2O4 + H2 → MgCo2O3 + H2O (17)
MgCo2O3 + 2H2 → 2Co0 + MgO + 2H2O (18) In the H2-TPR profiles of the catalysts with molar compositions of Co/Cu/Al = 2/1/1 and 1.5/1.5/1, a single peak appeared at around 250°C, probably related to the reduction of copper in CuO (evidenced by XRD analysis, Fig. 20), and also possibly in CuxCo 3-xO4 25,75. In the H2-TPR profiles of catalysts with the highest amount of copper (Co/Cu/Al = 2/1/1 mol.%) the peak at lower temperature split into several peaks, due to the reduction of copper and cobalt in the various species , including: CuO, CuxCo3-xO4. The peak at 310°C was probably related to the reduction of cobalt in CuxCo3-xO4, while the peaks at 210°C and 240°C and to the reduction of copper in CuO and the spinels, respectively.25,26,75,81The peaks at higher temperature (maxima between 540 and 600°C) appeared probably due to the reduction of cobalt in CoAl2O4. However, these peaks were shifted of 200-300°C compared to the ones of the copper-free catalysts. Therefore, the presence of mixed non-stoichiometric spinels CuxCo1-xAl2O4, where copper increased the reducibility of cobalt, cannot be excluded. Moreover, increasing the amount of copper in the materials, the high temperature peak was progressively less intensive, thus the amount of mixed spinels CuxCo1-xAl2O4 gradually decreased.
Fig. 27 H2-TPR profiles of mixed metal oxides prepared by thermal decomposition
The reduction peaks of copper and/or cobalt oxide species were partially overlapped, thus adequate identification of reduction of those species could be speculative.
Figure 28 summarizes the H2-TPR profiles for Co-Mg-Al-Ox doped with different amounts of Ag or Rh (0.7-2.1 wt.%).
Fig. 28 H2-TPR profiles of Co-Mg-Al calcined HT-l compounds doped with silver or rhodium
Similarly to the undoped Co-Mg-Al-Ox, the H2-TPR profiles for Ag- or Rh-modified materials revealed two main peaks, that were related to the reduction of cobalt present in Co3O4, CoAl2O4, respectively.25,26,30,36,80 Generally, the modification with Ag or Rh influenced the redox properties of the materials, by shifting the reduction peaks to lower temperatures. Thus, the presence of silver oxides species facilitated the reduction of Co3+ and Co2+ to metallic cobalt. Zhao et al. and Kumar et al.50,51 evidenced similar results for Ag-doped Co-Al-Ox calcined HT-l compounds and Ag-doped La0.8Ba0.2MnO3, respectively.
For materials with silver above 0.7 wt.%, no further alteration appeared in the H2-TPR profiles. Presumably because bulk silver oxide segregated during the calcination step, but the concentration of Ag2O was still too low to produce a noticeable peak in the profile. The H2-TPR reduction profile varied also depending on the modification methods. E.g. the material with 0.7 wt.% of silver added during coprecipitation showed the reduction temperature of Co3O4 lower by about 70°C, than the respective materiel doped through impregnation. Thus, possibly a better dispersion of silver oxide species inside hydrotalcite derived mixed metal oxides was obtained during coprecipitation. The
lowest reduction temperatures with maximum centred about 290 and 600°C, were reached by the sample modified with rhodium. Therefore, the doping with rhodium influenced the redox properties of the materials more significantly than in case of the modification with silver.
Figure 29 summarizes the H2-TPR profiles for Co-Al-Ox doped with different amounts of Ag (0.7-2.8 wt.%)
Fig. 29 H2-TPR profiles of Co-Al calcined HT-l compounds doped with silver
As for the TPR profiles of Co-Mg-Al-Ox doped with silver, the two main reduction peaks are shifted to lower temperature due to the presence of silver oxide species, which alters significantly the redox properties of Co-Al-Ox.
The amount of silver above 1 wt.% in the samples did not cause further alteration in the reduction temperatures. The material with 0.7 wt.% of silver added during coprecipitation showed the reduction temperature of Co3O4 lower by about 20°C, than the respective materiel doped through impregnation. Thus, as for Ag-Co-Mg-Al-Ox, the doping with silver during coprecipitation led to a better dispersion of silver oxide inside Co-Al-Ox.
For the selected materials: CHT-Co3Al, CHT-Co3Al + 0.7 wt.% Ag impr., CHT-Co3Al + 0.7 wt.% Ag copr., CHT-Co3Al + 1wt.% Ag copr. XPS analyses were carried out, in
order to obtain further information on the surface species of the catalysts’ surface. Figure 30 shows the XPS spectra corresponding to the electronic transitions from the Co 2p1/2 and Co 2p3/2 orbitals.
Fig. 30 XPS deconvoluted spectra for Co 2p1/2 and Co 2p3/2 orbitals of Co-Al calcined HT-l
compounds with various amount of silver
All evaluated samples showed similar spectra, consisting of the two main Co 2p3/2 and
2p1/2 peaks, characterized by binding energies in ranges of 780-780.4 and 795.3-795.8
respectively, 82,83 The spin-orbit splitting value for CoO and Co2O3 is 16 eV and 15 eV respectively, while for Co3O4 is 15.2 ± 1 eV. The samples analysed showed spin-orbit splitting value in the range of 15.35 ± 0.5eV. Thus, only Co3O4 and CoAl2O4, (with spin-orbit splitting value of 15.9 eV.84) existed on the catalysts’ surface. 85–87 Figure 31 shows the XPS spectra corresponding to the electronic transitions from the Ag 3d3/2 and Ag 3d5/2 orbitals.
Fig. 31. XPS deconvoluted spectra for Ag 3d3/2 and Ag 3d5/2 orbitals of Co-Al calcined HT-l
compounds with various amount of silver.
Based on XPS analysis is rather difficult to distinguish the silver oxidation state, since the binding energies of silver in the metallic and in the oxidized form are very close (368.2 eV and 367.9 eV, respectively).88 However XRD analysis evidenced that a separate Ag2O phase emerges at higher amount of silver incorporation, thus we can speculate that mainly Ag+ existed in these samples
Table 3 summarizes the Ag 3d5/2 binding energies with the respective Ag/Co atomic ratio on the surface of the analyses catalysts.
Table 4 Binding energies (B.E.), peak areas, Full Width at Half Maximum (FWHM) and ratio Ag/Co for Co-Al calcined HT-l with various amounts of silver
Catalysts B.E. (eV)
3d 5/2
Area FWHM Ag/Co
CHT-Co3Al +0.7 wt.% Ag impr. 368.1 895 2.88 0.08 CHT-Co3Al +0.7 wt.% Ag copr. 367.9 3399 3.07 0.27 CHT-Co3Al +1 wt.% Ag copr. 368.1 4229 2.98 0.31
The Ag/Co atomic ratio of 0.7 wt.%Ag/Co-Al-Ox doped by impregnation was almost 3.5 times lower than the respective one doped by coprecipitation. Thus, most of silver of the impregnated catalyst was diffused into mixed metal oxides structure, possibly during the calcination process.
3.2 Catalytic tests
3.2.1 Calibration of the IR spectrometer
Prior to the reaction tests, the calibration of the IR spectrometer was carried out, in order to check the direct proportion of the peaks area of the IR spectra and the concentration of N2O in the effluent gas from the reactor. Therefore, a series of IR spectra were recorded, analysing gas flows with different concentrations of N2O. The flows were regulated by a calibrated mass flow controller, thus with known concentrations of N2O. The area of the peak at 1298 cm-1 related to the N2O stretching was used for the calibration. Figure 32 presents the result of the calibration.
A linear correlation was achieved between the N2O concentrations and the peaks area. Thus, those areas served for the evaluation of the N2O conversion.
3.2.2 Test with empty reactor and various weight hours space
velocities (WHSV)
The initial tests were carried out with a reactor without the catalytic bed under ideal conditions, in the temperature range of 50-600°C (Fig. 33).
Fig. 33 N2O conversion in "empty" reactor, reaction conditions: total flow: 100 cm3/min, 0.1
vol.%N2O, N2 balance.
Nearly no N2O conversion was obtained until 600°C in the gas phase.
The first series of catalytic tests were carried out using a catalyst with a fixed molar composition of Co/Al = 3/1 and varying WHSV (Fig. 34).
The activity increased gradually up to a WHSV of 170 L (h g)-1. Afterwards, the increase of the amount of catalyst to 400 mg (WHSV of 150 L h-1 g-1 ), did not lead to higher activity. Thus, the further catalytic tests were carried out with a WHSV of 170 (350 mg of catalyst and a total flow rate of 100 cm3/min).
Fig. 34 N2O conversion with different WHSV, reaction conditions: total flow: 100 cm3/min, 0.1
vol.%N2O, N2 balance.
3.2.3 Catalytic tests over Co(Cu)-(Mg)-Al-O
xFigure 35 presents the result of the catalytic tests over Co(Cu)-(Mg)-Al-Ox hydrotalcite derived mixed metal oxides.
Fig. 35 N2O conversion of Co-Cu-Mg-Al calcined HT-l compounds, reaction performed under ideal
conditions
Among all tested materials, CHT-Co3Al reached the highest activity with a T50 (temperature necessary to reach 50% conversion ) at 353°C. The activity of Co-Al-Ox decreased after the introduction of copper or magnesium into the structure. However, conversions ≥99% at 450°C were achieved with all the Co(Cu)-(Mg)-Al-Ox catalysts. The lowest activity was showed by the catalyst containing the highest amount of copper (Co/Cu/Al = 1/2/1, mol.%). This effect could be explained by the fact that the increase of the amount of copper in the material caused the decrease of the formation of CuxCo 1-xAl2O4, as shown in the TPR profile (Chapter 3.1.2,). Furthermore, Franken et al.25 reported an optimum molar ratio in CuxCo3-xO4 of Cu/Co = 1/11, thus the amount of copper in the tested catalysts (Co/Cu/Al = 2/1/1 Co/Cu/Al = 1.5/1.5/1, Co/Cu/Al = 1/2/1 mol.%) was probably too high to notice synergetic effect between cobalt and copper oxides.
On the other side, the lower activity of Co-Mg-Al-Ox (Co/Mg/Al = 3/1/1, mol.%) appeared due to presence of inactive MgO, as reported earlier by J. Perez-Ramirez et al.27,29
Figure 36 compares the catalytic tests carried out over mixed metal oxides obtained by coprecipitation or thermal decomposition.
Fig. 36 N2O conversion of CHT/TD-Co-Cu-Mg-Al, reaction performed under ideal conditions
All evaluated hydrotalcite derived mixed metal oxides showed higher activity than analogous materials obtained by thermal decomposition. The low activity for the materials obtained by thermal decomposition appeared possibly due to their significantly lower specific surface areas (as evidenced through N2 physisorption analysis), compared to the hydrotalcite derived mixed metal oxides. This led to a worse dispersion of cobalt oxide species on the surface of the catalysts, which is a crucial parameter for deN2O.9,23
The differences in activity of deN2O were significant especially in the intermediate temperatures. E.g. TD-Co3Al and TD-Co3MgAl showed a T50 around 50°C lower than the respective catalysts obtained from HT-l compounds.
Co(Cu)-(Mg)-Al-Ox hydrotalcite derived mixed metal oxides (Co/Al = 3/1, Co/Mg/Al = 3/1/1, Co/Cu/Al = 2/1/1 Co/Cu/Al = 1.5/1.5/1, Co/Cu/Al = 1/2/1 mol.%) were tested in the presence of O2 and NO (Fig. 37).
Fig. 37 N2O conversion on Co-Cu-Mg-Al calcined HT-l compounds, under ideal condition or real
conditions (N2O+O2+NO)
The presence of O2 and NO slightly inhibited the activity of all the catalysts tested, and shifted the conversion curves to higher temperatures of about 50-70°C. The depletion of the activity appeared due to the fact that O2, as well as NO, can be chemisorbed on the active sites of many catalysts, decreasing their catalytic activity in deN2O.9 The N2O decomposition under real conditions started to be significant above 350°C, afterwards the conversion rapidly increased and full conversion is achieved at 500°C. The inhibition in the presence of O2 and NO in the feed was more significant for CHT-Co3Al and CHT-Co3MgAl, which showed a T50 lowered of almost 70°C under real condition.
3.2.4 Catalytic tests over Ag-doped Co-(Mg)-Al-O
xIn order to evaluate influence of silver-doping, a series of Ag- or Rh-modified Co-(Mg)-Al-Ox (Co/Al = 3/1, Co/Mg/Al = 3/1/1) catalysts were investigated for deN2O. The first composition was selected because it provided the highest activity during the catalytic tests under ideal condition or under real condition. The second one, instead, was
selected because MgO, as reported by Perez-Ramirez et al.7,27, improves the stability of the catalysts during time-on-stream tests and in presence of inhibitors such as O2 and SO2. Figure 38 compares the catalytic tests carried out over Ag/Rh-Co-(Mg)-Al-Ox modified during coprecipitation or trough impregnation.
Fig. 38 N2O conversion over Ag- or Rh modified Co-Mg-Al calcined HT-l compounds doped during
coprecipitation (copr.) or through impregnation (impr.), reaction performed under ideal conditions
The modification with silver influenced significantly the activity of Co-(Mg)-Al-Ox, and led to nearly full N2O conversions at 400°C. As evidenced from TPR results, the presence of Ag in Co-mixed oxides increased the reducibility of cobalt, which plays an important role in de N2O.89 Apparently, the modification with silver weakened the Co-O bond, in a way similar to the alkali metal-doping, and promoted the oxygen desorption from the surface of the catalysts.90,91
Ag-Co-Al-(Mg)-Ox doped during coprecipitation showed the highest activity, probably due to a uniform dispersion of silver oxide species in these materials. The XPS results revealed relatively low amount/ratio of the silver oxide species for impregnated materials. Thus possibly, most of them were diffused inside the structure after calcination step. Additionally, as evidenced by H2-TPR analysis, the Ag-Co-(Mg)-Al-Ox doped during coprecipitation showed enhanced reducibility compared to the
impregnated materials. As evidenced by H2-TPR analysis, the Rh-doped catalysts showed the lowest reduction temperature and thus, the highest activity.
In the next step, the effect of different loading of silver on activity in deN2O was evaluated for Co-Al-Ox and Co-Mg-Al-Ox hydrotalcite derived mixed metal oxides (Fig. 39).
Fig. 39 N2O conversion over Co-Mg-Al calcined HT-l compounds modified with different amounts
of silver, reaction performed under ideal conditions
In case of catalysts containing Mg - Co-Mg-Al-Ox - the increase of Ag loading caused no significant changes in the activity. On the other hand, a gradual increase of activity was noticed for Co-Al-Ox with increasing silver loading up to 1 wt.%. A higher amount of silver ( 1 wt.%) did not result in higher activity. The results were in agreement with TPR results, that evidenced no further alteration of cobalt reducibility for materials with silver above 1 wt.%. Therefore the optimum composition was found for (1 wt.% Ag)CHT-Co3Al, which revealed nearly full conversion at 350°C.
Figure 40 shows the catalytic tests over silver-modified materials in presence of O2 and NO in the feed.
Again, the presence of O2 and NO slightly inhibited the activity. However, a conversion of 88% was obtained over (1 wt.% Ag)CHT-Co3Al at 400°C. Besides, the activity of
Rh-doped catalyst was negatively affected by the presence of O2 and NO in the feed gas. Consequently, under real conditions, no significant difference in activity appeared between materials modified with both Ag or Rh
Fig. 40 N2O conversion over Co-Mg-Al calcined HT-l compounds modified with different amounts
of silver, reaction performed under ideal conditions or under real conditions (N2O+O2+NO)
3.2.5 Catalytic tests over (1 wt.% Ag)CHT-Co
3Al
Figure 41 presents the results of catalytic tests in the presence of O2 and additionally NO over (1 wt.% Ag)CHT-Co3Al.