Sardinians Genetic Background Explained by Runs of
Homozygosity and Genomic Regions under Positive
Selection
Cornelia Di Gaetano1,2*, Giovanni Fiorito1,2, Maria Francesca Ortu3, Fabio Rosa2, Simonetta Guarrera2, Barbara Pardini2, Daniele Cusi4,5, Francesca Frau3,4,5, Cristina Barlassina4,5, Chiara Troffa3,
Giuseppe Argiolas3, Roberta Zaninello3, Giovanni Fresu3, Nicola Glorioso3, Alberto Piazza1,2, Giuseppe Matullo1,2*
1 Department of Medical Sciences, University of Turin, Turin, Italy, 2 HuGeF Human Genetics Foundation, Turin, Italy, 3 Hypertension and Related Diseases Center, AOU,
University of Sassari, Sassari, Italy,4 Department of Health Sciences, University of Milan, Milan, Italy, 5 Filarete Foundation, Genomic and Bioinformatics Unit, Viale Ortles
22/4, Milan, Italy
Abstract
The peculiar position of Sardinia in the Mediterranean sea has rendered its population an interesting biogeographical isolate. The aim of this study was to investigate the genetic population structure, as well as to estimate Runs of Homozygosity and regions under positive selection, using about 1.2 million single nucleotide polymorphisms genotyped in 1077 Sardinian individuals. Using four different methods - fixation index, inflation factor, principal component analysis and ancestry estimation - we were able to highlight, as expected for a genetic isolate, the high internal homogeneity of the island. Sardinians showed a higher percentage of genome covered by RoHs.0.5 Mb (FRoH%0.5) when compared to peninsular Italians, with the only exception of the area surrounding Alghero. We furthermore identified 9 genomic regions showing signs of positive selection and, we re-captured many previously inferred signals. Other regions harbor novel candidate genes for positive selection, like TMEM252, or regions containing long non coding RNA. With the present study we confirmed the high genetic homogeneity of Sardinia that may be explained by the shared ancestry combined with the action of evolutionary forces.
Citation: Di Gaetano C, Fiorito G, Ortu MF, Rosa F, Guarrera S, et al. (2014) Sardinians Genetic Background Explained by Runs of Homozygosity and Genomic Regions under Positive Selection. PLoS ONE 9(3): e91237. doi:10.1371/journal.pone.0091237
Editor: Gyaneshwer Chaubey, Estonian Biocentre and Tartu University, Estonia Received September 9, 2013; Accepted February 10, 2014; Published March 20, 2014
Copyright: ß 2014 Di Gaetano et al. This is an open-access article distributed under the terms of the Creative Commons Attribution License, which permits unrestricted use, distribution, and reproduction in any medium, provided the original author and source are credited.
Funding: The Human Genetic Foundation (HuGeF) and the Compagnia di San Paolo of Turin (to M.G.) were the main supporter of this project. This study used data from the following grants: HYPERGENES project (funded by the Seventh Framework Programme FP7 - HEALTH-F4-2007-201550) and InterOmics an Italian Flagship project (funded b 1 y Ministero dell’Istruzione, dell’Universita` e della Ricerca (MIUR) and Consiglio Nazionale delle Ricerche (CNR) Project PB.05 (to C.D.). The funders had no role in study design, data collection and analysis, decision to publish, or preparation of the manuscript.
Competing Interests: The authors have declared that no competing interests exist. * E-mail: [email protected] (CDG); [email protected] (GM)
Introduction
Due to the geographic isolation of Sardinia in the Mediterra-nean sea, Sardinian population can be considered a genetic isolate. Faunal and floral endemism underline this peculiarity, which is reflected also in the genetic and cultural structure of the human population. For such reasons, Sardinians have been object of numerous investigations in the fields of anthropology and population genetics [1,2,3,4].
Several studies have shown that the genome of current Sardinia inhabitants still contains some signatures of a long history of isolation. These features make this genetic isolate an ideal population for association studies [5,6,7]. However, much remains to be discovered about the genomic regions that were inherited from common ancestors, such as the short Runs of Homozygosity (RoHs), or the portions of the genome that have been selected by positive sweep.
In the present study, we have analyzed the genetic structure of the Sardinian population by using 1.2 million single nucleotide polymorphisms (SNPs) from 1077 Sardinians previously included
in a genome-wide association study (GWAS) [8], and 79 healthy individuals from peninsular Italy. The aims of the study were the following: (i) reconfirming, through the use of autosomal genome wide data, the homogeneity of Sardinia population at the inter-regional level; (ii) inferring, through the use of RoHs, the population genetic history by estimating the background level of shared ancestry within the island and by comparing it with peninsular Italy; (iii) identifying signals of positive selection.
Materials and Methods Data sets
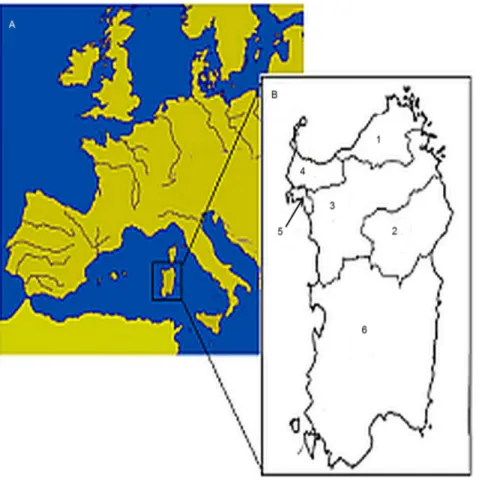
Genotypic data from 1077 healthy subjects from Sardinia were used as primary data-set. Those samples were collected in the frame of an international consortium for GWAS on hypertension (HyperGene) and described elsewhere [8]. Subjects were clustered according to birth place, dividing Sardinia on the basis of the language spoken as suggested by Contini and coworkers [9,10]. In the present work, a simplification of this approach was used by dividing the island into six main macro-areas as displayed in
Figure 1: Gallurese (n = 77), Nuorese (n = 88), Logudorese (n = 385), Sassarese (n = 342), Alghero (n = 87) and Campidanese (n = 98). Part of the samples (n = 250) have been already analyzed in a previous work [11].
An additional group consisting of 79 Italian individuals was included in the study to perform a comparison of Sardinian genetic background with the Italian mainland. The peninsular Italian subjects were genotyped in our laboratory for more than 1M SNPs (HumanOmni1–QUAD v1.0 BeadChip, Illumina Inc, S. Diego, CA, USA). To compare Sardinia and Italy, only SNPs common to both data-sets were considered (,520 k markers).
All samples were collected with informed consent and analyzed anonymously. Their use for population genetics studies was approved by the ethics committee of the Human Genetics Foundation (HuGeF) in Turin.
Quality Assessment and Control Procedure
Stringent quality control procedures were applied when performing SNPs genotyping analysis. Samples with an individual call rate lower than 98% were excluded. SNPs with minor allele frequency (MAF) less than 0.01 were excluded, as well as those who failed the Hardy-Weinberg equilibrium test (p,161023). In order to estimate individual number of RoHs, SNP markers on sex chromosomes were excluded. After quality control procedures, the Sardinian data-set contained a total of 946,970 SNPs.
Statistical Data Analyses
Analysis was performed at different levels. The first one was to assess the genetic structure within Sardinia. A second level was aimed at reconstructing the genetic population history through RoHs analysis, and the identification of genomic regions under positive selection.
Sardinian population structure
Principal Component Analysis (PCA) was performed using the complete set of markers, with the algorithm implemented in the R package [12] SNPRelate [13]. The PCA values of each individual sample have been plotted on the space defined by the first 2 eigenvectors: subjects from the same linguistic macro-area or the same geographic area have been displayed with identical color (Figure 2A and B).
We used the first four principal components (PCs) as predictors in a multinomial logistic regression using the linguistic macro-area as dependent outcome. We then evaluated the prediction accuracy of the described model: for each sample the most probable linguistic macro-area estimated by the model was compared to the real one (10,000 iterations).
Pairwise inflation factors (lGC) [14] between the six macro-areas were computed through PLINK software [15], simulating a case-control study between each pair of macro-areas (–adjust option).
We used two different methods to calculate Fst: the first one was roundly intended to produce estimates on data with significant inbreeding (like the six macro-areas) while the second one was
Figure 1. Map of Mediterranean basin showing the localization of Sardinia and Sardinian linguistic domains. A) Map of the Mediterranean basin showing the geographic position of Sardinia. B) The Sardinian linguistic domains: 1 = Gallurese (77 individuals); 2 = Nuorese (88); 3 = Logudorese (385); 4 = Sassarese (342); 5 = Alghero (87); 6 = Campidanese (98).
doi:10.1371/journal.pone.0091237.g001
meant for panmictic populations (Sardinia versus peninsular Italy). Pairwise genetic Fstcorrect for inbreeding between the six macro-areas was estimated as suggested in Reich et al. [16]. Fstbetween the Sardinian and peninsular Italians populations was estimated using the Hudson estimator for genome-wide data [17], as suggested in Bhatia et al. [18]. The R code to compute both estimators is available in Text S1.
Mean inbreeding coefficients were estimated on the basis of the observed versus expected number of homozygous genotypes over the whole genome, using the data set containing also peninsular Italian individuals (PLINK software (–het option)). Differences between Sardinian population and peninsular Italians were evaluated using a T test. The software ADMIXTURE [19] was used to estimate the ancestry for each individual in Sardinian population and in peninsular Italian subjects. A cross validation error-based method was applied to detect the number of clusters (K) after 20 runs.
Runs of Homozygosity Analysis
RoHs were estimated separately for Sardinians and peninsular Italians (PLINK software (–homozyg option)). The following parameters were used for the estimation algorithm:1) a sliding window of 5000 kb, with a minimum of 50 SNPs that must be present in the region considered; 2) for a given window, a maximum of one heterozygous and a maximum of five missing calls allowed; 3) each SNP was considered to be part of an homozygous segment when the proportion of homozygous windows overlapping that position was above the threshold value of 0.05.
We identified 6 RoH categories based on the length of the genomic region of homozygosity (0.5–1 Mb,1–2 Mb, 2–4 Mb, 4– 8 Mb, 8–16 Mb, .16 Mb), and estimated the proportion of
individuals with RoHs of different size in each Sardinia’s macro-areas. Differences between Sardinian macro-areas and peninsular Italy were evaluated using a T test. We also estimated the proportion of the genome covered by regions of homozygosity (FRoH%) according to McQuillian et al. [20]. Two classes of RoHs were considered in this analysis: RoH$0.5 Mb, and RoH$5 Mb. For each class and for each macro-area we computed the average FRoH% over all individuals, as well as the average sum of length of all RoHs in the same class. A T test was performed to evaluate the differences between the two classes of RoH within each macro-area and Italy.
Extended haplotype homozygosity (EHH) and related tests
FastPHASE software [21] was used to perform a haplotype phase estimation. The estimated haplotypes were subsequently used to detect footprints of selection from haplotype structure.
For each SNPs we computed the EHH statistic [22] of both alleles (ancestral and derived), as well as the integrated haplotype score (iHS) [23]. The algorithm is implemented in the R package rehh [24]. For this specific analysis we employed a total of ,900 k markers for which information about ancestral allele was available in the public databases [25]. Lastly, we searched for chromosomal regions that showed enrichment of SNPs with |iHS|.4, using the approach suggested by Voight et al. [23]. Permutation based correction for multiple comparisons was applied.
Results
The multinomial logistic regression model using the first four eigenvector as predictors of the linguistic macro-areas showed very low accuracy (from a minimum of 0.2044 to a maximum of
Figure 2. SNP-Based Principal Component Analysis of 1,077 individuals from Sardinia. Figure 2 A) division accounting linguistic macro-areas. Key of the colors: red: Campidanese; green: Alghero; deep blue: Gallurese; light blue: Logudorese; yellow: Sassarese; purple: Nuorese. Figure 2 B) division accounting geographical areas. Key of the colors: green: Southern Sardinia; grey: Central Sardinia; yellow: Northern Sardinia.
doi:10.1371/journal.pone.0091237.g002
0.3201, 10,000 iterations), suggesting a high degree of homoge-neity within Sardinian population. No sub-populations were apparently identified projecting the Sardinian samples onto a two-dimensional space (based on the first two eigenvectors) using all autosomal markers (934,288 SNPs) within the linguistic macro-areas (Figure 2A), or dividing the island in 3 geographic regions (Figure 2B). The distribution of the first four eigenvectors is shown in Figure S1. All pairwise Fst values inbreeding corrected within Sardinian linguistic macro-areas were close to zero (Table 1), and we observed a Fstestimator of 0.003 (p-value,0.0001 95% C.I. 0.0025–0.0033) when comparing Sardinia to peninsular Italy. Pairwise inflation factors (lGC) were strictly close to 1 (from 1.01 to 1.05) (Table 1). The ancestry analysis highlighted a common genetic background for all the individuals of the island (Figure 3). The observed shared ancestry made unfeasible any attempt to cluster individuals on the basis of their place of birth. By using the cross validation error, we indicated ‘‘K = 2’’ as the number of clusters more compatible with the data. Furthermore higher values of K did not reveal additional population-specific ancestries.
The percentage of genome covered by RoHs.0.5 Mb (FRoH%0.5) was higher in Sardinians when compared to peninsular Italians, with the only exception of the area surrounding Alghero (Table 2). No significant difference was observed between Sardinians and Italians when comparing the fraction of the genome covered by RoHs.5 Mb (FRoH%5) (Table 2).
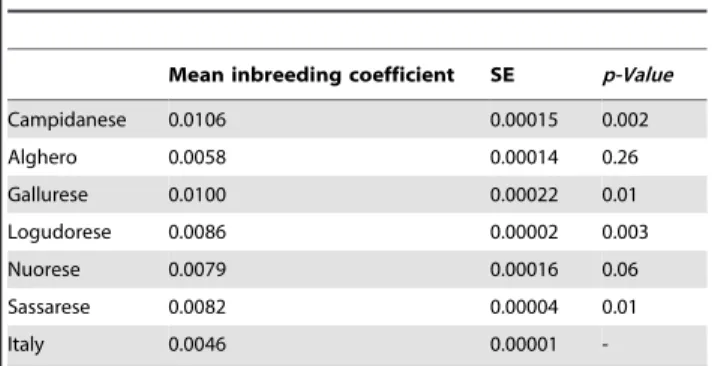
Significant differences were observed in the mean inbreeding coefficients between Campidanese, Gallurese, Sassarese, and Logudorese macro-areas and peninsular Italy (Table 3).
Since the distribution of different classes of RoH allows to study different demographic patterns involving a population, we further divided RoHs into 6 different classes, as shown in Table 4. Sardinia had a higher number of RoHs than Italy for 2 classes of RoH: 0.51 Mb, and 1–2 Mb (p-value,0.05). Regarding longer RoH classes (8–16 Mb and .16 Mb) no significant difference was found between the two regions, with the exception of Campida-nese for the class 8–16 Mb. Comparing the class of RoH longer than 2 Mb, the Alghero district and Sassarese were not found statistically different from peninsular Italy.
To detect possible footprints of positive selection, the decay of standardized EHH (namely, iHS [23]) has been estimated. Nine genomic regions, harboring more than 200 different genes, showed a signal of positive selection (Table 5). Genomic regions under positive selection on chromosome 9 (from 70,303,655 to 70,400,714 bp) and chromosome 19 (from 22,561,972 to 22,586,080 and from 32,961,206 to 33,175,723) are here described for the first time. Not unexpectedly, a very large chromosomal region showing evidence of positive selection, was found on chromosome 6 (6p21.3), encompassing the human leukocyte antigen (HLA) system. Another interesting region is
11q12.1, which contains the 24 genes related to the olfactory receptor activity.
Discussion
A large number of genetic markers belonging to different categories have been employed so far to describe the genetic peculiarity of Sardinians in comparison with other Mediterranean and European populations: classical genetic markers [2,26,27,28,29], HLA system polymorphisms [30,31,32], autoso-mal markers [1,5,6,33,34], rare cystic fibrosis mutations distribu-tion [35], mitochondrial DNA (mtDNA) polymorphisms [36,37,38,39,40,41],Y-chromosome genetic variants, and se-quence data [7,42,43,44,45,46,47].
In general, Sardinia appears characterized by a large internal homogeneity [5,7], like all isolated populations, even though other investigators suggested the presence of genetically different subpopulations in the island [6,48]. Recently several genome-wide studies have been performed on Sardinian population taking advantage of the genetic homogeneity of the island using also large cohort of individuals [49,50,51,52,53].
In the present study, we have reconfirmed the high internal homogeneity of Sardinia using four different methods (PCA, Fst distance, inflation factor parameter (lGC) and ancestry estimation). The lack of a subpopulation structure seems clear from PCA. In fact, the multinomial logistic regression model showed that the first four PCs are not able to predict the linguistic macro-areas. Moreover, the inbreeding corrected Fstvalues were spanning from 9.161025 to 1.161024, and the lGC values were all nearly 1, indicating both the lack of population differentiation among different areas, and of genetic stratification within the island. The ancestries estimation also suggested a remarkable degree of similarity for all the sampled Sardinian subjects, at the same time a significant heterogeneity when Sardinians are compared to peninsular Italian subjects.
It is nevertheless worthy to note that some Sardinia sub-regions, such as Ogliastra, are actually formed by isolated villages, each of them with a unique demography. Several studies [6,48,54] observed differences of linkage disequilibrium (LD) and population structure among these villages. Unfortunately, the limited number of individuals from Ogliastra in our sample (N = 16) did not allow us to test the hypothesis of genetic substructures at the micro-geographic level. The isolation of population has also left its mark on the Sardinians’ DNA. In fact a 2-fold increase in the mean homozygosity compared with Italy, is still detectable. Nevertheless we still found evidence for a significant decrease of genome homozygosity in the area surrounding Alghero, which is the linguistic macro-area with the lowest signature of isolation in Sardinia.
Table 1. Fstvalues (in bold) and genomic control inflation factor (lGC) (in italics) between Sardinian linguistic macro-areas.
lGC/Fst Campidanese Alghero Gallurese Logudorese Nuorese Sassarese
Campidanese - 4.461025 1.161024 3.261025 2.261025 8.561026 Alghero 1.037 - 1.561024 9.161025 1.161024 7.161025 Gallurese 1.051 1.047 - 1.261024 1.461024 1.161024 Logudorese 1.018 1.041 1.040 - 6.161025 4.261025 Nuorese 1.019 1.027 1.040 1.028 - 4.061025 Sassarese 1.012 1.032 1.046 1.046 1.021 -doi:10.1371/journal.pone.0091237.t001
We focused on RoHs for a more detailed study on the demographic history of the island. RoHs are regions of the genome in which the inherited copies from both parents are identical as both parents inherited them from a common ancestor at some point in the past (identical by descendent tracts). RoHs are observed in the genome of each individual, and their length is related with their time of origin. RoHs describe different aspects of a population, such as consanguinity, endogamy and demographic
events such as bottlenecks. We therefore evaluated the average percentage of the genome covered by RoH.0.5 Mb and RoH.5 Mb (FRoH0.5% and FRoH5%, respectively) within each Sardinian sub-population compared with those from the Italian peninsula. The FRoH0.5% describes the global trend of homozy-gosity within the sub-populations, while the FRoH5% provides information on other phenomena, such as endogamy or recent inbreeding. The average FRoH0.5% and the mean sum of the lengths of these segments in Sardinia were higher as compared to Italy (mean sum of FRoH0.5for Sardinia from 72.77 to 82.55 Mb, for Italy 67.55 Mb). These observations are consistent with an Table 2. Mean genomic inbreeding coefficients (FRoH%)
using 0.5 and 5 Mb minimum RoH thresholds and mean sum of RoH.
FRoH%$0.5 FRoH%$5 Mean (SD) sum of RoH (Mb)
mean$0.5 mean$5 Campidanese 3.08* 0.49 82.55* 3.81 13.24 3.14 Alghero 2.71 0.29 72.77 2.86 7.86 2.28 Gallurese 3.10* 0.51 83.09* 4.39 13.65 3.82 Logudorese 2.96* 0.41 79.33* 1.79 11.06 1.53 Nuorese 2.89* 0.42 77.61* 3.74 11.15 3.26 Sassarese 2.94* 0.44 78.84* 2.05 11.67 1.84 Italy 2.52 0.47 67.55 4.98 12.64 4.28
* p-value smaller than 0.05 when comparing each linguistic macro-area to peninsular Italy.
doi:10.1371/journal.pone.0091237.t002
Table 3. Mean inbreeding coefficients.
Mean inbreeding coefficient SE p-Value
Campidanese 0.0106 0.00015 0.002 Alghero 0.0058 0.00014 0.26 Gallurese 0.0100 0.00022 0.01 Logudorese 0.0086 0.00002 0.003 Nuorese 0.0079 0.00016 0.06 Sassarese 0.0082 0.00004 0.01 Italy 0.0046 0.00001
-Mean inbreeding coefficients, standard errors (SE) and T test p-Values of Sardinia macro-areas and peninsular Italy.
doi:10.1371/journal.pone.0091237.t003
Figure 3. ADMIXTURE software results for K = 2–4. Ancestry for each individual inferred using ADMIXTURE software. doi:10.1371/journal.pone.0091237.g003
ancestral small effective population size (Ne) in Sardinia and a deeper level of shared ancestry. Once again the Alghero area contrast with those observations showing a FRoH0.5% similar to peninsular Italy.
However, we were not able to observe a similar trend for FRoH5%, for any of 6 macro-areas. To achieve a deeper detail, we ranked RoHs in six different classes. On average, in Sardinia the mean sum of the shortest RoHs (0.5–1 Mb and 1–2 Mb) was significantly longer than in Italy. This phenomenon can be explained as the result of common extended haplotypes probably inherited from both parents, that are frequent in isolates and small communities [55].
Other macro-area such as Campidanese and Gallura (concerning RoH from 2 to 8 Mb) and Logudorese and Nuorese (RoH 2–4 Mb) still retain traces of endogamy when compared to peninsular Italy. Again, in the Alghero area, RoHs above the threshold of 2 Mb, were shorter and less common than in the other Sardinian populations; this finding indicates significant lower endogamy and consanguinity degree in this subpopulation. It should be noted that the North-Western town of Alghero is a Catalan-speaking community and this language is a remarkable exception from all Sardinian varieties of dialects. The Alghero’s dialect derives from historical events which affected the city in the Middle Ages when the population was swelled by the arrival of Catalan-speaking colonists [56].
In our knowledge, only one study has previously assessed genome-wide patterns of homozygosity in the Sardinian popula-tion [5]. Although the criteria used for the identificapopula-tion of RoHs are slightly different between the present study and that of Pardo and colleagues, the results of the two studies are consistent.
Additionally, we searched for footprints of positive selection in the Sardinian genome by using extended haplotype homozygosity and iHS test. Our results identified some genomic regions not previously described as being under positive selection, that may be considered as novel candidates worthy of investigation for positive selection in Sardinian population. Among them, the TMEM252 gene (ID 169693) and PGM5 gene (ID 5239) region, and a region on chromosome 19 containing a long non-coding RNA (LINC00662). As expected, we re-captured many of the previously described signals of recent positive selection. Specifically, the PRLH gene (ID 51052) and MLPH gene (ID 79083), both located on the long arm of chromosome 2, which are under selection in Mideast and European populations [57], the SH3BP5L gene (ID 80851) [58], and a region on chromosome 11 containing several olfactory-related genes [59]. As reported in literature, the region of the human leukocyte antigen (HLA) system is under positive selection in the Europeans, Mideast and South Asian populations [57]. In our study we did not find the lactase gene (LCT ID 3938) among the regions under positive selection, as reported also by other studies [57,60].
Conclusion
Although the main limitation of our study is that the information on Sardinian individuals’ origins were based only on their birth place, our study reconfirmed by using different approaches the high degree of internal genetic homogeneity in Sardinia. We have shown that the genome of the Sardinians has mean inbreeding coefficients which are higher than those of mainland Italians. Furthermore, the Sardinian’s genome still preserves traces of the elaborate demographic history of the island. Between the macro-areas analyzed, the area surrounding Alghero shows less inbreeding than others, according to its peculiar history and underlined also by the local dialect. Several genomic regions showing signals of positive selection were identified, some of them not previously described and as such worthy of further
Table 4. Percentage of the accessible genome occupied (2.84 Gb) and mean sum of RoH in Mb (with standard errors SE) for six classes of RoH. 0.5–1 M b 1 –2 Mb 2–4 M b 4 –8 Mb 8–16 Mb . 16 Mb % RoH mean SE % RoH mean SE % RoH mean SE % RoH mean SE % RoH mean SE % RoH mean SE Campidanese 1.23 32.92* 0.53 0.98 2 6.25* 0.56 0 .31 8.27* u 0.6 0.2 5.28* u 0.78 0 .17 4 .66* 1.26 0.19 5.18 1.74 Alghero 1.19 31.86* 0.56 0.95 2 5.61* 0.58 0 .26 6.89 0.51 0.1 2.66 0.57 0 .13 3 .46 1.06 0.09 2.29 1.12 Gallurese 1.19 31.83* 0.55 1.01 2 7.12* u 0.65 0 .32 8.68* u 0.64 0.22 5 .98* u 1.06 0 .15 4 .07 1.07 0.2 5 .42 2 .26 Logudorese 1.21 32.42* 0.27 1 26.91* u 0.33 0 .29 7.68* u 0.27 0.14 3 .82 u 0.34 0 .16 4 .17 0.58 0.16 4.33 0.93 Nuorese 1.19 31.82* 0.58 0.93 2 5.02* 0.59 0 .31 8.33* 0 .49 0.15 3 .89 0.74 0 .19 5 .01 1.25 0.13 3.54 1.82 Sassarese 1.21 32.52* 0.28 0.99 2 6.47* 0.32 0 .26 6.96 0.27 0.14 3 .7 0.39 0 .14 3 .72 0.59 0.2 5 .48 u 1.18 Italy 0.98 26.25 u 0.43 0.8 21.49 u 0.63 0 .24 6.42 0.63 0.13 3 .45 1.01 0 .18 4 .9 1.51 0.16 4.4 2 .07 *T test p-value , 0.05 comparing to Italy, uT test p-value , 0.05 comparing to A lghero. doi:10.1371/journal .pone.0091237.t004
investigation. In the near future, our results could be confirmed by re-sequencing the genes/regions showing signature of positive selection and by identifying potentially functional SNPs/haplotypes.
Supporting Information
Figure S1 Box plot distribution of the first four
eigenvectors in the 6 macro-areas. (JPG)
Text S1 The R code used to compute 1) the Hudson estimator
[17], as suggested in Bhatia et al. [18]. 2) inbreeding corrected Fst estimator as suggested in Reich et al. [16].
(DOC)
Acknowledgments
We are indebted to all volunteers who participated in this study and to Associazione Volontari Italiani del Sangue (AVIS) - the Italian Association of Voluntary Blood Donors.
Author Contributions
Conceived and designed the experiments: CDG GM AP. Performed the experiments: CDG SG BP. Analyzed the data: CDG G. Fiorito FR GM. Contributed reagents/materials/analysis tools: MFO DC FF CB CT GA RZ G. Fresu NG AP GM. Wrote the paper: CDG GM AP.
References
1. Calo` CM, Autuori L, Di Gaetano C, Latini V, Mameli GE, et al. (1998) The polymorphism of the APOB 39 VNTR in the populations of the three largest islands of the western Mediterranean. Anthropologischer Anzeiger; Bericht u¨ber die biologisch-anthropologische Literatur 56: 227–238.
2. Cappello N, Rendine S, Griffo R, Mameli GE, Succa V, et al. (1996) Genetic analysis of Sardinia: I. Data on 12 polymorphisms in 21 linguistic domains. Annals of Human Genetics 60: 125–141.
3. Caramelli D, Vernesi C, Sanna S, Sampietro L, Lari M, et al. (2007) Genetic variation in prehistoric Sardinia. Human Genetics 122: 327–336.
4. D’Amore G, Di Marco S, Floris G, Pacciani E, Sanna E (2010) Craniofacial morphometric variation and the biological history of the peopling of Sardinia. Homo 61: 385–412.
5. Pardo LM, Piras G, Asproni R, van der Gaag KJ, Gabbas A, et al. (2012) Dissecting the genetic make-up of North-East Sardinia using a large set of haploid and autosomal markers. Eur J Hum Genet 20: 956–964.
6. Piras IS, De Montis A, Calo CM, Marini M, Atzori M, et al. (2012) Genome-wide scan with nearly 700 000 SNPs in two Sardinian sub-populations suggests some regions as candidate targets for positive selection. Eur J Hum Genet. 7. Contu D, Morelli L, Santoni F, Foster JW, Francalacci P, et al. (2008)
Y-chromosome based evidence for pre-neolithic origin of the genetically homogeneous but diverse Sardinian population: Inference for association scans. PLoS One 3.
8. Salvi E, Kutalik Z, Glorioso N, Benaglio P, Frau F, et al. (2011) Genomewide Association Study Using a High-Density Single Nucleotide Polymorphism Array
and Case-Control Design Identifies a Novel Essential Hypertension Suscepti-bility Locus in the Promoter Region of Endothelial NO Synthase. Hypertension. 9. Contini M (1979) Classification phonologique des langages sardes. Bull Inst
Phonetique Grenoble 8: 57–96.
10. Contini M, Cappello N, Griffo R, Rendine S, Piazza A (1989) Ge´olinguistique et ge´oge´netique: Une de´marche interdisciplinaire. Geolinguistique 4: 129–197. 11. Di Gaetano C, Voglino F, Guarrera S, Fiorito G, Rosa F, et al. (2012) An
Overview of the Genetic Structure within the Italian Population from Genome-Wide Data. Plos One 7: e43759.
12. Development Core Team R R (2009) A Language and Environment for Statistical Computing. R Foundation for Statistical Computing,Vienna, Austria. http://www.R-project.org.
13. Zheng X, Levine D, Shen J, Gogarten SM, Laurie C, et al. (2012) A high-performance computing toolset for relatedness and principal component analysis of SNP data. Bioinformatics 28: 3326–3328.
14. Devlin B, Roeder K (1999) Genomic control for association studies. Biometrics 55: 997–1004.
15. Purcell S, Neale B, Todd-Brown K, Thomas L, Ferreira MAR, et al. (2007) PLINK: A tool set for whole-genome association and population-based linkage analyses. American Journal of Human Genetics 81: 559–575.
16. Reich D, Thangaraj K, Patterson N, Price AL, Singh L (2009) Reconstructing Indian population history. Nature 461: 489–494.
17. Hudson RR, Slatkin M, Maddison WP (1992) Estimation of levels of gene flow from DNA sequence data. Genetics 132: 583–589.
Table 5. Nine genomic regions showing signals of positive selection in the Sardinian’s genome ordered by |iHS|.
Position NCBI36/
hg18 SIZE
n SNP
|iHS|.4 n SNP MAX|iHS| MAX iHS SNP p-value
empirical p-value genes chr19: 32,961,206– 33,175,723 215 12 69 6.25 rs17714275 3.87 e234 ,0.0001 LINC00662 chr6: 29,555,703– 33,009,633 3454 35 4884 5.37 rs397081 1.64 e221
,0.0001 GABRB1;MOG; HLA-F;HLA-G; etc;
chr2: 238,113,451– 238,164,950 51 7 37 25.33 rs2292871 6.62 e222 ,0.0001 MLPH;PRLH;RAB17 chr9: 70,303,655– 70,400,714 97 8 37 5.06 rs11143002 4.86 e225 ,0.0001 PGM5; TMEM252 chr19: 22,561,972– 22,586,080 24 8 16 24.66 rs4932781 4.49 e229 ,0.0001 LOC440518;LOC100996349 chr5: 109,659,513– 109,731,650 72 13 28 24.65 rs10478008 9.03 e244 ,0.0001 NA chr1: 247,047,666– 247,088,866 41 7 15 24.48 rs12058711 1.05 e225 ,0.0001 SH3BP5L chr4: 34,062,734– 34,244,104 181 13 46 24.39 rs11936559 5.37 e240 ,0.0001 NA chr11: 55,732,908– 56,414,929 682 10 228 4.27 rs12576240 4.79 e225 ,0.0001 OR5T2;OR5T3;OR5T1;OR8H1; etc;
Column headers: Position on NCBI36/hg18 of region showing evidence for selection; Size in Kb of the genomic region; nSNP |iHS|.4 indicates the number of SNPs with an absolute |iHS| higher than 4 in each region; nSNP is the number of SNPs in each region; Max iHS is the highest value of each region; Max iHS SNP is the polymorphism with the highest value for each region; P-values: nominal p-values; Empirical p-values: after permutation-based multiple testing corrections; Genes: the genes within the region. When, in the genomic region, there are more than 4 genes, only the first 4 are indicated.
doi:10.1371/journal.pone.0091237.t005
18. Bhatia G, Patterson N, Sankararaman S, Price AL (2013) Estimating and interpreting FST: the impact of rare variants. Genome Res 23: 1514–1521. 19. Alexander DH, Novembre J, Lange K (2009) Fast model-based estimation of
ancestry in unrelated individuals. Genome Res 19: 1655–1664.
20. McQuillan R, Leutenegger AL, Abdel-Rahman R, Franklin CS, Pericic M, et al. (2008) Runs of homozygosity in European populations. Am J Hum Genet 83: 359–372.
21. Scheet P, Stephens M (2006) A fast and flexible statistical model for large-scale population genotype data: applications to inferring missing genotypes and haplotypic phase. Am J Hum Genet 78: 629–644.
22. Sabeti PC, Reich DE, Higgins JM, Levine HZP, Richter DJ, et al. (2002) Detecting recent positive selection in the human genome from haplotype structure. Nature 419: 832–837.
23. Voight BF, Kudaravalli S, Wen X, Pritchard JK (2006) A map of recent positive selection in the human genome. PLoS Biol 4: e72.
24. Gautier M, Vitalis R (2012) rehh: an R package to detect footprints of selection in genome-wide SNP data from haplotype structure. Bioinformatics 28: 1176– 1177.
25. Sherry ST, Ward M-H, Kholodov M, Baker J, Phan L, et al. (2001) dbSNP: the NCBI database of genetic variation. Nucleic Acids Research 29: 308–311. 26. Vona G (1997) The peopling of Sardinia (Italy): History and effects.
Int J Anthropol 12: 71–87.
27. Vona G, Floris-Masala R, Mameli GE, Succa V (1992) Red cell and serum protein polymorphisms in Sardinia. International Journal of Anthropology 7: 25–33.
28. Piazza A, Cappello N, Olivetti E, Rendine S (1988) A genetic history of Italy. Annals of Human Genetics 52: 203–213.
29. Cavalli-Sforza LL, Menozzi P, Piazza A (1994) The History and Geography of Human Genes.
30. Contu L, Carcassi C, Orru` S, Mulargia M, Arras M, et al. (1998) HLA-B35 frequency variations correlate with malaria infection in Sardinia. Tissue Antigens 52: 452–461.
31. Grimaldi MC, Crouau-Roy B, Amoros JP, Cambon-Thomsen A, Carcassi C, et al. (2001) West Mediterranean islands (Corsica, Balearic islands, Sardinia) and the Basque population: Contribution of HLA class I molecular markers to their evolutionary history. Tissue Antigens 58: 281–292.
32. Lampis R, Morelli L, Congia M, Macis MD, Mulargia A, et al. (2000) The inter-regional distribution of HLA class II haplotypes indicates the suitability of the Sardinian population for case-control association studies in complex diseases. Human Molecular Genetics 9: 2959–2965.
33. Calo` CM, Varesi L, Memmi M, Moral P, Vona G (2003) A pentanucleotide repeat polymorphism (TTTTA) in the apolipoprotein (a) gene - Its distribution and its association with the risk of cardiovascular disease. Collegium Antropologicum 27: 105–115.
34. Moral P, Marogna G, Salis M, Succa V, Vona G (1994) Genetic data on Alghero population (Sardinia): Contrast between biological and cultural evidence. American Journal of Physical Anthropology 93: 441–453. 35. Rendine S, Calafell F, Cappello N, Gagliardini R, Caramia G, et al. (1997)
Genetic history of cystic fibrosis mutations in Italy. I. Regional distribution. Ann Hum Genet 61: 411–424.
36. Falchi A, Giovannoni L, Calo CM, Piras IS, Moral P, et al. (2006) Genetic history of some western Mediterranean human isolates through mtDNA HVR1 polymorphisms. Journal of Human Genetics 51: 9–14.
37. Barbujani G, Bertorelle G, Capitani G, Scozzari R (1995) Geographical structuring in the mtDNA of Italians. Proceedings of the National Academy of Sciences of the United States of America 92: 9171–9175.
38. Fraumene C, Belle EMS, Castrı` L, Sanna S, Mancosu G, et al. (2006) High resolution analysis and phylogenetic network construction using complete mtDNA sequences in Sardinian genetic isolates. Molecular Biology and Evolution 23: 2101–2111.
39. Malaspina P, Cruciani F, Santolamazza P, Torroni A, Pangrazio A, et al. (2000) Patterns of male-specific inter-population divergence in Europe, West Asia and North Africa. Annals of Human Genetics 64: 395–412.
40. Morelli L, Grosso MG, Vona G, Varesi L, Torroni A, et al. (2000) Frequency distribution of mitochondrial DNA haplogroups in Corsica and Sardinia. Human Biology 72: 585–595.
41. Richards M, Macaulay V, Hickey E, Vega E, Sykes B, et al. (2000) Tracing European founder lineages in the Near Eastern mtDNA pool. American Journal of Human Genetics 67: 1251–1276.
42. Capelli C, Redhead N, Romano V, Calı` F, Lefranc G, et al. (2006) Population structure in the Mediterranean basin: A Y chromosome perspective. Annals of Human Genetics 70: 207–225.
43. Francalacci P, Morelli L, Underhill PA, Lillie AS, Passarino G, et al. (2003) Peopling of three Mediterranean islands (Corsica, Sardinia, and Sicily) inferred by Y-chromosome biallelic variability. American Journal of Physical Anthro-pology 121: 270–279.
44. Scozzari R, Cruciani F, Pangrazio A, Santolamazza P, Vona G, et al. (2001) Human Y-chromosome variation in the western mediterranean area: Implica-tions for the peopling of the region. Human Immunology 62: 871–884. 45. Semino O, Passarino G, Oefner PJ, Lin AA, Arbuzova S, et al. (2000) The
genetic legacy of paleolithic Homo sapiens sapiens in extant europeans: A Y chromosome perspective. Science 290: 1155–1159.
46. Zei G, Lisa A, Fiorani O, Magri C, Quintana-Murci L, et al. (2003) From surnames to the history of Y chromosomes: The Sardinian population as a paradigm. European Journal of Human Genetics 11: 802–807.
47. Francalacci P, Morelli L, Angius A, Berutti R, Reinier F, et al. (2013) Low-pass DNA sequencing of 1200 Sardinians reconstructs European Y-chromosome phylogeny. Science 341: 565–569.
48. Pistis G, Piras I, Pirastu N, Persico I, Sassu A, et al. (2009) High Differentiation among Eight Villages in a Secluded Area of Sardinia Revealed by Genome-Wide High Density SNPs Analysis. PLoS ONE 4: e4654.
49. Naitza S, Porcu E, Steri M, Taub DD, Mulas A, et al. (2012) A Genome-Wide Association Scan on the Levels of Markers of Inflammation in Sardinians Reveals Associations That Underpin Its Complex Regulation. PLoS Genet 8: e1002480.
50. Pilia G, Chen WM, Scuteri A, Orru´ M, Albai G, et al. (2006) Heritability of cardiovascular and personality traits in 6,148 Sardinians. PLoS Genetics 2: 1207–1223.
51. Scuteri A, Sanna S, Chen WM, Uda M, Albai G, et al. (2007) Genome-wide association scan shows genetic variants in the FTO gene are associated with obesity-related traits. Plos Genetics 3: 1200–1210.
52. Terracciano A, Sanna S, Uda M, Deiana B, Usala G, et al. (2010) Genome-wide association scan for five major dimensions of personality. Molecular Psychiatry 15: 647–656.
53. Sutin AR, Milaneschi Y, Cannas A, Ferrucci L, Uda M, et al. (2011) Impulsivity-related traits are associated with higher white blood cell counts. J Behav Med. 54. Angius A, Bebbere D, Petretto E, Falchi M, Forabosco P, et al. (2002) Not all
isolates are equal: Linkage disequilibrium analysis on Xq13.3 reveals different patterns in Sardinian sub-populations. Human Genetics 111: 9–15.
55. Kirin M, McQuillan R, Franklin CS, Campbell H, McKeigue PM, et al. (2010) Genomic runs of homozygosity record population history and consanguinity. PLoS One 5: e13996.
56. Wagner ML (1941) Historische Lautlehre des Sardischen.
57. Pickrell JK, Coop G, Novembre J, Kudaravalli S, Li JZ, et al. (2009) Signals of recent positive selection in a worldwide sample of human populations. Genome Res 19: 826–837.
58. Gompert Z, Buerkle CA (2011) A hierarchical Bayesian model for next-generation population genomics. Genetics 187: 903–917.
59. Gilad Y, Bustamante CD, Lancet D, Paabo S (2003) Natural selection on the olfactory receptor gene family in humans and chimpanzees. Am J Hum Genet 73: 489–501.
60. Lopez Herraez D, Bauchet M, Tang K, Theunert C, Pugach I, et al. (2009) Genetic variation and recent positive selection in worldwide human populations: evidence from nearly 1 million SNPs. PLoS One 4: e7888.