www.nature.com/scientificreports
Effects of trophic status on
microcystin production and the
dominance of cyanobacteria in
the phytoplankton assemblage of
Mediterranean reservoirs
Maria Antonietta Mariani
1, Bachisio Mario Padedda
1, Jan Kaštovský
2, Paola Buscarinu
3,
Nicola Sechi
1, Tomasa Virdis
3& Antonella Lugliè
1The aim of our study was to evaluate the abundance of cyanobacteria and microcystins in four Sardinian reservoirs (Italy) characterised by different trophic status to define a reference picture for future changes. Increasing levels of eutrophication and the abundance of cyanobacteria are expected to occur due to climate change, especially in the southern Mediterranean. Consequently, an in-depth study of the occurrence of harmful cyanobacteria is important to develop appropriate management strategies for water resources at a local scale. Monthly samples were collected at one station in each reservoir over an 18-month period. The Analysis of similarity indicated that cyanobacterial abundance and species composition differed significantly among the reservoirs. The Redundancy analysis highlighted their relationship to trophic, hydrological and seasonal patterns. Spearman’s analysis indicated that there were significant correlations among the most important species (Planktothrix agardhii–rubescens group, Aphanizomenon flos-aquae and Dolichospermum planctonicum), nutrients and microcystins. We highlighted that the species composition during periods of maximum microcystin concentrations differed from those typically reported for other Mediterranean sites. We found new potential
microcystin producers (Aphanizomenon klebahnii, Dolichospermum macrosporum and Dolichospermum viguieri), which emphasised the high diversity of cyanobacteria in the Mediterranean area and the need for detailed research at the local scale.
In freshwater environments, several toxic cyanobacterial species form the most common and noxious type of harmful algal blooms (CyanoHABs1,2), which have potentially serious consequences for human health3. As a result of incidents attributed to toxic CyanoHABs, the World Health Organisation (WHO) and several national authorities around the world recommended that risk assessment plans and safety levels include cyanobacteria as a param-eter that must be monitored4. However, in Italy, there is only a national limit for cyanotoxins and cyanobacteria abundance in bathing water, and no limit has been established for cyanotoxins in drinking water. The provisional WHO guideline of 1 μ g l−1 microcystin-LR is used if local authorities suspect a risk to human health3,5,6. For this reason, it is essential to develop tools for the early prediction of toxic CyanoHABs.
The incidence of blooms has increased worldwide as a result of cultural eutrophication7. Consequently, the threats posed by cyanotoxins are greater1. However, with the current levels of knowledge, researchers cannot com-prehensively evaluate the complex interactions between eutrophication and climate change, though it is likely that climatic factors will result in larger and more frequent bloom events8–12. Filling these knowledge gaps is particularly important in geographical areas where the natural environmental conditions favour the rapid growth of cyanobac-teria and seriously restrict the availability of water. This is the situation at many sites in the Mediterranean basin13–15. 1University of Sassari, Dipartimento di Architettura, Design e Urbanistica, Via Piandanna 4, 07100 Sassari, Italy. 2University of South Bohemia, Faculty of Science, Department of Botany, České Budějovice, Czech Republic. 3Ente
acque della Sardegna, Settore della limnologia degli invasi, Viale Elmas 116, 09122 Cagliari, Italy. Correspondence and requests for materials should be addressed to B.M.P. (email: [email protected])
Received: 13 July 2015 accepted: 09 November 2015 Published: 09 December 2015
Sardinia (Italy) is the second largest island in the Mediterranean Sea. It has only one natural lake, Lake Baratz, and at least 90% of its drinking water is stored in more than 40 reservoirs16. Data for Sardinian reservoirs that were collected on a multi-decadal scale show that most were eutrophic, with phytoplankton communities dom-inated by cyanobacteria17,18. The presence of cyanotoxins was assessed in a number of Sardinian reservoirs, with microcystins (MCs) being the most frequently detected cyanotoxin19–21. These data were derived from short-term surveys that occurred during mono-specific and mixed blooms. The cyanotoxin monitoring program is no longer active in Sardinia, and no research on the relationship between the cyanotoxins and environmental conditions has been conducted.
Our aims were to study the phytoplankton community, the relative abundance of cyanobacteria, the concen-trations of MCs and their relationships to environmental variables in Sardinian reservoirs (Italy) and to define a reference picture for future changes. We focused on describing the seasonal dynamics in four reservoirs with different trophic statuses over an 18-month period (from June 2010 to December 2011). We used statistical analyses to test whether the abundances of cyanobacteria and concentrations of MCs were linked to the trophic status and hydrological conditions of the four reservoirs. It is important to understand the relationships between trophic status and cyanobacterial populations11,22,23 and their associated production of MCs in order to optimise the environmental management of reservoirs in the Mediterranean region.
Materials and Methods
Study sites.
Data were collected from the Bidighinzu (BID), Pattada (PAT), Sos Canales (SCN) and Torrei (TOR) reservoirs (Table 1, Fig. 1), which are located in northern Sardinia (northwest Mediterranean). The four reservoirs are managed by the Regional Agency Ente Acque della Sardegna (ENAS). The main use of the reservoirs is to store drinking water. Only PAT is also used for irrigation. The BID, PAT, and SCN reservoirs belong to the Italian network of long-term ecological research24,25 (LTER-Italy; www.lteritalia.it).Sampling.
Sampling was conducted monthly from June 2010 to December 2011 at a single station close to the deepest part of each reservoir. Water samples for environmental and nutrient variables were collected at fixed depths along a vertical profile from the surface (0.5 m), at depths of 1, 2.5, 5, 7.5, 10, 15 and 20 m, and below the last depth at intervals of 10 m to the bottom using Niskin bottles. For phytoplankton, samples were taken from the first six depths listed above (0.5,1, 2.5, 5, 7.5 and 10 m). For the quantitative toxin analysis, 1 l water samples were collected from the surface (0.5 m).Environmental variables and phytoplankton.
Monthly rainfall values, air temperature and wind inten-sity, as recorded by the ENAS’s meteo-climatic station located close to the dams, were considered during the period from January 2010 to December 2011 to further characterise the reservoirs. The data for TOR were derived from Sardegna Clima Onlus data network (http://www.sardegna-clima.it), considering the meteo-climatic station closest to the reservoir (Tonara).Transparency was assessed based on Secchi disk (SD) measurements. Temperature (T), conductivity (CD), pH, and dissolved oxygen (DO) were measured in the field using a multi-parametric probe (Hydrolab Datasonde 5). The values recorded in the field were replicated in the laboratory for pH (Orion Research Model 960, Beverly, MA, USA) and conductivity (Analytical Control 120).
Water samples were stored in cold dark conditions prior to laboratory analyses. We measured alkalinity (Alk), ammonium (NH4–N), nitrite (NO2–N), nitrate (NO3–N), total nitrogen (TN), reactive silica (RSi), orthophosphate (RP), and total phosphorus (TP) according to Strickland and Parsons26. Chlorophyll a (Chl a) was measured as described by Goltermann et al.27.
Phytoplankton samples (100 ml) were fixed in the field using Lugol’s solution and analysed using Utermöhl’s technique28. Cell abundance was determined microscopically from subsamples (5–10 ml) of the fixed samples, using an inverted microscope (Zeiss, Axiovert 10, Oberkochen, Germany) at 200 × and 400 × magnifications, based on cell counts from an appropriate number of fields. Species were identified from samples of live and fixed
Lake Year
Altitude Area Volume Zmed Catchment basin Trophic status Use
Air
temperature speedWind Rainfall (m a.s.l.) (106 m2) (106 m3) (m) (106 m2) (°C) (m s−1) (mm) BID 1958 334 1.7 12.6 7.3 52 IE AL 15 (7-24) (515-717 958) 850 (0-299) PAT 1984 561 4.4 76 14.9 160 E AL, IR 14 (6-24) (778-915 1246) 656 (0-182) SCN 1956 714 0.3 4.34 13.2 16 ME AL 12 (4-22) (508-929 1332) 534 (0-156) TOR 1968 800 0.2 0.96 17.6 14 OM AL 14 (4-25) (298-483 766) 915 (0-326) Table 1. Physical parameters, trophic status, water uses and meteo-climate data in the 2010–2011 period for the four reservoirs. (Year = year of construction; Zmed = mean depth; Trophic status: IE = hypereutrophic,
www.nature.com/scientificreports/
cells according to the taxonomic guides listed by Marchetto et al.18, Komárek and Komárková29, Komárek and Zapomělová30,31, and Suda et al.32. The taxon bio-volume was determined by multiplying the cell abundance of each taxon by the cell volume, which was obtained by geometrical approximations from the measurement of at least 30 specimens, following the method of Sun and Liu33. The bio-volume was converted to biomass, based on the assumption that 1 mm3 = 1 mg fresh weight biomass34.
The environmental and nutrients data were averaged for the entire water column. The Chl a and phytoplankton data were averaged for the euphotic zone (Zeu = 2.5 times the Secchi disk depth35). The Zeu/Zmix ratio (where Zmix is the mixing depth) was used as a measure of light availability in the mixed layer36. The relative water column stability (RWCS) was calculated following Naselli-Flores37.
Following Reynolds38, we related the dominant and co-dominant phytoplankton species (in terms of biomass) to C–S–R (competitor, C; stress-tolerant, S; ruderal, R) life strategies38,39 to interpret the phytoplankton responses, in terms of growth strategies, to various environmental conditions at both temporal (seasonal) and spatial (site) scales.
The trophic status of the four reservoirs was assessed based on Vollenweider–OECD classification criteria40.
Toxin determination.
MCs and nodularins were detected in water samples by an enzyme-linked immuno-sorbent assay (ELISA), following Fischer et al.41. After a freeze-thaw cycle and ultrasonic treatment (ELMA S 10, Elmasonic), the samples were analysed using an ELISA kit (Microcystins ADDA-ELISA Microtiter Plate Abraxis LLC, Warminster, PA), according to the manufacturer’s protocol. Absorbance was read at a single wave length of 450 nm using a Miniphotometer (model 6 + , Metertech Inc.). The results were expressed as MC-LR equivalents, as indicated by the manufacturer, and were reported in the text as MCs. Samples were considered positive when the MCs concentration was higher than the lowest detection limit (0.10 μ g l–1).Data analyses.
Non-metric multidimensional scaling analyses (nMDS) of species bio-volumes were conducted to assess the differences among sites. A similarity matrix was obtained using a dataset comprising all the cyanobac-terial species. The similarity matrices were based on the Bray–Curtis similarity index. The significance of spatial differences was assessed using a one-way analysis of similarities test (ANOSIM)42, and probability percentages of less than 3% were considered significant. The major species contributing to the spatial differences among reser-voirs and the similarity among samples at each reservoir were investigated using a similarity percentage analysis (SIMPER)42. This analysis broke down the percentage contribution of each species, allowing identification of the species that were most important in creating the observed pattern of difference. A data matrix was constructedFigure 1. Locations of Sardinian reservoirs and sampling stations. The maps were created and assembled
considering all the cyanobacterial species abundances in all the samples for each reservoir. The Bray-Curtis sim-ilarity measure was implicit to SIMPER.
Ordinations were performed using CANOCO43. A detrended correspondence analysis (DCA) was first con-ducted on potentially toxic cyanobacterial species (selected via SIMPER) and MCs concentrations and indicated a linear distribution (with a gradient length between 2 and 3), which validated the use of a direct linear methodology, such as a redundancy analysis (RDA). For the ordination analysis, the data for abiotic and biological variables were transformed by log10 (x + 1). RDA was used to examine the relationships between the abiotic variables (T, CD, Zeu/Zmix, RWCS, NH4–N, NO2–N, NO3–N, TN, RP and TP) and potentially toxic cyanobacterial species and to select the variables that best described the seasonal distribution of potentially toxic cyanobacterial species. The significance of environmental variables in explaining the variance of potentially toxic cyanobacterial species in the RDA was tested using Monte Carlo simulations with 499 permutations.
Non-parametric correlation (Spearman) analyses were used to test the relationships between species selected via SIMPER and environmental variables (SD, T, pH, CD, Alk, DO, Zeu/Zmix and RWCS), nutrients (NH4–N, NO2–N, NO3–N, TN, RP and TP), and Chl a and MCs concentrations. For these analyses, we used the data for the cell abundance of potentially toxic cyanobacterial species at 0.5 m, which was the same depth used for the MCs analyses. A Spearman analysis was conducted using XLSTAT 10.10.
Results
Environmental conditions and nutrients.
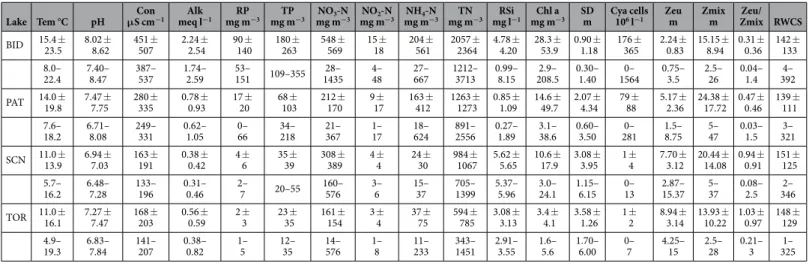
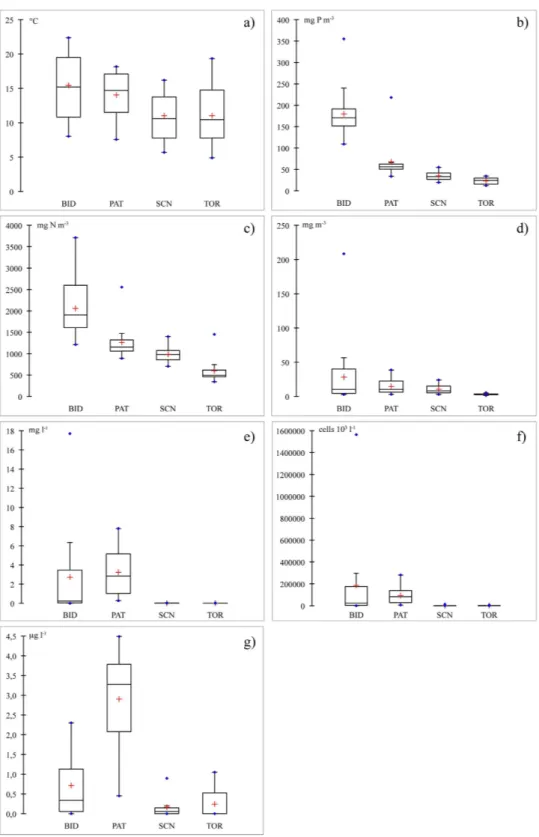
During the study period, the four reservoirs were characterised by different environmental conditions and nutrient concentrations (Table 2). TP and TN clearly increased from TOR to SCN, PAT and BID (Fig. 2). Similarly, there were gradients among the reservoirs for SD transparency, water temperature and Zeu values (Table 2, Fig. 2). There was a stable thermal stratification from June to October in PAT (Zmix: 9.4–10.0 m; Zmax: 40 m) and from June to September in the other reservoirs (BID, Zmix: 5.6–5.8 m, Zmax: 20 m; SCN, Zmix: 5.0–5.8 m, Zmax: 30 m; and TOR, Zmix: 4.4–6.7 m, Zmax: 30 m). Accordingly, RWCS reached its minimum in winter (1 in TOR in November and December, 2 in SCN in December and February, 3 in PAT in December and 4 in BID in February) and its maximum in the summer months (321 in PAT in August, 325 in TOR in July, 346 in SCN in July and 392 in BID in July) (Table 2). The Zeu/Zmix ratio was lowest in the winter-spring months (minimum of 0.03 in PAT in April, 0.04 in BID in December, 0.08 in SCN in February and 0.21 in TOR in April) and highest in summer (maximum of 1.4 in BID in July, 1.5 in PAT in July, 2.5 in SCN in August and 3.0 in TOR in June).The air temperature increased from SCN to TOR, PAT and BID. The wind intensity increased from TOR to BID, PAT and SCN, and rainfall increased from SCN to PAT, BID and TOR (Table 1). Wind intensity was less variable in BID than in the other reservoirs. Rainfall showed a very similar seasonal pattern in all of the reservoirs, with the maximum in October-December and the minimum in May and August (Table 1, Fig. 3).
According to the Vollenweider–OECD classification criteria40, the previously assessed trophic status were confirmed for all the reservoirs (Table 1).
Phytoplankton.
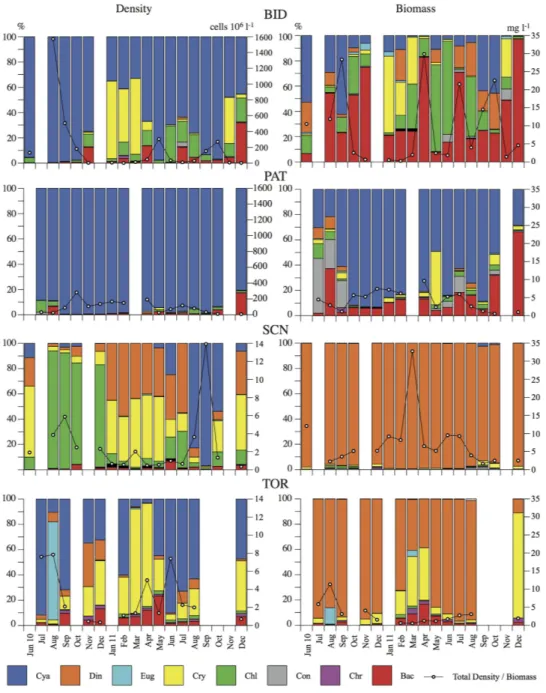
Chl a, cell abundance and biomass values increased from TOR to SCN, PAT and BID (Table 2, Fig. 4). The maximum phytoplankton cell abundances occurred in summer–autumn in all of the reservoirs. The maximum biomass values were in spring and autumn in BID, in spring in PAT and SCN, and in summer in TOR (Fig. 4). Cyanobacteria dominated the cell phytoplankton abundance in the hypereutrophic BID (domi-nant species: Aphanocapsa sp. and Aphanizomenon flos-aquae (L.)), particularly in the eutrophic PAT (domi(domi-nantLake Tem °C pH μ S cmCon−1 meq lAlk−1 mg mRP−3 mg mTP−3 mg mNO3-N−3 mg mNO2-N−3 mg mNH4-N−3 mg mTN−3 mg lRSi−1 mg mChl a−3 SDm Cya cells 106 l−1 Zeum Zmixm Zmix RWCSZeu/
BID 15.4 ± 23.5 8.02 ± 8.62 451 ± 507 2.24 ± 2.54 90 ± 140 180 ± 263 548 ± 569 15 ± 18 204 ± 561 2057 ± 2364 4.78 ± 4.20 28.3 ± 53.9 0.90 ± 1.18 176 ± 365 2.24 ± 0.83 15.15 ± 8.94 0.31 ± 0.36 142 ± 133 8.0– 22.4 7.40– 8.47 387– 537 1.74– 2.59 15153– 109–355 143528– 4– 48 27– 667 1212– 3713 0.99– 8.15 208.52.9– 0.30– 1.40 15640– 0.75– 3.5 2.5– 26 0.04– 1.4 3924– PAT 14.0 ± 19.8 7.47 ± 7.75 280 ± 335 0.78 ± 0.93 17 ± 20 68 ± 103 212 ± 170 9 ± 17 163 ± 412 1263 ± 1273 0.85 ± 1.09 14.6 ± 49.7 2.07 ± 4.34 79 ± 88 5.17 ± 2.36 24.38 ± 17.72 0.47 ± 0.46 139 ± 111 7.6– 18.2 6.71– 8.08 249– 331 0.62– 1.05 660– 34– 218 21– 367 1– 17 18– 624 891– 2556 0.27– 1.89 3.1– 38.6 0.60– 3.50 2810– 1.5– 8.75 5– 47 0.03– 1.5 3213– SCN 11.0 ± 13.9 6.94 ± 7.03 163 ± 191 0.38 ± 0.42 4 ± 6 35 ± 39 308 ± 389 4 ± 4 24 ± 30 984 ± 1067 5.62 ± 5.65 10.6 ± 17.9 3.08 ± 3.95 1 ± 4 7.70 ± 3.12 20.44 ± 14.08 0.94 ± 0.91 151 ± 125 5.7– 16.2 6.48– 7.28 133– 196 0.31– 0.46 2– 7 20–55 160– 576 3– 6 15– 37 1399705– 5.37– 5.96 3.0– 24.1 1.15– 6.15 0– 13 2.87– 15.37 5– 37 0.08– 2.5 3462– TOR 11.0 ± 16.1 7.27 ± 7.47 168 ± 203 0.56 ± 0.59 2 ± 3 23 ± 35 161 ± 154 3 ± 4 37 ± 75 594 ± 785 3.08 ± 3.13 3.4 ± 4.1 3.58 ± 1.26 1 ± 2 8.94 ± 3.14 13.93 ± 10.22 1.03 ± 0.97 148 ± 129 4.9– 19.3 6.83– 7.84 141– 207 0.38– 0.82 1– 5 12– 35 14– 576 1– 8 11– 233 343– 1451 2.91– 3.55 1.6– 5.6 1.70– 6.00 0– 7 4.25– 15 2.5– 28 0.21– 3 3251– Table 2. Mean, standard deviation, and minimum and maximum values of the main parameters in the reservoirs. (Tem=Temperature; Con=Conductivity; Alk=Alkalinity; RP = Reactive Phosphorus; TP = Total
Phosphorus; NO3-N = Nitrate; NO2-N = Nitrite; NH4-N = Ammonium; TN = Total Nitrogen; RSi = Reactive Silica; Chl a = Chlorophyll a; SD=Secchi disk; Cya=Cyanobacteria; Zeu = Euphotic depht; Zmix = Mixing depth; RWCS = Relative Water Column Stability).
www.nature.com/scientificreports/
Figure 2. Boxplots of (a) temperature, (b) TP, (c) TN, (d) Chl a, (e) biomass, and (f) cell abundance of cyanobacteria and (g) MCs in the reservoirs. Box plots were constructed considering total dataset (all
samplings) of averaged values along vertical profile for temperature, TP, and TN; weighted means in the photic zone for Chl a, and biomass and cell abundance of cyanobacteria; and MCs concentrations at superficial depth (0.5 m). Line inside box represents the median; cross inside box represents mean; points represent maxima and minima. Bottom of box is the first quartile; upper part is the third quartile. Whiskers represent limits over which values were considered anomalous.
species: Planktothrix agardhii–rubescens group). Cyanobacteria also dominated the biomass in PAT, whereas Bacillariophyceae dominated the biomass in BID (dominant species: Aulacoseira granulata (Ehrenberg) Simonsen),
Cyclotella ocellata (Pantocsek) and Stephanodiscus sp. (Ehrenberg)) (Fig. 4). Cyanobacteria were less abundant
and important, in terms of the percentage contribution to total phytoplankton, in TOR and SCN (Figs 2 and 4). In SCN and TOR, the phytoplankton biomass was dominated by Dinophyceae (dominant species: Gymnodinium
uberrimum (G.J.Allman) Kofoid and Swezy) and by Cryptophyceae in TOR (dominant species: Plagioselmis lacustris
(Pascher and Ruttner) P. Javornický) (Fig. 4).
S-strategists (i.e., stress tolerant species), which prefer environments with low nutrient concentrations but high energy conditions, were dominant during stratification periods (high Zeu/Zmix) and prevailed in the reservoirs that had lower trophic status (SCN and TOR; e.g., Gymnodinium). R-strategist species (i.e., ruderal species), which are adapted to maximising suspension opportunities and low irradiance values, characterised the periods with low Zeu/Zmix values (mixing periods) in PAT (e.g., Planktothrix spp.) and those with high Zeu/Zmix conditions (stratification periods) in BID (e.g., Aulacoseira), preferring reservoirs that had higher trophic status. C-strategists (i.e., competitive species), which are adapted to environments with low disturbance levels and saturated by light and nutrients, were particularly present during mixing periods in both hypereutrophic (BID; e.g., Cyclotella and
Stephanodiscus species) and mesotrophic conditions (TOR; e.g., Plagioselmis lacustris). Among the cyanobacteria
(Table 3), S-strategist and C-strategist species were the most numerous, especially under hypereutrophic and eutrophic status.
Cyanobacterial species composition and microcystins.
Cyanobacterial species were more numerous in BID (32) and PAT (31) than in SCN (10) and TOR (8) (Table 3). The three dominant species, in terms of cell abundance, in hierarchical order were Aph. flos-aquae, Cyanocatena imperfecta (Cronberg & Weibull) Joosten and Aphanocapsa spp. in BID; Planktothrix agardhii-rubescens group, Aphanocapsa spp. and Aph. flos-aquae in PAT; Anathece sp., Dolichospermum viguieri (Denis and Frémy) Wacklin, Hoffmann and Komá rek (= Anabaenaviguieri Denis and Fremy) and Planktothrix agardhii-rubescens group in SCN; and Anathece sp., Aphanocapsa spp.
and Dolichospermum spp. in TOR (Fig. 5).
Figure 3. Air temperature (a), wind speed (b) and rainfall (c) dynamics in the four reservoirs during the years 2010 and 2011.
www.nature.com/scientificreports/
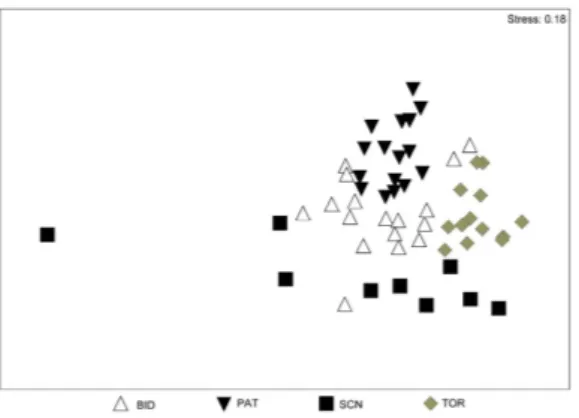
The ANOSIM revealed significant differences in the cyanobacterial assemblages among the four reservoirs (ANOSIM Global R = 0.55, p < 0.001). The nMDS analyses showed that the data clusters were more compact for PAT and TOR (Fig. 6) and, therefore, that the differences among samplings were minimal in these reservoirs. These findings were supported by the SIMPER results, which indicated that the high level of data similarity in samples from PAT (33.69%) was attributable to the P. agardhii–rubescens group (75.57% contribution). The great-est differences in the cyanobacterial assemblages were between PAT and SCN (99.50%), between PAT and TOR (99.35%), and between BID and SCN (99.30%). There were smaller but significant differences between SCN and TOR (97.81%) and between BID and PAT (94.02%). P. agardhii–rubescens group, Aph. flos-aquae, Aphanizomenon sp. and Dolichospermum planctonicum (Brunnthaler) Wacklin, Hoffmann and Komá rek (= Anabaena planctonica Brunnth) were the species that were mainly responsible for the differences in cyanobacterial assemblages (con-tribution > 10%) between PAT and BID and between these two reservoirs and SCN and TOR. The species mainly responsible for the differences in cyanobacterial assemblages (contribution > 10%) between SCN and TOR were
Anathece sp., Dolichospermum sp. (Anabaena sp.), D. viguieri, and D. planctonicum.
Figure 4. Phytoplankton class composition in terms of cell abundance and biomass with respect to total cell abundance and biomass in Bidighinzu Lake (BID), Pattada Lake (PAT), Sos Canales Lake (SCN) and Torrei Lake (TOR) during the study period. (Bac = Bacillariophyceae; Chr = Chrysophyceae;
Con = Conjugatophyceae; Chl = Chlorophyceae; Cry = Cryptophyceae; Eug = Euglenophyceae; Din = Dinophyceae; Cya = Cyanobacteria).
We detected potentially toxic cyanobacterial species in all of the reservoirs (Table 3). The potentially toxic spe-cies identified in this study included the first records for Sardinia for: Dolichospermum macrosporum (Klebahn) Wacklin, Hoffmann and Komá rek (= Anabaena macrospora Klebahn) in BID and PAT; D. viguieri in BID, PAT and SCN; and Aphanizomenon klebahnii (Elenkin) Pechar and Kalina in BID (Fig. 7).
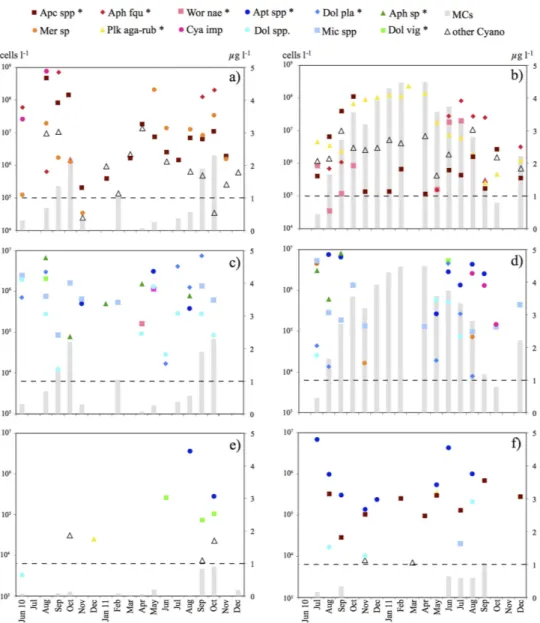
MCs were detected in 71% of the analysed samples (n = 62), including 43% of samples from TOR (n = 14), 63% of samples from SCN (n = 16), 75% of samples from BID (n = 16), and 100% of samples from PAT (n = 16). A concentration > 1 μ g l–1 MC-LR was found in almost half of the samples but was found only once in TOR and never in SCN (Fig. 5).
The highest concentrations of MCs were in the summer–autumn period in BID, SCN, and TOR. The highest MC concentrations coincided with high cell abundances at the superficial depth of Aphanocapsa sp. and Aph. flos-aquae in BID, D. viguieri in SCN, and Dolichospermum sp. (Anabaena sp.) in TOR. In contrast, the maximum MCs con-centrations were in PAT in winter–spring; these were the highest concon-centrations detected in this study. In PAT, the maximum MCs concentrations in winter–spring coincided with the highest cell abundances of cyanobacteria from October to April (from January to April, cell abundance of > 181 × 106 cells l–1, and MCs concentration of > 4 μ g l–1), due to the P. agardhii–rubescens group affirmation. In particular, in samples from December 2010 to April 2011, the dominant species was P. rubescens (De Candolle ex Gomont) Anagnostidis and Komárek (= Oscillatoria rubescens De Candolle ex Gomont) (Fig. 7).
Relationships between cyanobacterial species and environmental variables.
The first two axes of the RDA accounted for 72.7% of the variance represented in a cyanobacterial potentially toxic species–environ-mental variables triplot (axis 1: 43.4%; axis 2: 29.3%; Fig. 8). The RDA indicated that there were three significantTable 3. Cyanobacterial species and their presence (black) in the four reservoirs: Bidighinzu (BID), Pattada (PAT), Sos Canales (SCN) and Torrei (TOR). (C-S-R strategy = competitor, C; stress tolerant, S;
ruderal, R). (MC = Microcystin; SX = Saxitoxin; AN-a = Anatoxin-a; AN-a (S) = Anatoxin-a (S)). Numbers indicate the dominant species in hierarchical order during summer months.
www.nature.com/scientificreports/
variables: T (F = 4.71, P = 0.002), Zeu/Zmix (F = 3.56, P = 0.006) and RP (F = 2.62, P = 0.012). Together, these variables accounted for 16% of the total variance in the cyanobacterial data (25%). The first RDA axis clearly showed the trophic gradient, from reservoirs with lower trophic status (SCN and TOR) on the left, to those with higher trophic status (BID and PAT) on the right. According to the trophic gradient, all of the potentially toxic cyanobacterial species and MCs were positioned on the right. The first axis was positively correlated with NH4–N (0.72), T (0.67), and TP (0.65), and negatively correlated with NO3–N (− 0.24) and Zeu/Zmix (− 0.31). The second RDA axis clearly showed, from bottom to top, a seasonal gradient from warmer (summer and autumn) to colder (winter and spring) months. The second axis was positively correlated with NO2–N (0.55) and negatively correlated with RWCS (− 0.53). The potentially toxic cyanobacterial species were positioned on the negative side of the second axis, consistent with their strong seasonal pattern (summer–autumn). The only exceptions were Dolichospermum spp. and, especially, the P. agardhii–rubescens group, which were positioned on the positive side of the axis.
Table 3. Cyanobacterial species and their presence (black) in the four reservoirs: Bidighinzu (BID), Pattada (PAT), Sos Canales (SCN) and Torrei (TOR). (C-S-R strategy = competitor, C; stress tolerant, S;
ruderal, R). (MC = Microcystin; SX = Saxitoxin; AN-a = Anatoxin-a; AN-a (S) = Anatoxin-a (S)). Numbers indicate the dominant species in hierarchical order during summer months.
Figure 5. Abundance of dominant cyanobacterial species, and MCs concentrations. (a) Species with
abundance always > 104 cells l−1 in Bidighinzu Lake; (b) species with abundance always > 104 cells l−1 in Pattada Lake; (c) species with abundance always < 107 cells l−1 in Bidighinzu Lake; (d) species with abundance always < 107 cells l−1 in Pattada Lake; (e) species in Sos Canales Lake and (f) Torrei Lake. (* = potentially toxic species; Apc spp* = (Aphanocapsa sp.* + Aphanocapsa incerta* + Aphanocapsa delicatissima*); Ant spp* = (Anathece sp.* + Anathece chlatrata* + Anathece minutissima); Cya imp* = Cyanocatena imperfecta; Mer sp = Merismopedia sp.; Mic spp* = (Microcystis sp.* + Microcystis aeruginosa* + Microcystis flos-aquae* + Microcystis wesembergii*); Wor nae* = Woronichinia naegeliana; Dol pla* = Dolichospermum planctonicum; Dol vig* = Dolichospermum viguieri; Dol spp* = (Anabaena sp.* + Dolichospermum macrosporum* +
Dolichospermum spiroides* + Dolichospermum flos-aquae*); Aph fqu* = Aphanizomenon flos-aquae;
Aph sp* = Aphanizomenon sp.; Plk agr* = Planktothrix agardhii-rubescens group; other Cyano = other cyanobacteria).
Spearman’s analysis indicated that the occurrence of the P. agardhii–rubescens group was significantly negatively correlated with transparency (SD; r = –0.280, p < 0.05) and with RWCS (r = –0.272, p < 0.05). The occurrence of Aph. flos-aquae and D. planctonicum were significantly correlated with T (r = 0.367, p < 0.001 and r = 0.407,
p < 0.001, respectively), RP (r = 0.314, p < 0.05 and r = 0.425, p < 0.01, respectively) and TP (r = 0.339, p < 0.01
and r = 0.377, p < 0.01, respectively). Aph. flos-aquae was also significantly correlated with TN (r = 0.292, p < 0.05) and NH4–N (r = 0.281, p < 0.05). The P. agardhii–rubescens group was strongly significantly correlated with MCs (r = 0.740, p < 0.0001).
Discussion
Trophic status, environmental conditions and phytoplankton.
Based on the Vollenweider–OECD classification criteria40, there was a trophic gradient among the four reservoirs. These data were consistent with the results of previous studies16,17 and supported our choice of these reservoirs as prototypical examples of reservoirs with different trophic status for inclusion in our study.Nutrient enrichment of water bodies (eutrophication) is considered the main driver of cyanobacterial abun-dance8,44 and persistence23,45,46. Therefore, we expected that the occurrence of cyanobacteria and their toxic blooms would increase along the trophic gradient of the reservoirs. We found that cyanobacterial abundance differed significantly among the reservoirs (ANOSIM results), with greater abundance in the eutrophic and hypereutrophic PAT and BID than in the oligo- and meso-eutrophic SCN and TOR. The RDA clearly highlighted this relationship, and Spearman’s analysis indicated that there were significant correlations among the most abundant species in eutrophic reservoirs (i.e., P. agardhii–rubescens group, Aph. flos-aquae and D. planctonicum), nutrients, and MCs. The RDA also revealed seasonal patterns. These findings were consistent with the ecological preferences of many potentially toxic cyanobacterial species, such as Aph. flos-aquae and D. planctonicum, which prefer high summer temperatures and high water stability16. By contrast, the ecological preferences (low irradiance and low water
Figure 6. nMDS of differences among sites with respect to biomass of all cyanobacterial species.
Figure 7. (a) Planktothrix rubescens group trichome; (b) Dolichospermum macrosporum and its typical acinetes;
(c) Aphanizomenon klebahnii tricome and (d) Its typical acinete; (e) Dolichospermum viguieri and its typical position of acinetes and heterocysts. (a), (b) and (e) bar=20 μm; (d) bar=50 μm; (c) bar=100 μm.
www.nature.com/scientificreports/
stability) of the P. agardhii–rubescens group agreed with its autumn-winter affirmation in PAT. Although there was a temperature gradient among the four studied reservoirs (Table 2, Fig. 2), their monomictic character was evident from the stable thermal stratification throughout the summer–autumn period. In general, during thermal strati-fication, the hydrology of Mediterranean reservoirs favours nutrient accumulation in the deeper water layers. The nutrient levels can increase because of nutrient release from sediment under anoxic conditions, and long periods of stratification can increase hypolimnetic oxygen depletion47. Operational procedures and water level fluctuations in summer months can cause the breakdown of the thermal stratification and the re-distribution of nutrients during the period that is most favourable for phytoplankton growth48. Moreover, the water turbulence generated during the emptying phase, along with the disruption of stratification, can increase the amount of particulate material in the water column because of re-suspension from the bottom49. Based on our data, these effects appear to be less pronounced in these Sardinian reservoirs because they are generally deeper and more interconnected, thus ensur-ing the persistence of stratification until autumn16,18,25. Similar scenarios for other deep Mediterranean reservoirs were reported in other studies. For example, seasonal variations in thermal stratification were maintained during selective water withdrawal50 and during refilling of the reservoir via a water pump located on the river51 or via the natural flow of a river tributary36.
Long periods of stable stratification are competitively advantageous for gas-vacuolated cyanobacterial spe-cies (e.g., Microcystis, Dolichospermum, and Aphanizomenon), which can regulate their position in the water column (buoyancy) to optimise the use of resources (nutrients and light)8. These genera were reported to be the main CyanoHAB producers in the Mediterranean in the summer–autumn period13. In our study, a similar case was observed in BID and SCN, where Aphanizomenon and Dolichospermum (Anabaena) were important gen-era. Aphanizomenon and Dolichospermum (Anabaena) are considered S-strategists, preferring high hydrological stability and high Zeu/Zmix38,52. By contrast, long-lasting stratification with consequent high levels of nutrient enrichment of the hypolimnion, followed by mixing of the entire water column in late autumn, can significantly affect the cyanobacterial species composition, thus favouring, for example, Planktothrix blooms8. This was the case for PAT, which was subjected to a longer stratification period and the extensive growth of Planktothrix species from late autumn to spring during mixing. Planktothrix species are considered R-strategists because they are adapted to maximising suspension opportunities and low irradiance values38.
Species composition of Cyanobacteria.
The occurrence of more than 20 species of potentially toxic cyano-bacteria followed the trophic gradient in PAT and BID, whereas in SCN and TOR there were 10 or fewer species. We identified cyanobacterial species that were previously reported in Sardinian reservoirs17,18 and from otherFigure 8. Triplot diagram for RDA of data from four studied reservoirs. Data included environmental
variables (explanatory variables), cyanobacterial potentially toxic species (dependent variables), and samples.
Squares Sos Canales Lake samples, circles Torrei Lake samples, triangles Bidighinzu Lake samples, stars
Pattada Lake samples, T temperature, NO3–N nitrate, NO2–N nitrite, NH4–N ammonium, TN total nitrogen,
RP orthophosphate, TP total phosphorus, Mn manganese, Fe iron, SD Secchi disk transparency, DO dissolved
oxygen, pH, MCs microcystins, Plk agr Planktothrix agardhii-rubescens group, Aph fqu Aphanizomenon
flos-aquae, Aph sp. Aphanizomenon sp., Dol pla Dolichospermum planctonicum, Dol vig Dolichospermum viguieri, Dol spp Dolichospermum spp., Apt spp Anathece spp.
Mediterranean sites13,52. However, we also found species that were not previously reported in these areas. These species included D. macrosporum (Klebahn) Wacklin, Hoffmann and Komá rek (Fig. 4), Aph. klebahnii (Elenkin) Pechar and Kalina, and D. viguieri (Fig. 4). D. macrosporum (found in BID and PAT) was reported in Britain53, France54, Romania55, Germany56, Spain57 and the Czech Republic58, and it is known to be toxic57. Aph. klebahnii (found in BID) was reportedly distributed in temperate zones59, the Baltic Sea60, and Lithuania61, and it is thought to be potentially harmful because it produces MCs62. D. viguieri (found in BID, PAT and SCN) was reported in Britain53, the Czech Republic63, Greece64, and Russia65, and it is a potential MCs producer66.
Aphanocapsa sp., Aph. flos-aquae, D. viguieri, Dolichospermum sp. (Anabaena sp.), and the P. agardhii–rubes-cens group, especially P. rubesagardhii–rubes-cens, were the most important in determining the maximum of the cyanobacteria
abundance in the studied reservoirs. This result suggested that there was a marked reduction in the occurrence and importance of Microcystis compared with previous scenarios in the same reservoirs. M. aeruginosa (Kűtzing sensu Teiling) and M. flos-aquae (Wittrock) Kirchner were the dominant cyanobacteria in the summer–autumn periods in BID17, and Microcystis spp. were dominant in the summers of 1988, 1997, and 1999 in PAT67. Planktothrix spp. dominated the winter–spring months between 2004 and 2005 in TOR20 but were rarely found in this study. Dolichospermum planctonicum and D. ellipsoides (Bolochoncev) (= Anabaena elliptica Lemmermann) were reported
as dominant in SCN in the summer–autumn months of 1993, following the strong dominance of Aphanocapsa and Anathece of 1991 and 199268. In the present study, we detected significant quantities of these members of the Chroococcales and detected D. viguieri for the first time.
Cyanobacteria and toxicity.
We found a progressive increase in the occurrence of cyanobacterial abundance and MCs in response to increasing trophic status in these four Sardinian reservoirs. Nutrient over enrichment of waters by human pressure, such as wastewaters from urban centres, agricultural, and industrial activities, has promoted the growth of cyanobacteria as harmful algal blooms10. In most cases, the delimitation of the factors con-trolling and promoting the development of cyanotoxins was not clear and was very difficult to address69. Focusing on MCs, several studies revealed a huge variability in the concentrations. Salmaso et al.69 indicated that most of this variability was due to differences in the cyanobacterial biomass in lakes of different trophic status. The authors also highlighted the importance of the fraction of toxic and non-toxic genotypes within cyanobacterial species and physiological variation in toxin quota (MC concentration per cell or unit biomass) in toxic populations. In approx-imately 50% of the samples analysed in our study, the concentration of MCs exceeded the MC-LR drinking water guideline (> 1 μ g l–1)70, which indicated that the waters of the hypereutrophic BID and, especially, the eutrophic PAT posed a significant threat to human health. Surprisingly, the WHO limit was exceeded once in TOR, and MCs were detected on other occasions, including in SCN. Messineo et al.20 reported that MCs were detected in TOR in 2004 and 2005, corresponding to abundant Planktothrix, but the concentrations were always low (< 1 μ g l–1). Overall, the proportion of positive samples was similar to that reported in a number of studies, including those conducted in other countries13,64. Our data further emphasised the need for the continuous monitoring of cyanobacterial toxicity, especially in areas where resources are limited, such as in Sardinia and the Mediterranean basin in general.In our study, the maximum MCs concentrations were detected in summer–autumn, when the reservoirs were stratified and the temperature was 20–30 °C, except in PAT. This seasonality was consistent with that observed in other studies on Mediterranean reservoirs13,71. However, Cook et al.64 indicated that cyanobacterial blooms may start before summer and persist until after autumn. Cook et al.64 and Carrasco et al.13 also reported that M. aeruginosa was the most widespread and most frequently occurring toxic species in the entire Mediterranean
region, thus confirming the findings of Abdel-Rahman et al.72 and Oudra et al.73. A toxic strain of M. aeruginosa was isolated from a reservoir in northern Sardinia, Lake Liscia, and was associated with a fish-kill event19. In our study, M. aeruginosa was never dominant during periods of peak MCs concentrations. Rather, these periods coincided with the occurrence of high numbers of Chroococcales in the genus Aphanocapsa (BID); N2-fixing Nostocales, including Aph. flos-aquae (BID) and D. viguieri (SCN) and Dolichospermum sp. (Anabaena sp.) (TOR); and Oscillatoriales, including members of the P. agardhii–rubescens group (PAT). Aph. flos-aquae dominated in the more eutrophic reservoirs (BID and PAT). Spearman’s correlation analysis and RDA indicated that the occurrence of Aph. flos-aquae was significantly correlated with the main nutrients (RP, TP, NH4–N, and TN) and temperature, which was consistent with its preference for summer months. Aph. flos-aquae was linked to saxitoxin production in the United States. Aphanizomenon spp. was linked to saxitoxin production in Greece74, anatoxin-a production in Finland and Germany75 and cylindrospermopsin production in Poland76 and Germany77. However, the production of MCs by Aphanizomenon species has not been conclusively demonstrated71,78. In our case, although the period of peak MCs partly coincided with high cell abundances of Aph. flos-aquae in BID and PAT, it was likely that other cyanobacterial species present at the same time (i.e., Microcystis spp., D. planctonicum and Aphanocapsa spp.) were responsible for the high MCs concentrations. In contrast, the toxicity of various Dolichospermum (Anabaena) species, including D. vigueri, was well documented75,79,80. A strain of D. planctonicum (= A. planctonica) from Mulargia Lake (south-central Sardinia) was shown to produce unidentified MC–like peptides20, and this species dominated in Sardinian reservoirs whose waters contained high concentrations of extracellular MCs20. Finally, because large populations of Aphanocapsa species coincided with high MCs concentrations in BID and PAT, fur-ther studies are required to evaluate their toxicity and ecology in the Mediterranean basin. To date, the ability of
Aphanocapsa to produce MCs was only demonstrated for Aphanocapsa cumulus81 from Botswana, which is more widely distributed in tropical regions82.
The MCs maxima occurred in winter–spring in PAT during a bloom of the P. agardhii–rubescens group, which confirmed the occurrence of harmful strains of this group in Mediterranean reservoirs. This result also illustrated that the ecological requirements of these species differed from those of the other species in this study. In general,
Planktothrix show strong growth in relatively low-nutrient conditions, potentially enabling them to inhabit waters
with a wide range of trophic status69. Since the mid-1980s, these species have been reported from a number of Mediterranean sites, including natural lakes83, reservoirs20,84,85, and lagoons86. The abundance of Planktothrix
www.nature.com/scientificreports/
increased in the more eutrophic lakes south of the Alps87. In Lake Garda, the appearance of mesotrophic and eutrophic species (i.e., P. rubescens) after the 1970s and during the 1980s illustrated the strong effect of eutrophi-cation on the phytoplankton community88. A similar trend was observed in Lake Maggiore over a long period89. Among the species in this group, P. rubescens is one of the most widespread toxin-producing cyanobacteria in European lakes83,90. It is thought to be the species that produces the highest concentration of MCs per cell among all known cyanobacteria91. The red-pigmented P. rubescens was reported to be the most representative cyanobacterium in the subalpine region, and it is common in deep and well-stratified lakes92,93. In Sardinia, P. rubescens caused the extremely dangerous cyanotoxin events that occurred in the winter months in the Mulargia and Flumendosa Lakes in 198520. By contrast, P. agardhii (Gomont) Anagnostidis and Komàrek, another species in the P. agardhii-rubescens group, is most frequently observed in shallow and eutrophic lakes and is frequently found in the northern hemi-sphere84. Bonilla et al.94 reported that P. agardhii (Gomont) Anagnostidis and Komárek is common in eutrophic freshwaters, based on analysis of a large database (940 samples) covering different climatic regions and the Northern and Southern hemispheres. Toxic strains of this species were also isolated from several European lakes95.
The most abundant cyanobacterium in this study, P. rubescens, was reported to produce concentrated metal-imnetic populations during thermal stratification in summer and autumn, when sufficient light penetrated into these water layers93,96. The presence of P. rubescens becomes evident when the trichomes move towards the surface during mixing in winter or when the water turbidity increases. The vertical distribution of the P. agardhii-rubescens group in PAT was consistent with this pattern (data not shown). In Sardinian reservoirs, transparency minima were linked both to summer phytoplankton growth and winter sediment runoff from the catchment97, accentuated by the strong seasonality of rainfall. Consistent with these results, the Spearman’s correlation analysis and RDA in this study indicated that the P. agardhii–rubescens group was negatively correlated with Secchi disk transparency. In any case, this relationship may depend, at least partly, on the increased turbidity resulting from the abundance of the
P. agardhii–rubescens group in the mixing period. Excessive growth of this species produces characteristic reddish
water discoloration, which generates alarm among nearby residents and lake managers. Our data suggest that this alarm is warranted because of the high toxin concentrations in PAT during the periods of maximum cell abun-dance of this species. On these occasions, the WHO MC limit was substantially exceeded for long periods (Fig. 5).
Conclusions
Our study complemented and updated what was already known for the study areas16–18,20,25,67,68,98,99 and enabled us to support the findings of other similar case studies in other geographical areas97,100,101. Our study provided important evidence for the strong relationships among trophic status, cyanobacterial abundance, and MCs con-centrations in Sardinian reservoirs, indicating a key role of nutrients in determining cyanobacteria affirmation. Moreover, we confirmed that the temperature and Zeu/Zmix ratio were important factors in cyanobacteria devel-opment10,12,94,102,103. However, the water management of reservoirs, linked to the different needs and uses, further increases the ecosystem complexity and the difficulty in understanding the multiple relationships between biotic and abiotic components.
We also highlighted that the species composition during periods of maximum MCs concentrations in the four reservoirs differed from those typically reported for other Mediterranean sites13,64 and that the P. agardhii-rubescens group was dominant during the period in which the MCs concentrations substantially exceeded the WHO limit. Our results included the first reports of some potentially toxic species in reservoirs of the Mediterranean basin, emphasising the importance of long-term studies for the early detection of community changes. This is especially important when the changes involve harmful species. Phytoplankton responses to nutrient variations cannot be separated from responses to other, larger environmental changes occurring at the same time, such as global climate change. In particular, increasing levels of eutrophication and the abundance of cyanobacteria are expected due to climate change, especially in the southern Mediterranean and islands. Cyanobacteria are also expected to be favoured by higher temperatures10,103, especially at lower levels of nutrient concentrations12. In any case, the progres-sive enlargement of the geographical distribution of harmful species both in Mediterranean area and globally104–106 highlights the need for further detailed research on their ecology, toxicology, and genetics at the local scale.
References
1. Carmichael, W. A world overview–one-hundred-twenty-seven years of research on toxic cyanobacteria–where do we go from here?
Adv. Exp. Med. Biol. 619, 105–25 (2008).
2. Gkelis, S., Harjunpää, V., Lanaras, T. & Sivonen, K. Diversity of hepatotoxic microcystins and bioactive anabaenopeptins in cyanobacterial blooms from Greek freshwaters. Environ. Toxicol. 20, 249–256 (2005).
3. Codd, G. et al. CYANONET A global network for cyanobacterial bloom and toxin risk management. (UNESCO, 2005).
4. Codd, G. A., Morrison, L. F. & Metcalf, J. S. Cyanobacterial toxins: risk management for health protection. Toxicol. Appl. Pharmacol.
203, 264–72 (2005).
5. Chorus, I. Current approaches to cyanotoxin risk assessment, risk management and regulations in different countries (2005) | Umweltbundesamt. 122 (2005).
6. Burch, M. D. Cyanobacterial Harmful Algal Blooms: State of the Science and Research Needs. Advances in experimental medicine
and biology 619, (Springer, New York, 2008).
7. Taranu, Z. E. et al. Acceleration of cyanobacterial dominance in north temperate-subarctic lakes during the Anthropocene. Ecol.
Lett. 18, 375–84 (2015).
8. Huber, V., Wagner, C., Gerten, D. & Adrian, R. To bloom or not to bloom: contrasting responses of cyanobacteria to recent heat waves explained by critical thresholds of abiotic drivers. Oecologia 169, 245–56 (2012).
9. O’Neil, J. M., Davis, T. W., Burford, M. A. & Gobler, C. J. The rise of harmful cyanobacteria blooms: The potential roles of eutrophication and climate change. Harmful Algae 14, 313–334 (2012).
10. Paerl, H. W. & Huisman, J. Climate. Blooms like it hot. Science 320, 57–8 (2008).
11. Carey, C. C., Ibelings, B. W., Hoffmann, E. P., Hamilton, D. P. & Brookes, J. D. Eco-physiological adaptations that favour freshwater cyanobacteria in a changing climate. Water Res. 46, 1394–1407 (2012).
12. Rigosi, A. et al. Determining the probability of cyanobacterial blooms: the application of Bayesian networks in multiple lake systems.
13. Carrasco, D. et al. Cyanobacterial abundance and microcystin occurrence in Mediterranean water reservoirs in Central Spain: microcystins in the Madrid area. Eur. J. Phycol. 41, 281–291 (2006).
14. Moustaka-Gouni, M., Vardaka, E. & Tryfon, E. Phytoplankton species succession in a shallow Mediterranean lake (L. Kastoria, Greece): steady-state dominance of Limnothrix redekei, Microcystis aeruginosa and Cylindrospermopsis raciborskii. Hydrobiologia
575, 129–140 (2006).
15. Barone, R., Castelli, G. & Naselli-Flores, L. Red sky at night cyanobacteria delight: the role of climate in structuring phytoplankton assemblage in a shallow, Mediterranean lake (Biviere di Gela, southeastern Sicily). Hydrobiologia 639, 43–53 (2009).
16. Marchetti, R. et al. Studies on Italian reservoirs. Mem. dell’Istituto Ital. di Idrobiol. 50, 337–363 (1992). 17. Sechi, N. & Lugliè, A. Phytoplankton in Sardinian reservoirs. G. Bot. Ital. 130, 977–994 (1996).
18. Marchetto, A., Padedda, B. M., Mariani, M. A., Lugliè, A. & Sechi, N. A numerical index for evaluating phytoplankton response to changes in nutrient levels in deep mediterranean reservoirs. J. Limnol. 68, 106–121 (2009).
19. Pellegrini, S., Grilli Caiola, M. & Sechi, N. Microcystis from Lake Liscia (Sardinia – Italy). Paper presented at VIII International
Symposium of Phototrophic Prokaryotes Abstract, Urbino. Firenze: Consiglio Nazionale delle Ricerche, Area della Ricerca di Firenze.
(1995, September 10-15).
20. Messineo, V. et al. Cyanobacterial toxins in Italian freshwaters. Limnol. - Ecol. Manag. Inl. Waters 39, 95–106 (2009).
21. Sulis, A., Buscarinu, P., Soru, O. & Sechi, G. M. Trophic state and toxic cyanobacteria density in optimization modeling of multi-reservoir water resource systems. Toxins (Basel). 6, 1366–84 (2014).
22. Hallegraeff, G. M. A review of harmful algal blooms and their apparent global increase*. Phycologia 32, 79–99 (1993).
23. Rigosi, A., Carey, C. C., Ibelings, B. W. & Brookes, J. D. The interaction between climate warming and eutrophication to promote cyanobacteria is dependent on trophic state and varies among taxa. Limnol. Oceanogr. 59, 99–114 (2014).
24. Padedda, B. M. et al. in La rete italiana per la ricerca ecologica a lungo termine. Situazione e prospettive dopo un quinquennio di
attività (2006-2011) (ed. Bertoni, R.) 143–154 (Aracne editrice S.r.l., 2012).
25. Mariani, M. A. et al. Long-term ecological studies on phytoplankton in Mediterranean reservoirs: a case study from Sardinia (Italy).
Inland Waters 5, 339–354.
26. Strickland, J. D. H. & Parsons, T. R. A practical handbook of seawater analysis,. (Fisheries Research Board of Canada, 1972). 27. Golterman, H. L., Clymo, R. S. & Ohnstadt, M. A. M. Methods for Physical and Chemical Analysis of Freshwaters. (Blackwell Scientific
Publications, 1978).
28. Utermhöl, H. Zur vervollkhung der quantitativen phytoplanktonmethodik. Mitteilungen Int. Vereinigung für Theor. und Angew.
Limnol. 9, 1–38 (1958).
29. Komárek, J. & Komárková, J. Review of the European Microcystis morphospecies (Cyanoprokaryotes) from nature. Fottea 2, 1–24 (2002).
30. Komarek, J. & Zapomelova, E. Planktic morphospecies of the cyanobacterial genus Anabaena = subg. Dolichospermum - 1. part: coiled types. Fottea 7, 1–31 (2007).
31. Komarek, J. & Zapomelova, E. Planktic morphospecies of the cyanobacterial genus Anabaena = subg. Dolichospermum - 2. part: straight types. Fottea 8, 1–14 (2008).
32. Suda, S. et al. Taxonomic revision of water-bloom-forming species of oscillatorioid cyanobacteria. Int. J. Syst. Evol. Microbiol. 52, 1577–95 (2002).
33. Sun, J. & Liu, D. Geometric models for calculating cell biovolume and surface area for phytoplankton. J. Plankton Res. 25, 1331–1346 (2003).
34. Liu, X., Lu, X. & Chen, Y. The effects of temperature and nutrient ratios on Microcystis blooms in Lake Taihu, China: An 11-year investigation. Harmful Algae 10, 337–343 (2011).
35. Poikane, S. Water Framework Directive Intercalibration technical report. Part 2: Lakes. (Office for Official Publications of the European Communities, 2009).
36. Becker, V. et al. Driving factors of the phytoplankton functional groups in a deep Mediterranean reservoir. Water Res. 44, 3345–54 (2010).
37. Naselli-Flores, L. Man-made lakes in Mediterranean semi-arid climate: the strange case of Dr Deep Lake and Mr Shallow Lake.
Hydrobiologia 506–509, 13–21 (2003).
38. Reynolds, C. S. in Growth and reproductive strategies of freshwater phytoplankton (ed. Sandgren, C. D.) 388–433 (Cambridge University Press, 1988).
39. Reynolds, C. S. Towards a functional classification of the freshwater phytoplankton. J. Plankton Res. 24, 417–428 (2002). 40. Vollenweider, R. A. & Kerekes, J. Eutrophication of waters. Monitoring, assessment and control. (OECD Publications, 1982). 41. Fischer, W. J. et al. Congener-Independent Immunoassay for Microcystins and Nodularins. Environ. Sci. Technol. 35, 4849–4856
(2001).
42. Clarke, K. & Warwick, R. Change in marine communities: an approach to statistical analysis and interpretation, 2rd ed. (PRIMER-E, 2001).
43. Ter Braak, C. & Šmilauer, P. Reference manual and CanoDraw for Windows User’s guide: Software for Canonical Community Ordination (version 4.5). (Microcomputer Power, 2002).
44. Paerl, H. W. & Paul, V. J. Climate change: links to global expansion of harmful cyanobacteria. Water Res. 46, 1349–63 (2012). 45. Brookes, J. D. & Carey, C. C. Ecology. Resilience to blooms. Science 334, 46–7 (2011).
46. Gkelis, S., Papadimitriou, T., Zaoutsos, N. & Leonardos, I. Anthropogenic and climate-induced change favors toxic cyanobacteria blooms: Evidence from monitoring a highly eutrophic, urban Mediterranean lake. Harmful Algae 39, 322–333 (2014).
47. Foley, B., Jones, I. D., Maberly, S. C. & Rippey, B. Long-term changes in oxygen depletion in a small temperate lake: effects of climate change and eutrophication. Freshw. Biol. 57, 278–289 (2012).
48. Naselli-Flores, L. & Barone, R. Water-Level Fluctuations in Mediterranean Reservoirs: Setting a Dewatering Threshold as a Management Tool to Improve Water Quality. Hydrobiologia 548, 85–99 (2005).
49. Geraldes, A. M. & Boavida, M.-J. Seasonal water level fluctuations: Implications for reservoir limnology and management. Lakes
Reserv. Res. Manag. 10, 59–69 (2005).
50. Ma, S., Kassinos, S. C., Fatta Kassinos, D. & Akylas, E. Effects of selective water withdrawal schemes on thermal stratification in Kouris Dam in Cyprus. Lakes Reserv. Res. Manag. 13, 51–61 (2008).
51. Karadžić, V., Subakov-Simić, G., Krizmanić, J. & Natić, D. Phytoplankton and eutrophication development in the water supply reservoirs Garaši and Bukulja (Serbia). Desalination 255, 91–96 (2010).
52. Naselli-Flores, L. & Barone, R. Pluriannual morphological variability of phytoplankton in a highly productive Mediterranean reservoir (Lake Arancio, Southwestern Sicily). Hydrobiologia 578, 87–95 (2007).
53. Whitton, B. A. et al. A coded list of freshwater algae of the British Isles. (NERC, LOIS Publication, 1998).
54. Willame, R. et al. Morphological and molecular characterization of planktonic cyanobacteria from Belgium and Luxembourg. J.
Phycol. 42, 1312–1332 (2006).
55. Caraus, I. The algae of Romania. Studii si Cercetari (Universitatea Bacau, 2002).
56. Täuscher, L. Checklisten und Gefährdungsgrade der Algen des Landes Brandenburg I. Einleitender Überblick, Checklisten und Gefährdungsgrade der Cyanobacteria/Cyanophyta, Rhodophyta und Phaeophyceae/Fucophyceae. Verhandlungen des Bot. Vereins
www.nature.com/scientificreports/
57. Gó mez, S. & Quesada de Corral, A. Catálogo de cianobacterias planctónicas potencialmente tóxicas de las aguas continentales
españolas. (Ministerio de Medio Ambiente, y Medio Rural y Marino. Secretaría General Técnica Centro de Publicaciones, 2011).
58. Kastovsky, J., Hauer, T., Komarek, J. & Skacelova, O. The list of cyanobacterial species of the Czech Republic to the end of 2009.
Fottea 10, 245–249 (2010).
59. Komárek, J. Modern taxonomic revision of planktic nostocacean cyanobacteria: a short review of genera. Hydrobiologia 639, 231–243 (2010).
60. Hällfors, G. Checklist of Baltic Sea phytoplankton species (including some heterotrophic protistan groups). in Baltic Sea Environment
Proceedings 95, 1–208 (2004).
61. Vitenaite, T. Lietuvos vandens telkiniu melsvadumbliu (Cyanophyta) savadas [Conspectus of blue-green algae (Cyanophyta) of Lithuanian water basins]. Bot. Lith. 7, 343–364 (2001).
62. Cronberg, G., Annadotter, H. & Lawton, L. A. The occurrence of toxic blue-green algae in Lake Ringsjön, southern Sweden, despite nutrient reduction and fish biomanipulation. Hydrobiologia 404, 123–129 (1999).
63. Zapomělová, E. et al. Polyphasic characterization of Dolichospermum spp. and sphaerospermopsis spp. (Nostocales, Cyanobacteria): morphology, 16S rRNA gene sequences and fatty acid and secondary metabolite profiles1. J. Phycol. 47, 1152–1163 (2011). 64. Cook, C. M., Vardaka, E. & Lanaras, T. Toxic Cyanobacteria in Greek Freshwaters, 1987—2000: Occurrence, Toxicity, and Impacts
in the Mediterranean Region. Acta Hydrochim. Hydrobiol. 32, 107–124 (2004).
65. Patova, E. N. Bloom-Forming Cyanoprokaryotes in Kharbeyskie Lakes of Bolshezemelskaya Tundra. J. Sib. Fed. Univ. 7, 282–290 (2014).
66. Ueno, Y. et al. Detection of microcystins, a blue-green algal hepatotoxin, in drinking water sampled in Haimen and Fusui, endemic areas of primary liver cancer in China, by highly sensitive immunoassay. Carcinogenesis 17, 1317–21 (1996).
67. Mameli, R., Bazzoni, A. M., Casiddu, P. & Sechi, N. Evoluzione dello strato trofico del lago Pattada. Paper presented at 15° Congresso
A.I.O.L., Roma. Genova: A.I.O.L. (2002, July 23–25).
68. Lugliè, A., Mameli, G. & Sechi, N. Indagine limnologica pluriennale (dal 1991 al 1993) sul lago artificiale di Sos Canales (Sardegna Settentrionale). Paper presented at 11° Congresso A.I.O.L., Sorrento. Genova: A.I.O.L. (1996, October 26-26).
69. Salmaso, N. et al. Variability of microcystin cell quota in metapopulations of Planktothrix rubescens: causes and implications for water management. Toxicon 90, 82–96 (2014).
70. Kuiper-Goodman, T., Falconer, I. & Fitzgerald, J. in Toxic Cyanobacteria in Water (eds Chorus, I. & Bartram, J.) 113–153 (World Health Organization - E & FN Spon, 1999).
71. Maatouk, I., Bouaïch, N., Fontan, D. & Levi, Y. Seasonal variation of microcystin concentrations in the Saint-Caprais reservoir (France) and their removal in a small full-scale treatment plant. Water Res. 36, 2891–7 (2002).
72. Abdel-Rahman, S., el-Ayouty, Y. M. & Kamael, H. A. Characterization of heptapeptide toxins extracted from Microcystis aeruginosa (Egyptian isolate). Comparison with some synthesized analogs. Int. J. Pept. Protein Res. 41, 1–7 (1993).
73. Oudra, B. et al. Isolation, characterization and quantification of microcystins (heptapeptides hepatotoxins) in Microcystis aeruginosa dominated bloom of Lalla Takerkoust lake-reservoir (Morocco). Toxicon 39, 1375–81 (2001).
74. Gkelis, S. & Zaoutsos, N. Cyanotoxin occurrence and potentially toxin producing cyanobacteria in freshwaters of Greece: A multi-disciplinary approach. Toxicon 78, 1–9 (2014).
75. Sivonen, K. & Jones, G. in Toxic Cyanobacteria in Water. A guide for their public health consequences, monitoring and management (eds. Chorus, I. & Bartram, J.) 41–111 (CRC Press, 1999).
76. Mankiewicz-Boczek, J. et al. Preliminary molecular identification of cylindrospermopsin-producing Cyanobacteria in two Polish lakes (Central Europe). FEMS Microbiol. Lett. 326, 173–9 (2012).
77. Preußel, K., Stüken, A., Wiedner, C., Chorus, I. & Fastner, J. First report on cylindrospermopsin producing Aphanizomenon flos-aquae (Cyanobacteria) isolated from two German lakes. Toxicon 47, 156–162 (2006).
78. Mooney, K. M., Hamilton, J. T. G., Floyd, S. D., Foy, R. H. & Elliott, C. T. Initial studies on the occurrence of cyanobacteria and microcystins in Irish lakes. Environ. Toxicol. 26, 566–70 (2011).
79. Rolland, A., Bird, D. F. & Giani, A. Seasonal changes in composition of the cyanobacterial community and the occurrence of hepatotoxic blooms in the eastern townships, Quebec, Canada. J. Plankton Res. 27, 683–694 (2005).
80. Rinta-Kanto, J. M. & Wilhelm, S. W. Diversity of microcystin-producing cyanobacteria in spatially isolated regions of Lake Erie.
Appl. Environ. Microbiol. 72, 5083–5 (2006).
81. Van Apeldoorn, M. E., van Egmond, H. P., Speijers, G. J. A. & Bakker, G. J. I. Toxins of cyanobacteria. Mol. Nutr. Food Res. 51, 7–60 (2007).
82. Komárek, J., Azevedo, S., Domingos, P., Komárková, J. & Tichý, M. Backgroung of the Caruaru tragedy; a case taxonomic study of toxic cyanobacteria. Algol. Stud. für Hydrobiol. Suppl. Vol. 9–29 (2001).
83. D’Alelio, D. & Salmaso, N. Occurrence of an uncommon Planktothrix (Cyanoprokaryota, Oscillatoriales) in a deep lake south of the Alps. Phycologia 50, 379–383 (2011).
84. Naselli-Flores, L., Barone, R., Chorus, I. & Kurmayer, R. Toxic cyanobacterial blooms in reservoirs under a semiarid mediterranean climate: the magnification of a problem. Environ. Toxicol. 22, 399–404 (2007).
85. Assennato, G. et al. Cyanobacteria bloom in the Occhito artificial lake (Southern Italy): relationship between Planktothrix Rubescens density and microcystin concentration. Fresenius Environ. Bull. 19, 1795–1801 (2010).
86. Pulina, S., Padedda, B. M., Sechi, N. & Lugliè, A. The Dominance of cyanobacteria in Mediterranean hypereutrophic lagoons: a case study of Cabras Lagoon (Sardinia, Italy). Scientia Marina, 75, 111–120 (2011).
87. Salmaso, N. et al. Phytoplankton as an Indicator of the Water Quality of the Deep Lakes South of the Alps. Hydrobiologia 563, 167–187 (2006).
88. Salmaso, N. Ecological patterns of phytoplankton assemblages in Lake Garda: seasonal, spatial and historical features. J. Limnol. 61, 95 (2002).
89. Ruggiu, D., Morabito, G., Panzani, P. & Pugnetti, A. Trends and relations among basic phytoplankton characteristics in the course of the long-term oligotrophication of Lake Maggiore (Italy). Hydrobiologia 369–370, 243–257 (1998).
90. Ernst, B., Hoeger, S. J., O’Brien, E. & Dietrich, D. R. Oral toxicity of the microcystin-containing cyanobacterium Planktothrix rubescens in European whitefish (Coregonus lavaretus). Aquat. Toxicol. 79, 31–40 (2006).
91. Dietrich, D. R., Fischer, A., Michel, C. & Hoeger, S. J. Toxin mixture in cyanobacterial blooms–a critical comparison of reality with current procedures employed in human health risk assessment. Adv. Exp. Med. Biol. 619, 885–912 (2008).
92. Ernst, B., Hoeger, S. J., O’Brien, E. & Dietrich, D. R. Abundance and toxicity of Planktothrix rubescens in the pre-alpine Lake Ammersee, Germany. Harmful Algae 8, 329–342 (2009).
93. D’Alelio, D. et al. Planktothrix populations in subalpine lakes: selection for strains with strong gas vesicles as a function of lake depth, morphometry and circulation. Freshw. Biol. 56, 1481–1493 (2011).
94. Bonilla, S. et al. What drives the distribution of the bloom-forming cyanobacteria Planktothrix agardhii and Cylindrospermopsis raciborskii? FEMS Microbiol. Ecol. 79, 594–607 (2012).
95. Kurmayer, R., Christiansen, G., Gumpenberger, M. & Fastner, J. Genetic identification of microcystin ecotypes in toxic cyanobacteria of the genus Planktothrix. Microbiology 151, 1525–33 (2005).
96. Kurmayer, R., Christiansen, G., Fastner, J. & Borner, T. Abundance of active and inactive microcystin genotypes in populations of the toxic cyanobacterium Planktothrix spp. Environ. Microbiol. 6, 831–841 (2004).