MAX WEBER PROGRAMME
EUI Working Papers
MWP 2009/16 MAX WEBER PROGRAMMERasmus Hoffmann ARE SOCIOECONOMIC DIFFERENCES IN MORTALITY GREATER IN A MORE EQUAL SOCIETY?
EUROPEAN UNIVERSITY INSTITUTE
,
FLORENCEM
AXW
EBERP
ROGRAMMEAre Socioeconomic Differences in Mortality Greater in a more Equal Society?
RASMUS
HOFFMANN
This text may be downloaded for personal research purposes only. Any additional reproduction for other purposes, whether in hard copy or electronically, requires the consent of the author(s), editor(s).
If cited or quoted, reference should be made to the full name of the author(s), editor(s), the title, the working paper or other series, the year, and the publisher.
The author(s)/editor(s) should inform the Max Weber Programme of the EUI if the paper is to be published elsewhere, and should also assume responsibility for any consequent obligation(s).
ISSN 1830-7728
© 2009 Rasmus Hoffmann Printed in Italy European University Institute
Badia Fiesolana
I – 50014 San Domenico di Fiesole (FI) Italy
www.eui.eu cadmus.eui.eu
Abstract
The magnitude of socioeconomic mortality differences changes between countries. This could be attributed to the level of social inequality and explicit policy interventions to address social inequality in health. However, the empirical evidence does not show a clear international relationship between such country features and health inequality. Denmark and the USA are analyzed in terms of socioeconomic differences in mortality for men above age 58. The data sources are Danish register data from 1980 and 2002 (n=938.427), and survey data from the Health and Retirement Study (HRS) from 1992 to 2006 (n=9374). Event history analysis is used to study the impact of SES on mortality (for Denmark by cause of death), and compare the magnitude of mortality differences between the two countries. Income is the most important predictor for mortality. Surprisingly, mortality differentials are larger in Denmark than in the USA, with the richest 75 percent of Danish men having only 30 percent of the mortality risk of the poorest 10 percent. In the USA this RR is only 0.60. These wide mortality differences in Denmark exist for all major ICD groups. Low income seems to be a fundamental and powerful risk factor for mortality from all major causes. This study adds valid empirical evidence to previous findings that more equal societies and welfare regimes do not perform better in terms of health inequalities. In addition, it offers tentative explanations for the puzzle that SES mortality differences are larger in Denmark than in the USA.
Keywords
mortality, health, old age, income, education, socioeconomic status, SES, relative deprivation, Denmark, USA, welfare states, register data, Health and Retirement Study (HRS), longitudinal analysis, event history analysis, cause of death
1
I. Introduction
Differences in health and mortality between socioeconomic groups are a well established research finding. A large body of literature analyzes the role of factors involved and causal pathways from socioeconomic status (SES) to health and mortality (Townsend and Davidson 1992; Thorslund and Lundberg 1994; Mackenbach and Kunst 1997; Hoffmann 2005, 2008). Open questions remain regarding the relative contribution of different dimensions of SES, e.g. income versus education, or the importance of these structural factors compared to behavioral factors, e.g. smoking or obesity (Doblhammer et al. 2009). Some studies use cause specific mortality data to specify different causal pathways by cause of death (Davey Smith et al. 2001). Another promising attempt for an explanation of SES mortality differences are international comparisons that, despite problems of data comparability, reveal international differences in the magnitude of SES health and mortality differences and the factors involved (Mackenbach et al. 1999; Huisman et al. 2004). However, most studies do not show a clear connection between country features and mortality differentials (Valkonen 2001:8826). In particular, the magnitude of social inequality in a country, e.g. income inequality, does not always correspond to the size of health or mortality differences, which we would expect as health is clearly related to SES on the individual level. A striking example is the USA that showed the same level of differences in mortality as Scandinavia in the 1980s, despite a much higher social inequality (Kunst 1997). Knesebeck et al. (2003) find lower SES health differences in the USA than in Germany and Cavelaars et al. (1998) report higher SES health differences in Denmark than in many other European countries. However, Silventoinen and Lahelma (2002) show that Denmark has lower health inequalities than all other Scandinavian countries. A recent branch of research tries to look more systematically at categories of welfare states and their performance in terms of health disparities (Eikemo et al. 2008; Dahl et al. 2006). The evidence is mixed and there is no clear indication that countries of the Scandinavian welfare model have lower health inequalities than the Anglo-Saxon model (Mackenbach et al. 2008). Further empirical evidence from international comparisons is needed to follow up on this important discussion on welfare state differences regarding health inequality that may then lead to first explanations.
For this study Denmark and the USA have been chosen because they represent two very different types of welfare state regimes. Data from the Health and Retirement Study (HRS) and Danish register data is used to analyze SES differentials in old age mortality. The welfare and health of the elderly depend to a large extend on the welfare state and although relative differences in old age mortality might be smaller than for younger people, absolute mortality differences are much larger, implying a high number of additional and possibly avoidable deaths in lower SES groups. The empirical analysis is structured as follows: I first describe the relative importance of several social factors in each country and, second, compare the magnitude of SES mortality differences between Denmark and the USA. Additionally, the Danish data permit an analysis by cause of death and the HRS data allows studying the contribution of health behavior to SES mortality differences. Denmark and the USA have very different positions in the spectrum of rich welfare states. In the following background information is provided on general features relevant for SES mortality differences (welfare and social inequality), followed by an overview of mortality in both countries. However, this study will not empirically test the link between welfare state features and social mortality differences, i.e. the analysis will only link individual characteristics and mortality.
Welfare, social inequality and mortality in Denmark and the USA
Denmark and the USA both have a GDP that is among the highest in the world and that has increased linearly at least since 1975, with the USA having a slightly steeper increase. The USA spends more of its GDP on health: in 2001 it was 13.9 percent compared to Denmark’s 8.4 percent. The share of private spending in the USA is higher than in Denmark and higher than in the public arena. Denmark has a fairly stable health care expenditure that was about $ 2500 per capita a year in 2001 while in the
Rasmus Hoffmann
2
USA health expenditures are increasing and were $ 4887 in 2001 (World Bank 2004). Nevertheless, the quality of services in the USA is worse (Williams 2001:81; Kaplan 2001:145).
Medicare, implemented in 1965, is the largest public health care program in the USA and is devoted to all persons at age 65+. It covers hospital and related services (Klein and Unger 2001) and tends to address acute illness rather than prevention (Adams and McFadden 2002). It pays for the necessary health care but on average Medicare patients get less qualified doctors and less satisfactory treatments than others (Moon 1995; Knesebeck et al. 2003). Including Medicare the insurance coverage for people above age 65 is about 99 per cent which is about the percentage of coverage in Denmark.
Denmark belongs to the Nordic welfare model that aims at comprehensiveness, equality, universality and generosity in its services (Kvist 1999:232). Since 1973 health care is provided by a national but decentralized health system that is mostly tax financed. Health insurance is public and mandatory. About one fifth of the population has additional private health insurance. Differences in the quality of health care for different social or income groups are small but there are long waiting lists for certain services, e.g. cataract and hip surgery or cardiac procedures (Manton and Vaupel 1995:1233). Universal old-age pensions together with relatively generous benefits is a characteristic of the Nordic welfare-state model. It means that normally the elderly have access to social care regardless of an individual’s previous work and contribution record (Kvist 1999:246). For a detailed discussion of features of the Danish welfare state including international comparisons, see Andersen 1997, Hansen 2002 and Hussain 2002.
The USA is very unequal as a whole, in fact the most unequal country in the industrialized world (Wolff 1995:19) at least in terms of the distribution of material wealth. Moreover, a clear trend of widening social inequality can be diagnosed since the 1980s (O’Rand et al. 1999:1). The elderly are absolutely better off than the middle-aged, especially in the lowest income groups. But they are also more unequal because for the elderly unequal income sources (pension, savings) are more important than sources with a redistributive effect (Social Security, Medicare) (O’Rand et al. 1999:69; Crystal 1996:396). The USA and Denmark are at opposite poles in income inequality: The USA has a Gini-Index for income of 40.8 (2000) and in Denmark it is 24.7 (1997) (World Bank 2004). The same is true for poverty: “The USA and Denmark can be seen as the two extreme cases regarding government intervention to reduce poverty” (Hussain 2002:2).
Life expectancy at birth in Denmark and in the USA has been very similar since 1980. In 2000 it was 77.1 (USA) and 76.9 (DK) (Human Mortality Database). Remaining life expectancy at age 60 differs slightly, 21.8 (USA) and 20.7 (DK), because the elderly in the USA are an advantaged group regarding mortality compared to the middle-aged (Vaupel 1998). Mortality differentials between occupational groups in Denmark have been presented in several publications (e.g. Bronnum-Hansen et al. 2004; Andersen et al. 2005). However, studies on the impact of other SES dimensions on old age mortality in Denmark are scarce (e.g. Huisman et al. 2004; Hoffmann 2008). For the USA, numerous studies have shown the SES health gradient (e.g. Elo and Preston 1996; Lynch 2003). Regarding the trend, SES mortality differences increase in the USA (Marmot 1999) and Valkonen (2001) concludes that relative differences in mortality increased during the 1980s in all countries where data are available. International comparisons of the magnitude of health disparities are still limited by measurement and standardization problems and by differences in the national setup of population and health statistics (Knesebeck et al. 2006). The EU Working Group on Socioeconomic Inequalities in Health has done pioneering work in this field (e.g. Mackenbach et al. 2008).
II. Methods Data sources
The data for the USA come from the Health and Retirement Study (HRS) and a sub-study, the study of Assets and Health Dynamics Among the Oldest Old (AHEAD). These were started in 1992 and 1993 respectively and then combined in 1998, with a follow-up every second year (Soldo et al. 1997). My sample consists of 9374 persons born before 1934, aged 59 to 108, and surveyed from 1992 to 2006,
Are Socioeconomic Differences in Mortality Greater in a more Equal Society?
3
with 4744 deaths during observation. Institutionalized persons were excluded in the original HRS baseline sample but surveyed in the institution during the follow-up interviews. This may cause a bias and an underestimation of socioeconomic health differences (Arber and Ginn 1993:35; Huisman et al. 2003). However, the fact that HRS respondents are followed in institutions corrects this bias after some waves (Hurd et al. 2001:6; Adams et al. 2002:18) (results of my comparison with the National Nursing Home Survey not shown).
The Danish data is register data from the Danish Demographic Database that was implemented in 2000 and that is maintained by Statistics Denmark and the Danish Center for Demographic Research (Petersen 2000). It combines data from different registers from 1980 onwards. Registers can be linked by an individual person identification number, they cover the entire Danish population and provide annual information. The dataset used here includes 1.090.897 women and 938.427 men, thus a total of 2.029.324 persons aged 59 years or older, who are observed from 1980 to 2002.
Variables
The variables chosen from the Danish Demographic Database are similar to the variables in the HRS dataset. Only substantial differences in what is measured are described below. Mere differences in the number of categories can be seen in Table 1 and Table 2. For the HRS data normal imputation procedure has been applied. Given the large number of cases I only made few imputations in the Danish data. Instead the category “not known” is used for missing values.
Education is measured in years of education. Wealth is measured in quartiles and includes all
assets of the household in which the person lives (bank account, real estate, shareholdings etc.) Income is the individual gross annual income for Denmark and for the USA it is the net annual household income divided by a weighted number of persons living in the household (net equivalent income), both measured in percentiles. Children means own children in the USA but in Denmark it means children living in the household. For the USA there is information on the Labor force status, whereas for Denmark the Source of main income has a similar meaning. Marital status is measured in the standard four categories. The only available health measure in the Danish data is Days in hospital for each year. The following health measures are only available in the HRS data: Health behavior is an additive index focusing on three items that have shown to be important correlates of health: physical activity, being an ex-smoker and being a current smoker. The question on self-rated health is posed with the five traditional categories, but “excellent” and “very good” have been merged. Objective health is another additive index that includes four items: 1. being in hospital for more than 10 days per year, 2. limitations in the activities of daily living (ADL), 3. a body mass index (BMI) at baseline < 21.4 for men and < 19.5 for women (=lowest decile), 4. loss of weight of more than 10 per cent of the body weight between two waves (= two years). Two more variables for Denmark are available: Type of
dwelling and Square meters per person. For both countries, Age is controlled for by using a
Gompertz-shaped baseline risk function and Gender is controlled for by running separate models for each sex. I also checked and found that in none of the countries period or cohort effects create a bias.
Data analysis
Event history analysis is applied with a model for the force of mortality as the outcome variable. The force of mortality is a hazard rate and can be understood as an instantaneous death rate at age x (Horiuchi and Wilmoth 1998:394). The models computed with Stata SE 10.1 identify rate ratios for the multiplicative impact of categorical variables on the baseline risk of dying. The baseline for age covers the age range from 59 to the highest age, whereas the observation period is only 14 years for the USA (1992-2006) and 23 years (1980-2002) for Denmark. Thus, these are partly synthetic cohorts and cases entering above age 59 are left-truncated. Stata can take this into account by distinguishing between “time under risk” (starting at age 59) and “time under observation” (starting at the individual age of entry) (Gutierrez 2002:42).
Rasmus Hoffmann
4
III. Results
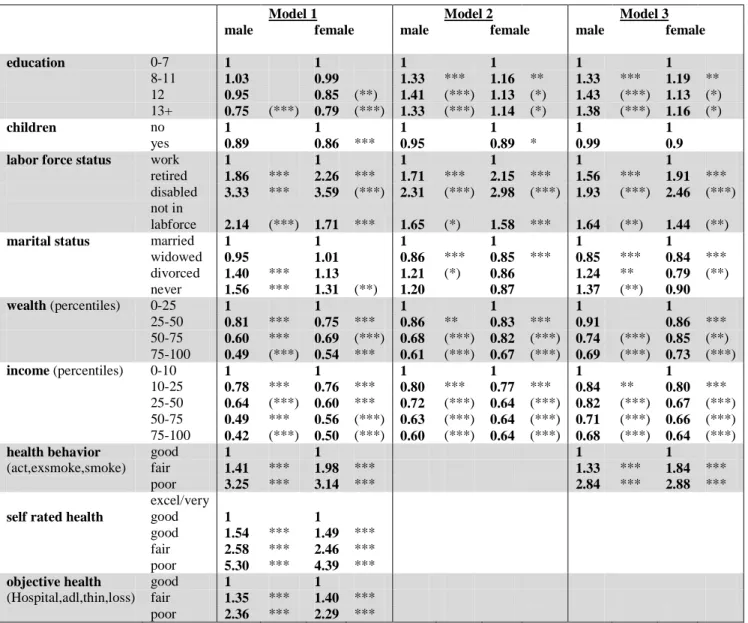
The impact of socioeconomic factors on old age mortality
Table 1: Event history models of socioeconomic predictors for mortality, USA
Model 1 Model 2 Model 3
male female male female male female
education 0-7 1 1 1 1 1 1 8-11 1.03 0.99 1.33 *** 1.16 ** 1.33 *** 1.19 ** 12 0.95 0.85 (**) 1.41 (***) 1.13 (*) 1.43 (***) 1.13 (*) 13+ 0.75 (***) 0.79 (***) 1.33 (***) 1.14 (*) 1.38 (***) 1.16 (*) children no 1 1 1 1 1 1 yes 0.89 0.86 *** 0.95 0.89 * 0.99 0.9
labor force status work 1 1 1 1 1 1
retired 1.86 *** 2.26 *** 1.71 *** 2.15 *** 1.56 *** 1.91 *** disabled 3.33 *** 3.59 (***) 2.31 (***) 2.98 (***) 1.93 (***) 2.46 (***) not in
labforce 2.14 (***) 1.71 *** 1.65 (*) 1.58 *** 1.64 (**) 1.44 (**)
marital status married 1 1 1 1 1 1
widowed 0.95 1.01 0.86 *** 0.85 *** 0.85 *** 0.84 *** divorced 1.40 *** 1.13 1.21 (*) 0.86 1.24 ** 0.79 (**) never 1.56 *** 1.31 (**) 1.20 0.87 1.37 (**) 0.90 wealth (percentiles) 0-25 1 1 1 1 1 1 25-50 0.81 *** 0.75 *** 0.86 ** 0.83 *** 0.91 0.86 *** 50-75 0.60 *** 0.69 (***) 0.68 (***) 0.82 (***) 0.74 (***) 0.85 (**) 75-100 0.49 (***) 0.54 *** 0.61 (***) 0.67 (***) 0.69 (***) 0.73 (***) income (percentiles) 0-10 1 1 1 1 1 1 10-25 0.78 *** 0.76 *** 0.80 *** 0.77 *** 0.84 ** 0.80 *** 25-50 0.64 (***) 0.60 *** 0.72 (***) 0.64 (***) 0.82 (***) 0.67 (***) 50-75 0.49 *** 0.56 (***) 0.63 (***) 0.64 (***) 0.71 (***) 0.66 (***) 75-100 0.42 (***) 0.50 (***) 0.60 (***) 0.64 (***) 0.68 (***) 0.64 (***)
health behavior good 1 1 1 1
(act,exsmoke,smoke) fair 1.41 *** 1.98 *** 1.33 *** 1.84 ***
poor 3.25 *** 3.14 *** 2.84 *** 2.88 ***
self rated health
excel/very
good 1 1
good 1.54 *** 1.49 ***
fair 2.58 *** 2.46 ***
poor 5.30 *** 4.39 ***
objective health good 1 1
(Hospital,adl,thin,loss) fair 1.35 *** 1.40 ***
poor 2.36 *** 2.29 ***
* : p<0.1; ** : p<0.05; *** : p<0.01
Asterisks in brackets mean that rate ratios are significantly different from 1 but not from the previous category.
Model 1 contains univariate results,
Model 2 is multivariate including indicators for SES, Model 3 adds health behavior to Model 2.
Are Socioeconomic Differences in Mortality Greater in a more Equal Society?
5
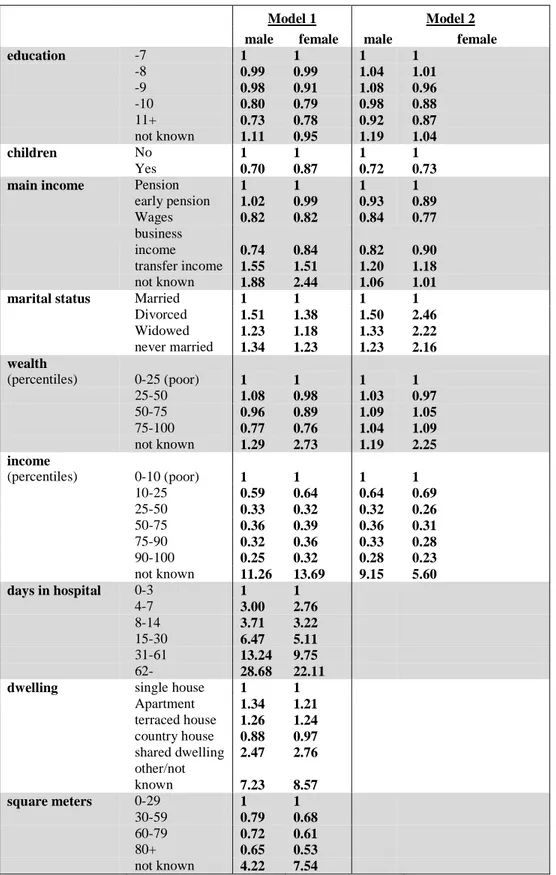
Table 2: Event history models of socioeconomic predictors for mortality, Denmark
Model 1 Model 2
male female male female
education -7 1 1 1 1 -8 0.99 0.99 1.04 1.01 -9 0.98 0.91 1.08 0.96 -10 0.80 0.79 0.98 0.88 11+ 0.73 0.78 0.92 0.87 not known 1.11 0.95 1.19 1.04 children No 1 1 1 1 Yes 0.70 0.87 0.72 0.73
main income Pension 1 1 1 1
early pension 1.02 0.99 0.93 0.89 Wages 0.82 0.82 0.84 0.77 business income 0.74 0.84 0.82 0.90 transfer income 1.55 1.51 1.20 1.18 not known 1.88 2.44 1.06 1.01
marital status Married 1 1 1 1
Divorced 1.51 1.38 1.50 2.46 Widowed 1.23 1.18 1.33 2.22 never married 1.34 1.23 1.23 2.16 wealth (percentiles) 0-25 (poor) 1 1 1 1 25-50 1.08 0.98 1.03 0.97 50-75 0.96 0.89 1.09 1.05 75-100 0.77 0.76 1.04 1.09 not known 1.29 2.73 1.19 2.25 income (percentiles) 0-10 (poor) 1 1 1 1 10-25 0.59 0.64 0.64 0.69 25-50 0.33 0.32 0.32 0.26 50-75 0.36 0.39 0.36 0.31 75-90 0.32 0.36 0.33 0.28 90-100 0.25 0.32 0.28 0.23 not known 11.26 13.69 9.15 5.60 days in hospital 0-3 1 1 4-7 3.00 2.76 8-14 3.71 3.22 15-30 6.47 5.11 31-61 13.24 9.75 62- 28.68 22.11
dwelling single house 1 1
Apartment 1.34 1.21 terraced house 1.26 1.24 country house 0.88 0.97 shared dwelling 2.47 2.76 other/not known 7.23 8.57 square meters 0-29 1 1 30-59 0.79 0.68 60-79 0.72 0.61 80+ 0.65 0.53 not known 4.22 7.54
Rasmus Hoffmann
6
Table 1 shows the relative risks of dying separately for men and women in the USA. Model 1 contains only the univariate results of each variable separately. All variables show the expected association with mortality and all of them are significant, except having children for men. Surprisingly, education only has a significant impact on mortality in higher categories. Widowed people do not have higher mortality than the married. In Model 2, all variables that directly or indirectly describe socioeconomic status are included simultaneously which decreases most of the rate ratios. Widowed people show lower mortality than married people and the mortality disadvantage of divorced and never married women turns into a non-significant advantage which appears after the inclusion of financial variables and the labor force status (single steps of the modeling procedure not shown). In Model 2 higher education is associated with higher mortality. This surprising finding has also been observed elsewhere (e.g. Liang et al. 2002:305) and has been interpreted as an educational mortality crossover due to selective mortality. Hurd et al. (2001:8) find higher mortality for middle educated groups in the AHEAD sample (which is part of our data) and also explain it with mortality selection. The mortality crossover already appears after controlling for income only. Thus an alternative explanation to mortality selection is that holding income constant in the model, higher education means that the aforementioned education is not translated into higher income and that these persons suffer from status inconsistency. This interpretation is supported by the finding that the excess mortality for higher educated men concentrates on lower income and poorer health groups (results not shown). Overall, Model 2 shows that income absorbs the small positive effect of education.
Model 3 adds only health behavior to the socioeconomic variables and shows that the measured items of health behavior (physical activity, being an ex-smoker and being a smoker) changes the rate ratios slightly in the expected direction: a certain amount of the impact of the economic status goes via health behavior. This effect is larger for men than for women.
In the modeling of socioeconomic status it is likely that the variables are not independent from each other. The highest correlation exists between wealth and income (r=0.65) and between wealth and education (r=0.44). The inclusion of multiple interrelated dimensions of SES is justified as long as these variables reveal meaningful and different results in each step of the modeling procedure and the results are interpreted with caution.
Table 2 presents the relative risks of dying in Denmark using the same logic. Model 3 is omitted because there is no information on health behavior for Denmark. The level of significance is not shown for the Danish results because with about 1 million cases for each sex virtually all differences are statistically significant. Moreover there is no fundamental meaning of significance because the whole population is observed and no inductive statistics are applicable here.
In the univariate Model 1 we also see only expected results and clear mortality differences that are especially large between income groups. Model 2 includes all SES variables that are also available for the USA in order to provide results that are as comparable as possible. Obviously, controlling for other SES variables reduces the impact of education and wealth substantially, but does not do so for income. Living from early pension becomes beneficial and the negative impact of living from transfer income is much smaller after controlling for the amount. Surprisingly, in Model 2 the disadvantage of single women increases enormously. This change occurs after controlling for income, which means that a real mortality disadvantage was hidden before the inclusion of income in the model. At least a possible and logical conclusion would be that in Denmark the single status is associated with higher individual income. However, this study cannot explain why in Denmark the single status is worse for women and in the USA it is worse for men. Klein and Unger (2001) found that in the USA it is only bad for men and that it might not be bad for women. This has also been found and explained before, namely with the assumption that women engage less in unhealthy behavior in such situations (Grundy and Slogett 2003:940; Johnson et al. 2000) and are more likely to substitute their singlehood with social networks (Goldman et al. 1995; Brockmann and Klein 2004:579). In Denmark the advantage of high wealth (only the highest category has lower mortality) is neutralized after income is included in the model. The hazard ratios for income are robust against the inclusion of control variables. If the kind and the size of dwelling are added to Model 2 (results not shown), we see remaining mortality differences between different kinds of dwelling but the mortality differences between different sizes of
Are Socioeconomic Differences in Mortality Greater in a more Equal Society?
7
dwelling are “controlled away” by income. This shows that, unlike the kind of dwelling, the size of dwelling is only an indicator of SES and does not affect mortality on its own.
Socioeconomic mortality differences by cause of death
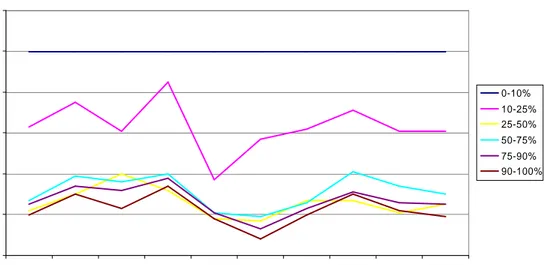
The following presentation of a cause specific analysis of socioeconomic differences in mortality will be only about Denmark because information about causes of death, albeit principally available in the HRS, is not accessible to researchers outside the USA. Data come from the Danish registers of causes of death (Juel and Helweg-Larsen 1999:354). Deaths before 1994 were classified according to ICD-8 and afterwards they switched directly to ICD-10. I use a translation key proposed by Janssen and Kunst (2004) that connects ICD-8, ICD-9 and ICD-10. The following figures are based on several event history models that only count deaths of one specific cause as an event. When a person dies of a different cause of death the case is censored. Besides this the models parallel Model 2 and the lines represent the same income levels, the poorest 10 per cent being the reference category that is always 1. The causes of death on the x-axis are ordered from the most to the least frequent cause of death, except for other/not known.
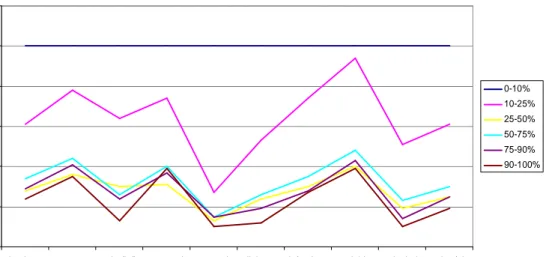
Figure 1 and Figure 2 show some differences in the steepness of the income mortality gradient between causes of death, e.g. mental disorders and diabetes seem to depend more on income than cancer or suicide. But overall a similar large mortality gradient is found for all causes of death.
Figure 1: Income mortality gradient for different causes of death, Danish men
0 0.2 0.4 0.6 0.8 1 1.2
circulatory cancer pulm/infl. external mental diabetes infections suicide alcohol other/nk
cause of de ath re la ti v e m o rt a li ty 0-10% 10-25% 25-50% 50-75% 75-90% 90-100%
Rasmus Hoffmann
8
Figure 2: Income mortality gradient for different causes of death, Danish women
0 0.2 0.4 0.6 0.8 1 1.2
circulatory cancer pulm/infl. external mental diabetes infections suicide alcohol other/nk
cause of dea th re la ti v e m o rt a li ty 0-10% 10-25% 25-50% 50-75% 75-90% 90-100% IV. Discussion
This study analyzed the impact of various socioeconomic factors on mortality above age 59 in Denmark and the USA. For Denmark it offers the most comprehensive analysis of this issue in the literature, both in terms of data quantity and quality. First, in an analytical step that could only be applied with the HRS data, I have shown that SES mortality differences can only to a limited extent be explained by health behavior. Second, in a multivariate model income is by far the most important predictor for mortality, and in the USA also wealth. In particular the small educational mortality differences are reduced substantially after controlling for financial variables. Third, the Danish data allowed for showing that the large mortality differences between income groups exist for all major ICD groups. Fourth, mortality differentials are large in the USA but even larger in Denmark.
1. In many studies the impact of SES does not change much when health behavior is controlled, which lets researchers conclude that SES health differences to a large extent cannot be explained by health behavior. Stronks (1997:163) quantifies its contribution to health differences to 30 to 40 percent. According to Deaton and Paxson (2001:132) it is 25 percent of the impact of income on mortality. For men my results confirm this order of magnitude, whereas for women it is much less. Naturally, this comparison is limited by differences in the choice of health behavior variables between the studies.
2. The decline in the effect of education on mortality between Model 1 and Model 2 in both countries is due to the fact that higher educated persons have better jobs and a higher income. When the latter is controlled, education has much less of an own impact on mortality. Some impact remains, possibly because people of higher education have healthier jobs and more knowledge conducive to better health. Education is a necessary but not sufficient condition for low mortality.
This is different from results by Smith (2003 and 2004) and other economists. Smith finds that financial variables only have a small impact on the onset of diseases, whereas education is important for new health events. I see three possible explanations for these different findings: first, the differences between pre-retirement ages, analyzed by Smith (2003:22) and mostly those of retirement age, analyzed here. Second, since our multivariate analysis concentrated on mortality one reason might
Are Socioeconomic Differences in Mortality Greater in a more Equal Society?
9
be that the predictors of health and the predictors of mortality differ. Third, there may be differences between the predictors of the onset of diseases and the predictors of the overall health status. When initial health status is controlled for, Smith only considers subsequent health changes and their predictors and ignores the fact that the baseline health status is already, among other things, the result of socioeconomic status (Martelin 1996:127; Hoover 2003:123).
There are different findings supporting my results: Davey Smith et al. (1998) find that educational mortality differences disappear after controlling for occupational social class and Menchik (1993) shows with data for older men from the USA that controlling for income greatly diminishes the effect of education. House and Zimmer (2003) also find with USA data that income is much more important than education, however education has some impact on the onset of diseases. Goldman et al. (1995:1721) summarize such findings when they write: “an interesting and consistent finding from several U.S. studies is that educational attainment appears to have a greater effect on health at younger ages than older ages and is often not a significant predictor for old-age mortality (e.g. Kitagawa and Hauser [1973], Menchik [1993] […])” Besides special benefits and payments for health problems and health prevention, the income in old age is very important for a person’s overall level of health care. Moreover there are many other material aspects than health care contributing to a good health.
3. The conclusion from the analysis by cause of death is that the disadvantage of being in a lower social status group, which is represented here by the income level, is a very fundamental disadvantage that can not only be attributed to certain causal pathways, certain risk factors or certain causes of death. Poor people are much more likely to die of any cause. This finding does not prove that income is a fundamental cause (Link and Phelan 1995) or a distal cause (House et al. 1994) in the causality chain between SES and mortality; the order of causality cannot be determined in my model, not to mention factors that are not included. But income seems to be, firstly, an omnipotent resource that helps people to postpone death from almost all causes, while poor people cannot cope with any of them. Secondly, it is a very valid indicator for SES, which is important in a situation where we almost always use indicators for SES instead of knowing exactly what SES basically is (Goldman 2001b), or what the fundamental cause for the SES health gradient is (Link and Phelan 1995). Thirdly, this finding supports the use of income as the dimension used to compare Denmark and the USA in this analysis; not because it is perfect, but because it proves to be the best available in both datasets.
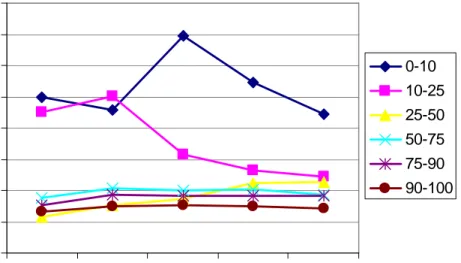
4. A closer look at the results show that in Denmark the poorest 25 percent of the population have a mortality disadvantage, while in the USA this affects the poorer 50 percent of the population. For Denmark Figure 3 displays the time trend of this share by showing the development of mortality differences between income groups relative to the poorest group at the beginning of the observation.
Rasmus Hoffmann
10
Figure 3: Mortality with interaction between income and period, Danish men (lowest income decile/earliest period=reference group=1)
0 0.2 0.4 0.6 0.8 1 1.2 1.4 1.6 80-84 85-89 90-94 95-99 00-02 year re la ti v m o rt a li ty 0-10 10-25 25-50 50-75 75-90 90-100
In the 1980s Denmark showed a clear mortality gap between the poorest 25 percent of elderly men and the rest. In the beginning of the 1990s, where Denmark had an economic crisis, the two poorest groups diverged, the poorest ten percent experiencing increasing mortality(!) Finally, a new composition emerged where only 10 percent are heavily disadvantaged. Besides these insights, the most remarkable finding is that mortality differences in Denmark are larger than in the USA. This is even more astounding if we take into account that income inequality is much smaller in Denmark. As mentioned in the introduction, previous studies show mixed evidence for the comparison of Denmark (or other Scandinavian countries) with the USA (or other Anglo-Saxon countries). It is important to note that most of these studies use younger samples than I used here. In the following, different possible explanations are discussed that could explain my results. Logically, they can either support low mortality differences in the USA or high differences in Denmark, because given the scarcity of valid international comparisons we do not know which of the two countries is exceptional.
a) In principle a program like Medicare can reduce SES mortality differences substantially by providing health care services to the elderly in need. However, given the low level and quality of health care for Medicare patients, it is unlikely that they are treated more comprehensively or better than poor people in Denmark where they also have universal health care services. In fact, research results show that Medicare did not have a large impact on the overall health status or on health or mortality differences between social groups (Auerbach and Krimgold 2001:151). After the Medicare program was implemented mortality differences even increased (Preston and Elo 1995:491). People over age 65 spend 23 percent of their income for out-of-pocket health care costs, which is more than before the start of the Medicare (Crystal 1996:404, 392ff).
b) Old age mortality is partly determined by the living standard and other factors earlier in life (Doblhammer 2004). At the beginning of the 20th century, when most people in this study were born, Denmark had a lower living-standard, lower child health and a lower educational level. This may affect the overall health status in Denmark. But another life course effect, suggested by Kaareholt (2000), may be more important here: statistically insignificant results suggest that those with a wealthy childhood exhibit a smaller socioeconomic mortality gradient at older ages because they possibly have acquired a robustness that limits the subsequent susceptibility against health threats.
Are Socioeconomic Differences in Mortality Greater in a more Equal Society?
11
c) Another related argument is mortality selection in earlier ages. Life expectancy in Denmark and the USA only converged around 1980. Before, when people in the HRS sample were in their middle-age, mortality was higher in the USA. Even today, mortality in middle-age in the USA is relatively high while it is relatively low in old age (Vaupel 1998). Higher mortality selection in middle age may have made the elderly in the USA more selected and thus more homogeneous.
d) A social explanation is the concept of relative deprivation. This concept was first formulated by Stouffer (1949) and claims that social status also depends on a comparison with others and on individual perceptions and interpretations. The implication is that deprivation is possible on all absolute levels of wealth. But is it also possible on all levels of inequality? If yes, the assumed mechanism might be that poor people’s expectations of social mobility and prosperity are not met and that this disappointment threatens health (Dahl et al. 2008; Eikemo et al. 2008). Since I use mortality as an objective measure of health, all arguments implying that people just have a different perception of their health do not apply here. Moreover, it is noteworthy that the poverty rate in Denmark is lower than in the USA. Consequently, this argument solely focuses on the disappointment of expectations and not on objective living conditions. The question remains whether the frustration in case of non-fulfillment of expectations is actually higher in Denmark (where objective class differences and poverty rates are low) than in the USA, where we can at most speak of a “spirit of classnessness” (Kunst 1997) but where far more people would have reason to be disappointed. If this is the case, such a frustration might then contribute to stress and a higher social gradient in health behavior in Denmark directly responsible for higher SES mortality differences. Mackenbach et al. (2008) underline the relative importance of life style factors in high-income countries and Cavelaars et al. (2000) show for example that SES differences in smoking is higher in Scandinavian countries. If it is true that large differences in proximate causes for mortality, related to stress and emotions, can outbalance equalizing social policy and low inequality in a wide range of material and structural conditions, it means nothing less than a fundamental challenge to our understanding of causal factors for mortality and health inequalities.
In conclusion, the empirical evidence for systematic differences in health inequality between countries is not strong enough to definitely decide on one explanatory model. Moreover it is possible that none of the explanations offered here, but a new and different one, convincingly explains the empirical puzzle. This study contributes to both the empirical basis and to the discussion of the unexpected international differences in health inequality. The validity of empirical findings and the interpretation of these findings can and should be further developed in future research.
Rasmus Hoffmann
Rasmus Hoffmann
12
Bibiography
Adams, Peter, Michael D. Hurd, Daniel McFadden, Angela Merrill, and Tiago Ribeiro. "Healthy, Wealthy, and Wise? Tests for Direct Causal Paths between Health and Socioeconomic Status." Journal of Econometrics 112, no. 1 (2003): 3-56.
Andersen, Jørgen Goul. "The Scandinavian Welfare Model in Crisis? Achievements and Problems of the Danish Welfare State in an Age of Unemployment and Low Growth." Scandinavian Political Studies 20 (1997): 1-31.
Andersen, Otto, Lisbeth Laursen, and Jørn Korsbø Petersen. "Dødelighed Og Erhverv 1996-2000." In Working Paper, edited by Danmarks Statistik, 2005.
Arber, Sara, and Jay Ginn. "Gender and Inequalities in Health in Later Life." Social Science and Medicine 36, no. 1 (1993): 33-46.
Auerbach, James Allen, and Barbara Kivim Krimgold. "A Process for Determining Change." In Income, Socioeconomic Status and Health: Exploring the Relationship, edited by James Allen Auerbach and Barbara Kivimae Krimgold, 150-54. Washington, DC: National Policy Association et al., 2001.
Brockmann, Hilke, and Thomas Klein. "Love and Death in Germany: The Marital Biography and Its Effects on Mortality." Journal of Marriage and Family 66 (2004): 567-81.
Brønnum-Hansen, Henrik, Otto Andersen, Mette Kjøller, and N. K. Rasmussen. "Social Gradient in Life Expectancy and Health Expectancy in Denmark." Sozial- und Präventivmedizin 49, no. 1 (2004): 36-41.
Cave, William, and Per Himmelstrup, eds. The Welfare Society in Transition: Problems and Prospects of the Welfare Model. Copenhagen: Danish Cultural Institute, 1995.
Cavelaars, Adrienne E. J. M., Anton E. Kunst, J. J. M. Geurts, R Crialesi, L. Grötvedt, U. Helmert, and et al. "Differences in Self-Reported Morbidity by Educational Level: A Comparison of 11 Western European Countries." Journal of Epidemiology and Community Health 52 (1998): 219-27.
Cavelaars, A. E. J. M., A. E. Kunst, J. J. M. Geurts, R. Crialesi, L. Grotvedt, U. Helmert, E. Lahelma, O. Lundberg, J. Matheson, A. Mielck, N. K. Rasmussen, E. Regidor, M. do Rosario-Giraldes, T. Spuhler, and J. P. Mackenbach. "Educational Differences in Smoking: International Comparison." British Medical Journal 320, no. 7242 (2000): 1102-07.
Crystal, Stephen. "Economic Status of the Elderly." In Handbook of Aging and the Social Sciences, edited by Robert H. Binstock and Linda K. George, 388-409. San Diego et al.: Academic Press, 1996.
Dahl, E., J. Fritzell, E. Lahelma, P. Martikainen, A. Kunst, and J.P. Mackenbach. "Welfare Regimes and Health Inequalities." In Social Inequalities in Health: New Evidence and Policy Implications, edited by J. Siegrist and M. Marmot. Oxford: Oxford University Press, 2006. Davey Smith, George, David Gunnell, and Yoav Ben-Shlomo. "Life-Course Approaches to
Socio-Economic Differentials in Cause-Specific Mortality." In Poverty, Inequality and Health: An International Perspective, edited by David A. Leon and Gill Walt, 88-123. Oxford: Oxford University Press, 2001.
Deaton, Angus, and Christina Paxson. "Mortality, Education, Income, and Inequality among American Cohorts." In Themes in the Economics of Aging, edited by David A. Wise, 129-70, 2001. Doblhammer, Gabriele. The Late Life Legacy of Very Early Life. Berlin, Heidelberg: Springer, 2004. Doblhammer, G., R. Hoffmann, E. Muth, C. Westphal, and A. Kruse. "A Systematic Literature
Review of Studies Analyzing the Effects of Sex, Age, Education, Marital Status, Obesity, and Smoking on Health Transitions." Demographic Research 20 (2009): 37-64.
Eikemo, T. A., M. Huisman, C. Bambra, and A. E. Kunst. "Health Inequalities According to Educational Level in Different Welfare Regimes: A Comparison of 23 European Countries." Sociology of Health & Illness 30, no. 4 (2008): 565-82.
Elo, Irma T., and Samuel H. Preston. "Educational Differences in Mortality: United States, 1979-1985." Social Science and Medicine 42 (1996): 47-57.
Are Socioeconomic Differences in Mortality Greater in a more Equal Society?
13
Goldman, Noreen. "Social Inequalities in Health: Disentangling the Underlying Mechanisms." Annals of the New York Academy of Sciences 954 (2001): 118-39.
Goldman, Noreen, Sanders Korenman, and Rachel Weinstein. "Marital Status and Health among the Elderly." Social Science and Medicine 40 (1995): 1717-30.
Grundy, Emily, and Andy Sloggett. "Health Inequalities in the Older Population: The Role of Personal Capital, Social Resources and Socio-Economic Circumstances." Social Science and Medicine 56 (2003): 935-47.
Gutierrez, Roberto G. "Parametric Frailty and Shared Fraitly Survival Models." Stata Journal 2, no. 1 (2002): 22-44.
Hansen, Hans, ed. Elements of Social Security. A Comparison Covering: Denmark, Sweden, Finland, Austria, Germany, the Netherlands, Great Britain, Canada. Copenhagen: The Danish National Institute of Social Research, www.sfi.dk, 2002.
Hoffmann, Rasmus. "Do Socioeconomic Mortality Differences Decrease with Rising Age?" Demographic Research 13/2 (2005): 35-62.
———. Socioeconomic Differences in Old Age Mortality. Edited by Kenneth C. Land. Vol. 25, Demographic Methods and Population Analysis. Dordrecht: Springer, 2008.
Hoover, Kevin D. "Some Causal Lessons from Macroeconomics." Journal of Econometrics 112, no. 1 (2003): 121-25.
Horiuchi, Shiro, and John R Wilmoth. "Deceleration of Age-Related Mortality Increase at Older Ages : Testing the Predictions of the Heterogeneity Hypothesis." (1994).
House, James S., Ronald C. Kessler, and A. Regula Herzog. "The Social Stratification of Aging and Health." Journal of Health and Social Behavior 35 (1994): 213-34.
House, James S., and Zachary Zimmer. "Education, Income, and Functional Limitation Transitions among American Adults: Contrasting Onset and Progression." International Journal of Epidemiology 32 (2003): 1089-97.
Huisman, Martijn, Anton E. Kunst, Otto Andersen, M. Bopp, J-K. Borgan, C. Borrell, G. Costa, P. Deboosere, G. Desplanques, A. Donkin, S. Gadeyne, C. Minder, E. Regidor, T. Spadea, T. Valkonen, and J. P. Mackenbach. "Socioeconomic Inequalities in Mortality among Elderly People in 11 European Populations." Journal of Epidemiology and Community Health 58, no. 6 (2004): 468-75.
Huisman, Martijn, Anton E. Kunst, and Johan P. Mackenbach. "Socioeconomic Inequalities in Morbidity among the Elderly; a European Overview." Social Science and Medicine 57 (2003): 861-73.
Hurd, Michael D., Daniel McFadden, and Angela Merrill. "Predictors of Mortality among the Elderly." In Themes in the Economics of Aging, edited by David Wise, 171-97: University of Chicago Press, 2001.
Hussain, Mohammad Azhar, ed. Poverty Dynamics in Denmark, Germany and the USA. Copenhagen: The Danish National Institute of Social Research, www.sfi.dk, 2002.
Johnson, Norman J., Eric Backlund, Paul D. Sorlie, and Catherine A. Loveless. "Marital Status and Mortality: The National Longitudinal Mortality Study." Annals of Epidemiology 10 (2000): 224-38.
Juel, Knud, and Karin Helweg-Larsen. "The Danish Registers of Causes of Death." Danish medical bulletin 46, no. 4 (1999): 354-57.
Kaplan, George A. "Economic Policy Is Health Policy: Findings from the Study of Income, Socioeconomic Status, and Health." In Income, Socioeconomic Status and Health: Exploring the Relationship, edited by James Allen Auerbach and Barbara Kivimae Krimgold, 137-49. Washington, DC: National Policy Association et al., 2001.
Kåreholt, Ingemar. "Social Class and Mortality Risk", Dissertation, Stockholm University, 2000. Kitagawa, Evelyn M., and Philip M. Hauser, eds. Differential Mortality in the United States: A Study
in Socioeconomic Epidemiology. Cambridge, Massachusetts: Harvard University Press, 1973. Klein, Thomas, and Rainer Unger. "Einkommen, Gesundheit Und Mortalität in Deutschland,
Grossbritannien Und Den USA." Kölner Zeitschrift für Soziologie und Sozialpsychologie 53, no. 1 (2001): 96-110.
Rasmus Hoffmann
14
Knesebeck, Olaf von dem, Günther Lüschen, William C. Cockerham, and Johannes Siegrist. "Socioeconomic Status and Health among the Aged in the United States and Germany: A Comparative Cross-Sectional Study." Social Science and Medicine 57 (2003): 1643-52.
Kunst, Anton, ed. Cross-National Comparisons of Socioeconomic Differences in Mortality, Thelathesis. Rotterdam: Erasmus University, 1997.
Kvist, Jon. "Welfare Reform in the Nordic Countries in the 1990s: Using Fuzzy-Set Theory to Assess Conformity to Ideal Types." Journal of European Social Policy 9, no. 3 (1999): 231-52.
Liang, Jersey, Joan Bennet, Neal Krause, Erika Kobayashi, Hyekyung Kim, J. Winchester Brown, Hiroko Akiyama, Hidehiro Sugisawa, and Arvind Jain. "Old Age Mortality in Japan: Does the Socioeconomic Gradient Interact with Gender and Age?" Journal of Gerontology: Social Sciences 57b, no. 5 (2002): 294-307.
Link, Bruce G., and Jo Phelan. "Social Conditions as Fundamental Causes of Disease." Journal of Health and Social Behavior 35, no. extra issue (1995): 80-94.
Lynch, Scott M. "Cohort and Life Course Patterns in the Relationship between Education and Health: A Hierarchical Approach." Demography 38, no. 4 (2003): 551-61.
Mackenbach, Johan P., and Anton E. Kunst. "Measuring the Magnitude of Socio-Economic Inequalities in Health: An Overview of Available Measures Illustrated with Two Examples from Europe." 44, no. 6 (1997): 757-71.
Mackenbach, Johan. P., Anton. E. Kunst, and Tapani Valkonen. "Socioeconomic Inequalities in Mortality among Women and among Men: An International Study." 89, no. 12 (1999): 1800-06.
Mackenbach, Johan P., Irina Stirbu, Albert-Jan R. Roskam, Maartje M. Schaap, Gwenn. Menvielle, Mall. Leinsalu, and Anton E. Kunst. "Socioeconomic Inequalities in Health in 22 European Countries." New England Journal of Medicine 358, no. 23 (2008): 2468-81.
Manton, Kenneth G., and James W. Vaupel. "Survival after the Age of 80 in the United States, Sweden, France, England, and Japan." The New England Journal of Medicine 333 (1995): 1232-35.
Marmot, Michael G. "Epidemiology of Socioeconomic Status and Health: Are Determinants within Countries the Same as between Countries?" Annals of the New York Academy of Sciences 896 (1999): 16-29.
Martelin, Tuija. "Socio-Demographic Differentials in Mortality at Older Ages in Finland." In Health and Mortality among Elderly Populations. International Studies in Demography, edited by Graziella Caselli and Alan D. Lopez, 112-34. Oxford: Clarendon Press, 1996.
Menchik, Paul L. "Economic Status as a Determinant of Mortality among Black and White and Older Men: Does Poverty Kill?" Population Studies 47 (1993): 427-36.
Moon, Marilyn. "Medicare and Health Care Reform." Journal of Aging and Social Policy 6, no. 1-2 (1995): 27-42.
O'Rand, Angela, John C. Henretta, Marta Tienda, and David B. Grusky, eds. Age and Inequality: Diverse Pathways through Later Life, Social Inequality Series. Oxford: Westview Press, 1999. Petersen, Jørn K. "The Danish Demographic Database - Longitudinal Data for Advanced
Demographic Methods." In Research Report: Danish Center for Demographic Research. SDU - Odense University, 2000.
Silventoinen, K., and E. Lahelma. "Health Inequalities by Education and Age in Four Nordic Countries, 1986 and 1994." Journal of Epidemiology and Community Health 56, no. 4 (2002): 253-58.
Smith, James P. "Consequences and Predictors of New Health Events." In NBER Working Paper National Bureau of Economic Research, 2003.
———. "Unraveling the Ses-Health Connection." Population and Development Review 30, supplement, no. Aging, health, and public policy: demographic and economic perspectives (2004): 108-32.
Soldo, Beth J., Michael. Hurd, Willard L. Rodgers, and Robert B. Wallace. "Assets and Health Dynamics among the Oldest Old: An Overview of the Ahead Study." Journal of Gerontology: Social Sciences 52b (1997): 1-20.
Are Socioeconomic Differences in Mortality Greater in a more Equal Society?
15
Stouffer, Samuel. "The American Soldier: Adjustment During Army Life." Princeton, New Jersey, 1949 1949.
Stronks, Karien. Socio-Economic Inequalities in Health: Individual Choice or Social Circumstances?, Dissertation. Rotterdam: Erasmus University, 1997.
Thorslund, Mats, and Olle Lundberg. "Health and Inequalities among the Oldest Old." Journal of Aging and Health 6, no. 1 (1994): 51-69.
Townsend, Peter, and Nick Davidson, eds. Inequalities in Health: Black Report. The Health Divide. London: Penguin, 1992.
Valkonen, Tapani. "Life Expectancy and Adult Mortality in Industrialized Countries." In International Encyclopedia of Social and Behavioral Sciences, 8822-27, 2001.
Vaupel, James W. "Demographic Analysis of Aging and Longevity." American Economic Review 88, no. 2 (1998): 242-47.
Williams, David R. "Race and Health: Trends and Policy Implications." In Income, Socioeconomic Status and Health: Exploring the Relationship, edited by James Allen Auerbach and Barbara Kivimae Krimgold, 67-85. Washington, DC: National Policy Association et al., 2001.
Wolff, Edward N., ed. Top Heavy: A Study of the Increasing Inequality of Wealth in America, A Twentieth Century Fund Press. New York: The Twentieth Century Fund Press, 1995.