RESEARCH
REPORT
An EU-wide survey of energy
regulators’ performance
Jean-Michel Glachant,
in partnership with PwC
ISBN: 978-92-9084-228-6 doi: 10.2870/22829
This text may be downloaded only for personal research purposes. Any additional reproduction for other purposes, whether in hard copies or electroni-cally, requires the consent of the authors. Source should be acknowledged. If cited or quoted, reference should be made to the full name of the authors, the title, the year and the publisher.
Table of contents
1. Introduction 3
1.1. The background of the study 3
1.2. The scope of the study 3
1.3. The set-up of the study 3
1.4. Independence and quality of the study 5
1.5. The structure of the report 5
2. Literature review 6
2.1. Literature on regulatory substance 7
2.2. Literature on regulatory governance 8
2.3. Literature on regulatory matching 10
2.4. Rationale of our study 10
2.4.1. Methodology of the study 10
2.4.2. Single-sector and multi-sector regulators 11
3. Our survey 13
3.1. Design 13
3.1.1. Introductory questions 13
3.1.2. Performance-related questions 14
3.1.3. Additional open questions 16
3.2. Response 16
3.2.1. Geographic coverage 16
3.2.2. Company profile 17
3.3. Outcomes 18
3.3.1. Performance-related questions 18
3.3.2. Specific open questions 29
4. Performance from an international perspective 31
4.1. The set-up of interviews 31
4.2. Main outcomes 32
5. Conclusions and considerations 33
5.1. Overall performance 33
5.2. Performance from a national perspective 34
5.3. Performance from an international perspective 36
A. List of references 37
B. Data quality 39
C. Questionnaire 43
D. Regulator characteristics 48
E. Response comparison of studies 49
F. Segmentation outcomes 50
G. Calculation methodologies 51
1.
Introduction
1.1. The background of the study
The Florence School of Regulation (FSR) has requested PricewaterhouseCoopers Advisory N.V. (‘PwC’) to jointly conduct a Europe-wide online survey among transmission system operators (‘TSOs’) and distribution system operators (‘DSOs’) of gas and electricity from a large number of European countries. The main purpose of this survey is to better understand the average qualification of European energy regulators’ performance as perceived by national grid companies and the characteristics of the regulator (e.g. the size of the regulator, single- or multi-sector regulator) that may explain the given qualification.
In addition to the online survey as mentioned above, FSR has also asked PwC to interview a group of relevant European stakeholders. The main reason for the interview is to assess the regulators’ performance from an international perspective, by considering their international roles as prescribed by the third package directives for an internal electricity and gas market in Europe.
1.2. The scope of the study
The study consists of three parts: (1) a literature review on previous studies on performance of regulators; (2) an online survey among national grid companies; and (3) interviews with European stakeholders.
The first part of the study (i.e. the literature review) is intended to provide a theoretical framework and the rationale for our online survey.
The second part of the study (i.e. online survey) mainly addresses the performance of national energy (i.e. gas and electricity) regulators at the national level. The performance of a regulator will be assessed based on the following four main indicators:
1. Capability of the regulator (e.g. energy sector knowledge, creating long-term regulatory commitment); 2. Management & governance (e.g. transparency, consistency of decisions);
3. Effectiveness (e.g. powers to undertake enforcement action, meeting policy objectives for the industry);
4. Social benefits (e.g. increasing overall efficiency in the sector, delivering lower tariffs for consumers). Through a survey, individual grid companies are invited to provide an ordinal score to express their views on their regulators’ performance level with respect to each of these four key indicators mentioned above.
In addition to the average performance of European regulators, we are also interested in the performance score of a specific subgroup of regulators with certain characteristics such as:
single-sector (i.e. only responsible for the regulation of gas and electricity) versus multi-sector regulators (i.e. also responsible for other industries, besides gas and electricity);
large and small regulators (in terms of FTE size or allocated budget).
The third part of the study involves interviews with European stakeholders to assess the international performance of national energy regulators with respect to their roles in promoting and facilitating the establishment of an internal EU gas and electricity market.
1.3. The set-up of the study
In this section, we explain the set-up of the online survey among grid operators and the interviews with European stakeholders.
The online survey
We have carried out the online survey to assess regulators’ performance via three steps.
Step 1 – Selecting the sample and questionnaire
In the first step, we have identified the following 21 European countries as the starting point for the survey. This group includes all sufficiently large EU countries and shows a fair representation geographically.
Austria Ireland Romania
Belgium Italy Slovakia
The Czech Republic Lithuania Slovenia
Denmark The Netherlands Spain
Finland Norway Sweden
Germany Poland Switzerland
Greece Portugal The United Kingdom
We have leveraged PwC’s Global Energy Network to contact and invite regulation managers at TSOs/DSOs from these countries. We have not received any valid response from three countries (Ireland, Lithuania and
Romania). So our final sample consists of 18 countries.
Subsequently, we prepared a list of questions, including open- and closed-ended questions related to the four performance indicators for regulators: capability, management & governance, effectiveness and social benefits (please refer to Appendix C for the complete question list).
Step 2 – Conducting online survey
In the second step, we programmed the questionnaire prepared in the previous step by using the online survey software Sawtooth SSI Web. The questionnaire was launched on a dedicated website specially designed for the survey. We have circulated an invitation for our survey with the link to this website to selected TSOs/DSOs from the countries we had selected in the first step. The selection for these TSOs/DSOs is largely based on the
existing business contacts that PwC Global Energy Network has. A minority of the contacts is directly provided by a regulator.
The survey went online on 5 June 2014 and was closed on 20 August 2014.
Step 3 – Performing analysis and synthesis
The third step involves interpreting the results from the online survey. We aggregated the individual responses to underpin our conclusions and safeguard reliable conclusions.
Before the interpretation phase, we assessed the quality of the responses and addressed potential bias issues. This gave us a ‘clean’ data set that forms the basis of our overall conclusions. For instance, we invited a number of respondents from different countries for an interview to get more background and explanation of their answers. In this way, the quality of the answers can be cross-checked.
Interviews with European stakeholders
In the light of the third package for an internal EU gas and electricity market, the international cooperation and coordination between national regulatory authorities have become increasingly important. These international aspects of regulators should therefore be considered when assessing their overall performance. To this end, we
1. Selecting the sample and questionnaire
2. Conducting online survey and interviews
3. Performing analysis and
have set up an interview programme to interview some relevant European organisations and prepared a list of questions related to the national regulator’s role in promoting and facilitating the establishment of the EU’s Internal Energy Market (please refer to Appendix H for the complete question list).
We managed to interview representatives from the following EU bodies:
European Commission (EC)
European Federation of Energy Traders (EFET)
European Network of Transmission System Operators for Electricity (ENTSO-E)
European Network of Transmission System Operators for Gas (ENTSO-G)
EURELECTRIC
EUROGAS
Gas Infrastructure Europe (GIE)
International Federation of Industrial Energy Consumers (IFIEC)
These organisations represent a broad range of stakeholders, including energy producers, traders, grid operators, suppliers, consumers and the European Commission. The contacts of these organisations are provided by the Austrian national regulator E-Control.
1.4. Independence and quality of the study
The independence of our research and the soundness of the methodology applied are critically important for FSR and PwC. We have made sure of this by applying academically sound methods and through an extensive review of our work by Prof. Dr Pollitt (University of Cambridge), a recognised expert in the field of international regulation practice, to safeguard an academic and objective approach. Also, PwC is a leading global assurance and advisory firm, with a strong and indisputable reputation for independence.
1.5. The structure of the report
In Section 2, we start with a literature review on the academic studies addressing regulatory performance in a broader context. This provides a theoretical framework and motivation for the current study.
In Section 3, we focus on the online survey among grid operators and its outcomes. All the questions asked in the survey will be explained in detail. The size of the final sample, relevant company profile and the geographic distribution of the participating companies, as well as the quality of the responses will be addressed in this section. We will finally aggregate and analyse the outcomes of the survey. We will present the aggregated performance scores and their interpretations and will also statistically test the reliability of the outcome when applicable. Besides, we will address the difference between the current study and a predecessor survey reported in Nillesen (2008).
In Section 4, we address the regulators’ performance from an international perspective based on the answers from our interviews with eight different European stakeholders as explained in Section 1.3.
2. Literature review
Due to high initial investment costs, the network elements of critical infrastructure sectors such as energy, water, rail transportation and telecoms are characterised as being natural monopolies. In these sectors, it is economically unviable to have a second company build and operate the infrastructure. So regulation is needed to prevent the abuse of monopoly power and protect the interest of consumers, and also to ensure investors a sufficient incentive to make necessary new and replacement investments.
Literature on regulatory performance is present in abundance (see Berg, 2009). In assessing the regulatory performance, different approaches have been used. Berg (2009) indicates that some of the literature focuses on the effect of the regulation on the market that is regulated (i.e. sector performance), while other research focuses on the regulatory system itself.
Sector performance of regulation commonly involves the main outputs of the regulation:
The degree of protection for consumers against disproportionally high service fees and poor infrastructure service quality by the regulation; and
The investment level required to secure the supply of infrastructure services.
According to Brown et al. (2006), the sector performance should be assessed considering whether the regulation supports or hinders in achieving the goals that the regulatory body has set up for the sector. We agree with Berg (2009) on the grounds that the regulator cannot be solely judged on the basis of sector performance – the entire regulatory system needs to be accounted for.
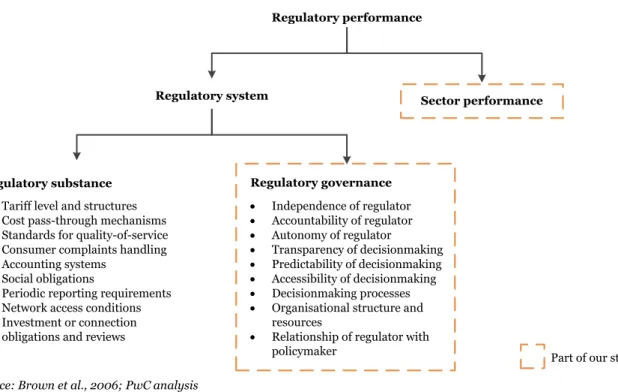
By the regulatory system for infrastructure, we mean “the combination of institutions, laws, and processes that give a government control over the operating and investment decisions of enterprises that supply infrastructure services”, which is the definition as per the World Bank (Brown et al., 2006, p. 17). Following the World Banks’s guidance, a full evaluation of the regulatory system should include several elements clustered in two basic dimensions of the regulatory system: the regulatory substance and the regulatory governance, as shown in figure 2.1. The regulatory substance refers to the ‘what’ of regulation, while the regulatory governance refers to the ‘how’ of regulation.
Figure 2.1: Key elements of the regulatory system
Regulatory system
Regulatory substance Regulatory governance Independence of regulator Accountability of regulator Autonomy of regulator Transparency of decisionmaking Predictability of decisionmaking Accessibility of decisionmaking Decisionmaking processes Organisational structure and
resources
Relationship of regulator with policymaker
Tariff level and structures Cost pass-through mechanisms Standards for quality-of-service Consumer complaints handling Accounting systems
Social obligations
Periodic reporting requirements Network access conditions Investment or connection
obligations and reviews
Sector performance Regulatory performance
Part of our study Source: Brown et al., 2006; PwC analysis
The regulatory substance covers the technical content of the regulation, based on which the regulator takes actual decisions. Examples of regulatory substance are the choice regarding tariff setting or benchmarking techniques that are used. The regulatory governance involves the legal and institutional design and
processes of the regulatory system (Berg, 2000), including aspects like independence, accountability,
transparency, predictability, the organisation structure and the resources of the regulator (Brown et al., 2006). Many of the studies found have primarily focused on one of these two dimensions of the regulatory system, i.e. regulatory governance or regulatory substance. In some studies (e.g. Jamasb & Pollitt, 2000), the regulatory substance was covered, while others mainly reported on regulatory governance (e.g. Nillesen, 2008). Our study is similar to Nillesen’s work from 2008 and will primarily focus on assessing regulatory governance. It mainly considers the perceived performance of regulators with respect to credibility, independency and transparency. The study will also address some aspects of the sector performance of the regulation (i.e. social benefits of the regulation).
In the following sections, we will review selected studies on regulatory substance (please refer to Section 2.1). Subsequently, we will present an overview of selected studies on regulatory governance in Section 2.2. Finally, we will explain the rationale of our study in Section 2.3.
2.1. Literature on regulatory substance
As mentioned earlier, many studies addressing the performance of regulatory systems focus on the regulatory substance. These studies generally study the performance of a single method or decision of regulators. Most of these studies compare between methods and decisions in different countries. In this section, we will zoom in on three studies that made such a comparison.
Jamasb and Pollitt (2000) studied the topic of incentive regulation and the status of the use of benchmarking (in incentive regulation of electricity distribution and transmission utilities) by regulators. They performed a survey among national regulators of 21 countries (17 OECD and 4 non-OECD countries) to evaluate to what extent benchmarking in incentive regulation was already adopted or intended to be implemented and what the main features of the adopted benchmarking methods and processes were. Their results showed that electricity regulators had adopted some form of benchmarking in several countries (13 of the 21 respondents) or were planning or considering to use benchmarking (7 of 21 respondents). With most of the regulators, that already adopted incentive regulation and benchmarking, the benchmarking was still in their first or second regulatory period. They also found that benchmarking was mostly used by regulators in countries that had well-developed competition, a spot market and a high degree of market liberalisation.
Finally, when the amount of published information and industry consultation were regarded as indicators for transparency of the regulatory process, most of the regulators did these things. The Netherlands, Great Britain and Norway were the European regulators considered to provide the best information.
Brophy Haney and Pollitt (2009) also performed a survey among electricity and gas regulators which focused on the benchmarking techniques used by regulators. Benchmarking is, according to the authors, essential for the efficiency improvements. In the survey — that got responses from the national regulators in 40 countries — questions were asked about the kind of benchmarking of network companies they used and about their
benchmarking analysis process. They concluded that there were considerable differences between countries in the techniques and methods that were used.
To be able to perform a cross-country comparison regarding the level of sophistication in the use of efficiency analysis, a best-practice index was set up. This index is based on Lovell (2006) and depends on the use of the benchmarking techniques (i.e. DEA, COLS and SFA), the use of underlying data for efficiency analysis (e.g. panel data, Totex), the incorporation of environmental factors (e.g. customer density, age asset) and other specific adjustments. This best-practice index was used to score and thus rank the individual regulators in terms of benchmarking performance. The European regulators regarding electricity regulation that scored best in the index were (in order): (1) Austria, (2) Finland, (3) Belgium, (4) Hungary, Ireland and Norway and (5) Great Britain. Regarding gas regulation, the found order of European regulators is: (1) Austria, (2) Belgium, (3) Great Britain, (4) Denmark, Estonia, Hungary and Ireland and (5) Spain.
In a 2013 paper, Brophy Haney and Pollitt analysed the theory and practice of international benchmarking of electricity transmission by regulators. This is done by performing desk research and a survey among 48 electricity regulators, of which 25 responded. The topic of the survey was the current practice in regulatory benchmarking of electricity transmission, which is a follow-up on the survey of Brophy Haney and Pollitt (2009). The survey questions cover the choice of benchmarking techniques, the detail of the benchmarking analysis and the current state of electricity transmission benchmarking and expectations for the future. The authors reported that there is a significant difference between electricity distribution benchmarking and electricity transmission benchmarking and that regulators are aware that transmission benchmarking is more challenging than distribution benchmarking, due to the limited number of national transmission operators (often just one) and associated lack of good comparators. But 13 of the 25 regulators did use some form of electricity transmission benchmarking.
The first and second study (i.e. Jamasb & Pollitt, 2000 and Brophy Haney & Pollitt, 2009) focused on the benchmarking methods and processes applied by national regulators to gas and electricity distribution companies. The last study (Brophy Haney & Pollitt, 2013) focused on the methods for electricity transmission benchmarking. Together, they provide a good insight into the current international practice of benchmarking methods and processes.
As mentioned earlier, these studies mainly related to regulatory substance (i.e. technical content of the regulation) and these studies all involve surveys of regulatory agencies. Below, we consider literatures on regulatory governance.
2.2. Literature on regulatory governance
In this section, we will address the academic studies on regulatory governance. Please note that regulator governance is a key part of regulatory performance.
Both desk research and surveys are commonly used in these studies to compare the performance of regulatory governance in different countries.
In 2003, Johannsen published a study on the assessment of regulatory independence of regulators. The study aims to describe and compare information on the design of the regulatory entities to come to a view on the current status of independence of regulators and factors determining this status. The study shows the results of a survey among eight European regulators with an emphasis on “independence in formal, legal/organisational terms rather than in behavioural terms” (p. 8). This means that this study focuses on the formal rules instead of how these are operated in practice.
Johannsen concludes that regulators’ independence varies between countries. An independence index was constructed based on four dimensions: independence of the regulator from government, from stakeholders, in decision-making and finally organisation autonomy. When scoring the eight regulators on this index, the Italian regulator topped the list, followed by those of Ireland and Northern Ireland. The author also indicates that this ranking needs to be interpreted carefully, due to the limited number of observations and the large variation between countries on each of the four measured dimensions.
Johanssen (2003) covers one specific element of regulatory governance (i.e. independence) and does not evaluate the broader scope of regulatory governance. Also Green et al. (2009) addressed some elements of regulatory governance. Some individual regulators have performed surveys to analyse their own performance (e.g. Plug et al., 2003). But to the best of our knowledge, an independent and objective comparison of
regulators’ performance has only been done a limited number of times.
Larouche et al. (2013) have studied the impact of independence, accountability and resources of the regulator of different sectors on the perceived quality of these regulators. To this end, they did a desk research on the resources (budget size and number of full-time equivalent staff) of the regulators and the different aspects of accountability and independence. They also conducted an international survey among regulators, regulatees (companies subjected to the regulation) and academic experts to measure the perceived quality of the regulators. They particularly considered the possible correlation between independence, accountability and resources of the selected regulators.
The results showed that independence, accountability and the amount of resources of the regulator, indeed contributed to the perceived quality. So the authors advise regulators to ask for a greater independence and to offer more accountability. They also found that independence and accountability positively correlate with each other. Although this could mean that improving one of the two would be enough, they do suggest improving both independence and accountability in a balanced way, as it is the combination of the two that determines the perceived quality.
In 2008, Nillesen published the study ‘A Different Perspective on Energy Network Regulation: An International Survey of Regulation Managers’. In this study, various aspects regarding regulatory governance were analysed by doing a perception survey among network companies. This study is similar to our study, which we have described in detail in the next section.
Nillesen’s survey was held among 75 network companies (of which 43 were European) to assess their national regulatory system and included both open- and closed-ended questions. The indicators of regulators’
performance addressed in the study are the quality of the regulator, the effectiveness of the
instruments of the regulator and the achievements of the regulator. We note that the third indictor
relates to the sector performance of the regulation.
For each of these aspects, the regulation managers were asked to rate the regulator’s performance indicators as mentioned above. An overall score for the regulator and the best-practice regulators was also asked in the survey. Finally, the survey participants were invited to provide their views on the biggest challenges from a regulation perspective and actions that would improve the quality of the regulator.
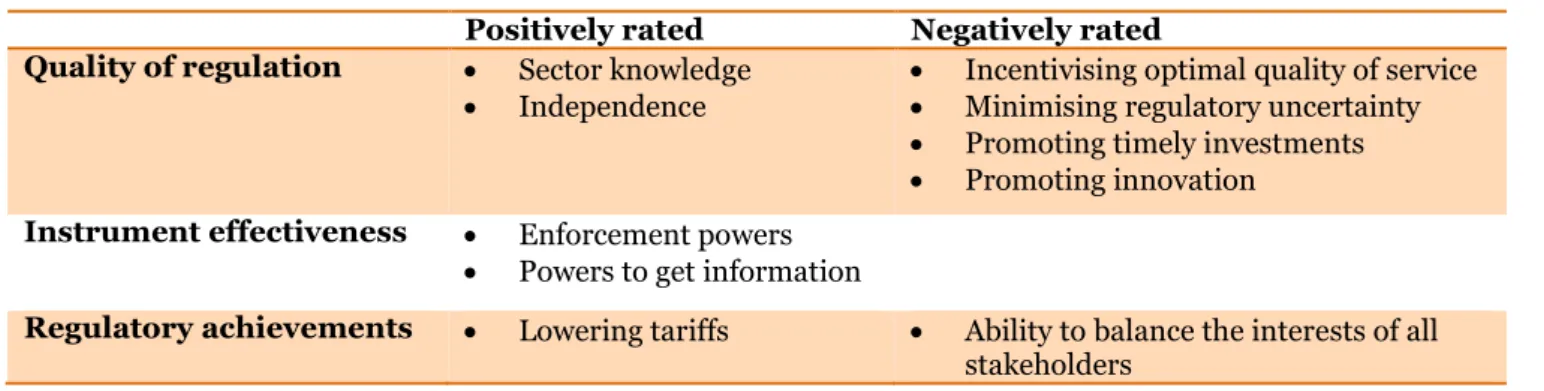
When the score of an indicator was below 3 (out of 5), the indicator was negatively rated. If the score was above 3, the indicator was positively rated. The main outcomes of this study are summarised in table below.
Table 2.2: Summary of findings of Nillesen (2008)
Positively rated Negatively rated Quality of regulation Sector knowledge
Independence
Incentivising optimal quality of service
Minimising regulatory uncertainty
Promoting timely investments
Promoting innovation
Instrument effectiveness Enforcement powers
Powers to get information
Regulatory achievements Lowering tariffs Ability to balance the interests of all stakeholders
Source: Nillesen (2008)
The average overall score that is given to all regulators is a 5.5 out of 10, although the European regulators receive a higher average overall score of 6.1. Of the national regulators in Europe, the regulator of the UK (Ofgem) is considered to have best-practice, together with the regulators of Finland, Norway and Austria. The three main suggestions to improve the quality of regulators are (i) retaining key staff and thereby increasing knowledge and decreasing reliance on consultants, (ii) improving the approach and way of working, and (iii) further improving the regulatory process and structure.
Most of the grid operators also indicated that regulation is high on their board’s agenda and that the five biggest challenges they were facing from a regulatory perspective are: (i) an increasing regulatory and administrative burden, (ii) increasing regulatory uncertainty, (iii) a lack of coordination between regulatory initiatives and actual market developments, (iv) a lack of realisation of the actual impact of regulatory policies on
administration or IT requirements, and (v) the aligning of the business to the regulatory reality. They would characterise their approach towards their regulator as either cooperative and consensus-seeking or more content-driven. The regulator’s approach was seen as confrontational and legalistic, which is in line with our expectation.
2.3. Literature on regulatory matching
The Florence School of Regulation investigated the interplay between “sector performance” and “regulatory systems”. In their five key research studies (2009-2014), the Florence School researchers showed that the properties of a “regulatory compact” (made, on the one hand, of a given energy sector and, on the other hand, of a given regulatory framework) is strongly influenced by the matching properties between the detailed
characteristics of the energy sector and the detailed characteristics of the regulatory framework.
In Lévêque et al. (2009), it is shown that a perfect match in an isolated country might not perform for deeply interconnected sectors and interacting frameworks. In Saguan et al. (2011), they showed it again by studying the British regime for the BritNed interconnector as an entry gate to the EU internal market. Glachant et al. (2013a) demonstrated that the property of “matching” between the sector detailed characteristics and the detailed regulatory framework characteristics, as identified in 2009 and 2011, has a more general logical and analytical validity.
In Glachant et al. (2013b), they illustrated it again by applying it to the case of TSOs’ grid investments in the interconnected “market coupling area” consisting of The Netherlands, Belgium, Germany and France. In Glachant et al. (2014), they provide an empirical overview of existing regimes for granting rights to use hydropower, which suggests new extensions of this “sector / framework matching” property.
2.4. Rationale of our study
As mentioned before, our study is similar to Nillesen’s study (2008) and so can be seen as an adaption and an update of that study. The key differences with Nillesen’s work are as follows:
We focus on European regulators (with a larger sample in Europe), while Nillesen also considered international regulatory bodies outside Europe, including regulators from the US, India and Australia
Our questionnaire is more extensive than the question list used by Nillesen
We included an econometric analysis to assess the relationship between the perceived performance of individual sub-indicators and the overall performance of the regulator (i.e. a statistical dependence between the score of each sub-indicator and the overall score)
We explicitly consider the potential difference in perceived performance between single- and multi-sector regulators.
The motivation for the methodology used in this study is provided below in Section 2.3.1. A brief literature overview of single- and multi-sector regulatory approach will be discussed in Section 2.3.2.
2.4.1. Methodology of the study
According to the OECD (2012), “understanding and improving the perception of the regulatory environment matters to performance” (p. 7). How stakeholders perceive the regulator is an important indicator of regulators’ performance.
Several parties other than the regulator are present in the regulatory environment in the energy sector, including the government, consumers and network companies. The utilities are the stakeholders which are most dependent on the regulator and have regular interaction with the regulator. So it is sensible to ask about the utilities to assess the regulator. A perception survey helps do this. Although these surveys are increasingly used in OECD countries (OECD, 2012), they are not performed very often in assessing regulated grid
companies’ view on the regulatory performance in the energy sector.
The OECD has published a relevant report with guidance on perception surveys. So the study ’Measuring Regulatory Performance: A Practitioner's Guide to Perception Surveys’ has been used as the base to design the perception survey used in this study.
One important aspect to keep in mind while designing the perception survey is the possible bias (positive or negative) of grid companies towards their regulatory system. Such a possible bias is named as regulatee bashing by Larouche et al. (2013). The OECD (2012) also mentions regulatee bashing as “business perceptions of regulation may be more negative than those of the general public. This may be due to the increased focus by businesses on the costs of regulation rather than on the benefits” (p. 49). We have taken into account this possible bias when designing the survey and while analysing the results. In our survey respondents are obliged to provide a reason when they assign a low score. It is worthwhile to note that a too positive score might not necessarily be good, since it could indicate regulatory capture, as described by Stigler (1971).
The primary focus of our study is, as mentioned before, regulatory governance. But it also touches upon the effects of the regulatory system on the sector. Although the study does not contain a full evaluation of the regulatory systems, it provides a valuable insight into the regulatees’ perception of regulatory performance. Our questionnaire is based on the following ten key principles of regulatory governance as suggested by Brown et al. (2006):
Independence
Accountability
Transparency and public participation
Predictability
Clarity of roles
Completeness and clarity in rules
Proportionality
Requisite powers
Appropriate institutional characteristics
Integrity
2.4.2. Single-sector and multi-sector regulators
Our study will explicitly consider the potential differences between single-sector and multi-sector regulators. A single-sector regulator is exclusively responsible for the regulation of a specific sector (i.e. the energy sector in this study). A multi-sector regulator is a regulatory body with the responsibility to regulate multiple sectors (like energy, telecom and water). Traditionally, the vast majority of regulators are single-sector regulators. Outside Europe, many examples of multi-sector regulators can be found in Canada, the US, Singapore, Malaysia and South Africa (Intven & Tétrault, 2000). Within Europe only a few regulators are multi-sector regulators, like those of Latvia (since 2001), Germany (since 2005), the Netherlands and Spain (both since 2013). Several studies have compared the single-sector and multi-sector regulatory frameworks (e.g. Schwartz & Satola, 2000; Hewitt, 2004; and Hellerstein & Associates, 2008). There are advantages and disadvantages to both the frameworks.
Single-sector framework
Supporters of single-sector regulation usually argue that the regulation of a single sector allows professionals to become more specialised and focused, which contributes to greater efficiency and effectiveness. Also they believe that single-sector regulators need to show greater accountability than multi-sector regulators, since single-sector regulatory bodies are watched more closely by the regulated sector.
Potential disadvantages of a single-sector framework are:
Possibly larger inconsistency in the regulation application between different sectors, since every sector has a separate regulatory body with their own regulation approach;
Higher total regulation costs of a country, as a result of the existence of different regulatory bodies.
Multi-sector framework
A key argument for supporting a multi-sector approach is that a multi-sector regulation model reduces the regulation costs by removing duplication of regulation staff and other resources. Other advantages of a multi-sector approach usually cited by supporters are:
Higher predictability of regulation and lower market distortions, due to consistencies in regulation across different sectors;
Increased options for hiring high-calibre professionals.
However, potential disadvantages of a multi-sector approach are: (i) a possible dilution of sector-specific knowledge and (ii) possible delays in reform processes due to potential difficulties in achieving agreement between the relevant ministries.
Practical examples of multi-sector regulators in Europe
In the Netherlands, the single-sector regulator has been integrated into a multi-sector regulator to create more effective and efficient regulation. A compact and powerful multi-sector regulator was thought to be able to cope with new developments like internationalisation, technological innovations and changing markets by adopting a flexible and integrated approach, whilst saving costs (Tweede Kamer der Staten-Generaal, 2012). Due to the short existence of the multi-sector regulator of the Netherlands, there has not been an evaluation of the change towards the multi-sector framework.
But such an evaluation does exist for the multi-sector regulator of Latvia. In this evaluation it was found that: “(i) the structure gives economies of scale and of scope in using scarce legal and economic regulatory expertise; (ii) the household ability to pay problem of the transition period was addressed by introducing tariff increases across sectors in a balanced manner; (iii) uniform tariff setting principles and information collecting
procedures are applied in the regulation of the various sectors, reducing the risk for investments by establishing a predictable regulatory environment; (iv) the risk of ‘regulatory capture’ is less for a multi-sector regulator than for a single-sector regulator; and (v) as some utilities undertake cross-sector activities it is logical that the regulator is cross-sector” (Firma L4, 2004, p. 7).
Based on the evaluation, it can be concluded that the multi-sector framework of the Latvian regulator indeed led to increased effectiveness of the regulator, increased independence and a higher predictability of regulation.
3. Our survey
This section is structured as follows. In the first subsection, the design of the survey is described and the questions are explained. In the second subsection, the characteristics of the participating companies and the respondents are discussed. In the final subsection, the outcomes of the survey are analysed in detail.
3.1. Design
This survey is designed to get insight into the views of regulated grid companies on their regulator’s
performance. The regulatory performance will be qualitatively assessed along the four dimensions: capability, management & governance, effectiveness and social benefits. The first three dimensions are the key elements of regulatory systems (more precisely, regulatory governance, please see figure 2.1), whereas the fourth dimension relates to the sector performance of the regulation.
The online survey was conducted in June 2014. The survey has been circulated among more than 170 transmission and distribution grid companies from 21 different European countries.
The survey was accessible through a dedicated website. PwC’s Global Energy Network, an international
network, contacted finance directors, regulation managers or employees of utility companies, with some degree of involvement with their regulator, to participate in the survey. Multiple contacts per company were contacted, but only one representative per company is included in the analysis. Responses were completely anonymous and confidential.
The survey consists of three parts:
1. Introductory questions
- Respondents were asked to provide background information about their working experience with regulation and the company profile.
2. Performance-related questions
- Respondents were invited to give their opinion on the performance of their regulator with respect to
certain areas (e.g. such as industry experience, independence, consistency in decision-making) and the regulatory approach, the economic rationale and overall score of their regulator.
3. Specific open questions
- Respondents were asked about challenges relating to regulation which the company is expected to
face, the possible improvements and the best-practice regulators. Please refer to Appendix C for the full online questionnaire.
3.1.1. Introductory questions
Here respondents were asked to provide some background information about their company and their own role in the company.
The main purpose of these questions is to gather insight into the business profile of the companies who have participated in the survey and into the involvement and experience of the respondents with energy regulation. The background information can be relevant for analysing potential difference in perceptions of different grid operators. Also, it can be used to support the credibility of the responses. It is reasonable to assume that senior staff with substantial working experience of regulation and with intensive contacts with regulators generally will provide more reliable and realistic answers. The background information concerning the geography allows us to analyse the geographic distribution of the respondents.
We specifically asked the following questions: (i) the profile of the company, (ii) the name of the company, (iii) the ownership structure, (iv) the FTE size of the company, (v) the amount of regulated revenue, (vi) the company’s regulator, (vii) the strategic importance of the regulation, (viii) the respondent’s position in the
company, (ix) the respondent’s personal involvement with regulation issues, and (x) the respondent’s experience with energy regulation.
3.1.2. Performance-related questions
In this part, respondents were asked to give their opinion about the performance of their regulator in different areas. The purpose of the performance-related questions is to gain a deeper insight into the grid operator’s view on the overall performance of the regulator.
Our questions on the performance of the regulatory authorities are in line with the performance indicators as suggested by the World Bank (Brown et al., 2006).
We categorise the performance-related questions into four categories: 1) Capability
2) Management & governance 3) Effectiveness
4) Social benefits
Each category contains multiple sub-indicators. For each sub-indicator, respondents are invited to rate them on a scale from 1 to 5, where 1 is the lowest (i.e. most negative) and 5 the highest (i.e. most positive). To reduce the possible bias that the respondent randomly or intentionally provides very poor scores, the respondents are asked to provide an explicit example of reasons when they give a rating of 1 or 2. In this way, the respondent is forced to justify their low-scored answers. Also, we requested the respondent for reasons that can be verified by public sources whenever applicable. In addition, respondents have to rank the importance for each of the sub-indicators on a scale of 1 to 3 where 1 is unimportant, 2 is neutral and 3 is important.
Capability
This category covers the following aspects of the regulator: (i) sector knowledge, (ii) clarity of regulation objectives, (iii) ability to adapt to changing circumstances, (iv) ability to incentivise cost efficiency, (v) ability to promote financial sustainability of the network companies, (vi) ability to stimulate optimal quality of service, (vii) ability to influence environmental policies, (viii) ability to promote timely investment, (ix) willingness to promote technological innovation, (x) willingness and ability to create long-term commitment, (xi) timeliness of decisions, and (xii) quality of information services and communication.
A priori we expect grid companies to be ‘neutral’ or slightly positive on average (i.e. an average score equal to or slightly higher than 3) about their regulator’s capability. For some capability indicators such as sector
knowledge, clear definition of objectives and quality of information services and communication, a positive rate will be expected, given the length of existence of some of the regulators in our sample. We expect companies to be negative (i.e. average score lower than 3) about: incentives for optimal quality of service, promotion of timely investments, promotion of innovation and long-term commitment. These factors capture some of the
challenges that regulators face when attempting to satisfy short-term policy objectives to lower tariff and longer-term regulatory and sector developments. Examples of the regulatory challenges are incorporating an effective measure of quality into incentive schemes or ensuring that investments are not only timely, but effective and efficient.
Management & governance
This category addresses the following aspects of the regulator: (i) transparency, (ii) consistency of decisions, (iii) policy to minimise regulatory uncertainty, (iv) independence, (v) integrity, (vi) accountability of its own actions, and (vii) fairness.
Overall, we expect grid operators to be positive (i.e. average score higher than 3) about management & governance. In particular, the regulators will be favourably valued on grounds of transparency, independence, integrity and fairness. These quality measures are the basic ingredients for good regulation and should be
recognisable by regulated companies. We expect grid companies to be negative (i.e. average score lower than 3) about regulatory uncertainty and the regulator’s accountability.
Effectiveness
This category includes the following performance sub-indicators: (i) the power to take actions, (ii) the power of information acquisition and investigation, (iii) whether they succeed in meeting policy objectives for the industry, (iv) balancing interest of stakeholders, and (v) whether they succeed in reducing the regulatory and administrative burden.
We expect that the effectiveness of the regulator will be rated favourably (i.e. average score higher than 3), as a regulatory body is perceived to have the real power to enforce actions and investigate. Also, an independent regulator should balance the interests of different stakeholders. Grid operators are likely to be less positive about the success in reducing the regulatory and administrative burden.
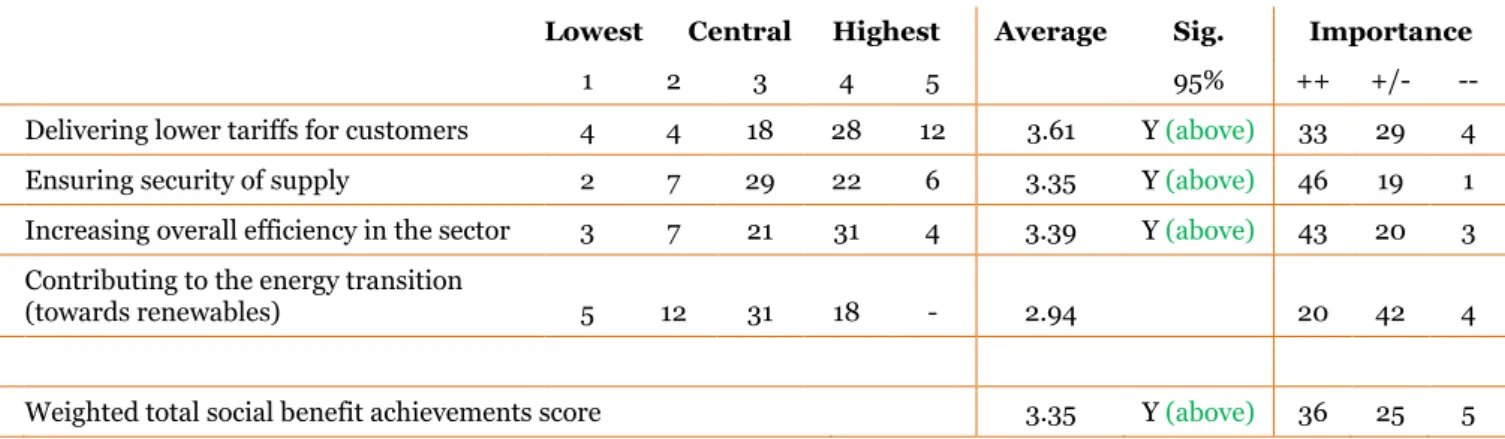
Social benefits
In contrast with capability, management & governance, and effectiveness, the social benefits relate to the sector performance (please refer to figure 2.1). This is an indirect performance indicator for regulators, as regulator actions influence the market performance of the sector. The category ‘social benefits’ covers the following aspects: (i) delivering lower tariffs for customers, (ii) ensuring security of supply, (iii) increasing overall efficiency in the sector, and (iv) contributing to the energy transition.
On average, we expect the regulation managers to be positive (i.e., average score higher than 3) on social benefits. Not many grid companies will suggest that they are charging excessive tariffs to their customers and that the market in which they operate is not efficient. Also, they should perceive a positive contribution from the regulator towards improving the security of supply.
For the contribution to energy transition towards renewables, we expect the companies to be less positive (i.e. average score lower than 3). This is because of the fact that regulation of renewable energy is not fully
developed yet.
Other performance-related questions
Besides the questions directly linked to the four key performance indicators, we also asked respondents to provide their views on the regulator’s attitude towards their companies and their company’s attitude towards the regulator.
Four possible attitudes were defined: (i) confrontational and legal-based, (ii) cooperative and consensus-seeking, (iii) expert role, analytical and content-driven (thought leader), and (iv) passive and reactive.
A priori, the most likely approach is that most companies will view the regulator’s approach as confrontational and legal-based. It is likely that, given the different objectives between the companies and the regulator, the approach may end up being confrontational and legal-based, while the intention may initially have been more consensus-seeking. On the other hand, we expect that most companies will qualify their approach as either cooperative or consensus-seeking or as an expert role (thought leader). But we expect that companies will change their approach and resort to legal action once decisions are taken by the regulators that do not meet the company’s expectations.
To test the objectivity and the independency of the regulator’s decisions, we explicitly asked grid companies for their perceptions of whether there is an economic rationale behind the regulation they faced. They have to indicate this on a scale of 1 to 5 where 1 is ‘not at all’ and 5 is ‘entirely’. It is likely that the regulation is driven by economic rationale, so we expect an average score higher than 3.
As the final question of this part, the respondents were invited to give an overall rating for the regulator’s performance between 1 and 10, where 1 was the most negative and 10 the most positive. Given the amount of experience and knowledge many European regulators have built up over the years, we expect the regulators to pass (i.e. higher than 5). But it is likely that the spread of scores will be high, with some companies being very negative and some companies very positive about their regulator.
3.1.3. Additional open questions
The main purpose of these specific open questions is to get insight into grid companies’ views on the changes in the field of regulation and best practice regulators in Europe.
The respondents were asked three open-ended questions. The first question focuses on the changes facing the companies from a regulation perspective. The second question asks the regulation managers to name the changes in regulation that they would like to see. The final open question asks the respondents to identify, in their view, the best-practice regulator from our sample.
First of all, we do not expect that every regulation manager will have a clear-cut idea about the best-practice regulators across Europe. This is simply because they do not have the necessary knowledge of regulators in other countries. So possible bias in the responses is not possible, as the respondents may intend to name the regulators they know (for instance, the regulators from their own and neighbouring countries).
3.2. Response
In total, 66 grid companies took part in the survey.1 Compared to previous surveys in the field of regulation, this
sample size is considered relatively high (please refer to Appendix E for a comparison). We did not expect a proportionate response rate per country, as we did not know what the actual responses per country would be and as the total number of TSOs and DSOs varies considerably across countries (from a few to hundreds). Please note that the number of actual responses from most countries is limited; implying that the average score of individual country based on this survey may be not representative from a statistical point of view.
Before we analysed the responses, we tested the quality of the data points from the responses along the following quality indicators:
1. Total elapsed time for completing the whole survey: an extremely low elapsed time can indicate poor and unreliable answers.
2. Page time (=the time spent for answering the performance-related questions) has a similar function to the elapsed time, but is restricted to the key part of the survey.
3. Consistency tests the correlation between the scores for performance sub-indicators and the overall performance scores. A weak correlation indicates poor consistency.
4. Credibility of the respondent: we identified the function and the seniority of the respondents (in terms of their experience and involvement with regulation), assuming that senior respondents will provide more accurate responses.
Based on these tests, we concluded that the overall quality of the responses is fairly good. The detailed analysis of each quality indicator is presented in Appendix B.
3.2.1. Geographic coverage
The geographic focus of our research is Europe and we have circulated our survey among TSO and DSO companies from the following 21 countries.
Austria Ireland Romania
Belgium Italy Slovakia
The Czech Republic Lithuania Slovenia
Denmark The Netherlands Spain
Finland Norway Sweden
Germany Poland Switzerland
Greece Portugal The United Kingdom
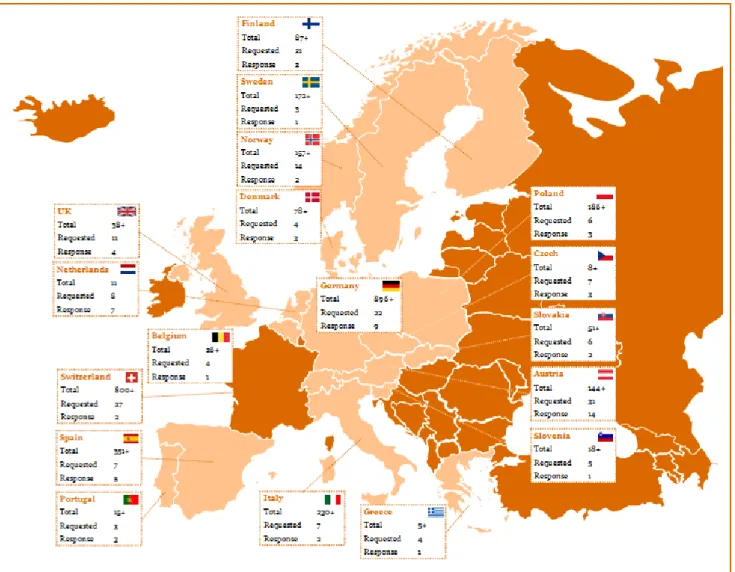
From Ireland, Lithuania and Romania, no valid responses have been received. So we have excluded these countries from our sample. Figure 3.1 shows the number of responses, the number of grid operators invited to participate in the survey, and an indication of the total number of network companies in a country.2
Figure 3.1: Geographical representation
Source: PwC analysis; Eurelectric (2013); CEER (2013); IEA (2012) and websites of national regulators
3.2.2. Company profile
Based on the answers in the first part of our survey (‘Introductory questions’), a number of relevant
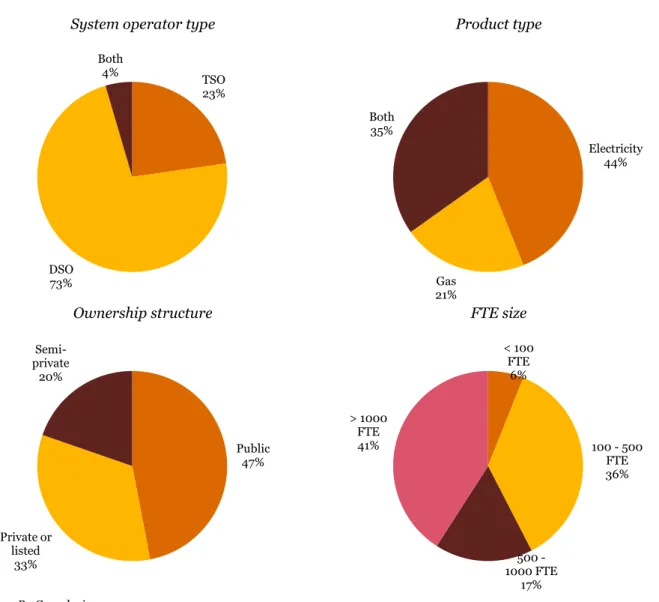
characteristics of the business profile of the respondent’s company are analysed. A summary of the results is shown in Figure 3.2.
We observe that most of the participating companies are DSOs (>70%). This is expected, as there are much more DSOs than TSOs in Europe. Both gas and electricity grid operators are well presented (21% gas and 44% electricity). Public and private-owned grid companies are almost equally represented in our sample (53% private or semi-private and 47% public). Most of the companies (ca. 60%) from our sample have more than 500 FTEs.
2Please note that only a minimum amount of total network companies are shown, as the exact number is difficult to get due
Figure 3.2: Company characteristics
System operator type Product type
Ownership structure FTE size
Source: PwC analysis
3.3. Outcomes
In this section, we analyse the outcomes of the performance-related questions (the second part of our survey) and the specific open questions (the third part of the survey). For the performance-related questions, we note there are 66 data points (answers) for each of our questions, as we have 66 participants. But for the specific open questions, we only have 65 data points (answers), since not every participant provided answers for this part of the survey.
3.3.1. Performance-related questions
The perceived performance of a regulator is based on the average rating for its overall performance and the average rating for the performance of the regulator in the following areas: capability, management & governance, effectiveness and social benefits.
This subsection is structured as follows: first, we perform analysis on the overall performance. Second we examine the average score per individual sub-indicator of the four specific key indicators. Third, we perform segmentation analysis on the individual sub-indicators. Fourth, we compare overlapping sub-indicators and the overall performance score with Nillesen (2008). Finally, we present the outcome of the other performance related indicators: the regulators’ and companies’ approach, the economic rationale and the companies’ strategies driven by regulation.
TSO 23% DSO 73% Both 4% Electricity 44% Gas 21% Both 35% Public 47% Private or listed 33% Semi-private 20% < 100 FTE 6% 100 - 500 FTE 36% 500 - 1000 FTE 17% > 1000 FTE 41%
Performance from a national perspective
In our survey, grid operators are asked to rate the overall performance of their national regulators by giving a score between 1 (worst) and 10 (best). With an average score of 6.6 for the overall performance, the national regulators in Europe are favourably rated by their regulated grid companies3. This positive rating is slightly
higher than the outcome of the earlier study of Nillesen in 2008 (with an average score of 6.1 for regulators in Europe).
The figure below shows the distribution of the scores. A majority of the respondents (77%) gave a score between 6 and 8.
Figure 3.4: Distribution of the overall score
Average 6.6 Sig. 95% Y
Source: PwC analysis
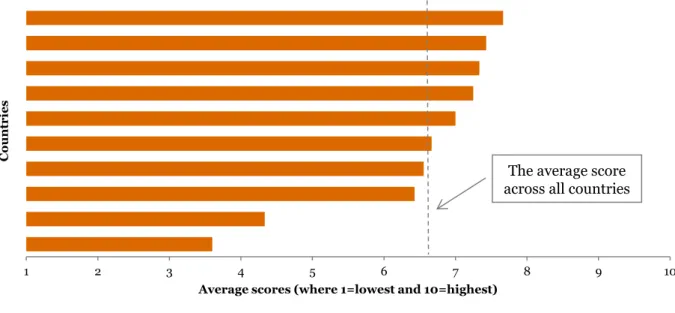
The average scores per regulator vary considerably across countries (from the lowest score of 3.6 to the highest score of 8). It should be noted that there was a limited number of respondents per country (with an average of three respondents), a comparison of country performance rating is not statistically sensible.
Figure 3.5: Average score per country with three or more responses
Source: PwC analysis
3 A very high score (i.e. close to 10) would not necessarily be good, as it could indicate regulatory capture.
- 4 3 3 2 9 22 20 3 - 5 10 15 20 25 1 2 3 4 5 6 7 8 9 10 N u mb e r o f res po n d en ts
Scores (where 1=lowest and 10=highest)
1 2 3 4 5 6 7 8 9 10
Average scores (where 1=lowest and 10=highest)
Co u n tri e s
The average score across all countries
It is worthwhile noting that the regulators in Spain and the Czech Republic are rated relatively poorly by their grid operators. The main arguments for the poor score for the Spanish regulator NCMC, as mentioned by the Spanish grid operators, are limited competence and independence (only responsible for assessment and monitoring, but decisions are made by ministries), lack of transparency and consistency, and poorly designed regulation framework for renewable energy sector. The reasons for a low rate cited by the Czech grid companies are a lack of long-term vision, reactive attitude, lack of skills, accountability and transparency. We emphasize that the relatively poor ratings of Spain and of Czech Republic are only based on a limited number of responses, and are therefore not necessarily representative of other grid companies in these countries.
We examine whether there are any statistically significant differences in the overall score between different groups of regulators and grid companies. As shown in the table below, a significant difference if found in the overall score for single- versus multi-sector regulators. Single-sector regulators are statistically higher rated by their grid companies than multi-sector regulators.
Table 3.6: Segmentation of the average scores for overall performance
Regulator characteristics Company characteristics
Single Multi 95% Large Small 95% TSO DSO 95% Public Priv. 95% Large Small 95%
Overall score 6.9 6.0 Y 6.5 6.7 6.9 6.4 6.8 6.4 6.6 6.6
Source: PwC analysis
Specific performance
Besides the rating of the overall performance, each regulator is also rated for specific individual performance indicators (between 1=worst and 5=best). These indicators are grouped into four main categories: capability, management & governance, effectiveness and social benefits. We examine the average score per performance indicator and assess whether these are positively (>3), centrally (=3) or negatively (<3) rated. We also asked the respondents to rank the importance of each performance indicator. In the tables below, we use the symbols ++, +/- and – to indicate ‘critically important’, ‘neutral’ and ‘not important’, respectively.
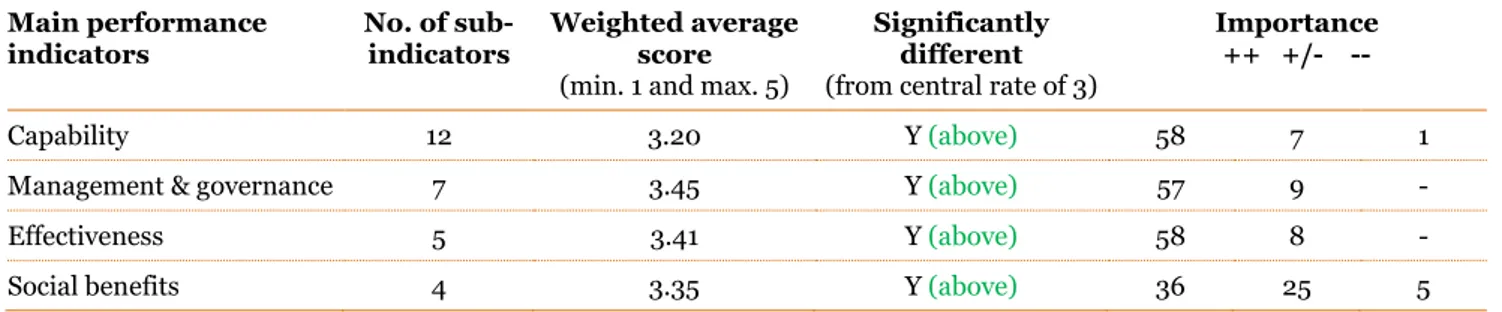
As the average scores of each indicator are estimated from a sample, we need to do a statistical test to see whether the sample averages (as shown in table 3.7) are statistically significantly different from the central rate of 3. Please refer to Appendix G for the calculation of the weighted average score and significant differences. Our results suggest that all indicators; capability, management & governance, effectiveness and social benefits are positively rated from a statistical point of view (i.e. above 3). Please refer to table 3.7 for the results. In line with the poor rating for the overall performance, the regulator in Spain is negatively rated (i.e. below 3) almost for all performance indicators, which is however based on limited number of observations.
Table 3.7: The weighted average score per key performance indicator Main performance indicators No. of sub-indicators Weighted average score
(min. 1 and max. 5)
Significantly different
(from central rate of 3)
Importance ++ +/- --
Capability 12 3.20 Y (above) 58 7 1
Management & governance 7 3.45 Y (above) 57 9 -
Effectiveness 5 3.41 Y (above) 58 8 -
Social benefits 4 3.35 Y (above) 36 25 5
Source: PwC analysis
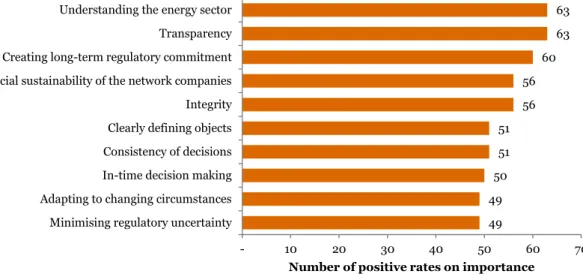
A majority of the responses (more than 80%) considered capability, management & governance and
effectiveness very important for the performance of the regulators. In particular, the survey shows that sector knowledge, transparency, creating long-term regulatory commitment, promoting financial sustainability of the
network companies and integrity are the top five most important performance indicators of a regulator (please see figure 3.8 on the next page). Below we discuss the scores of specific individual performance indicators.
Figure 3.8: The top 10 indicators based on importance ratings
Source: PwC analysis
Capabilities
In the table below, we summarise scores for the capability sub-indicators. The table reports the distribution of the scores, the sample average and the column next to this indicates whether the average score is statistically significantly different from the central expected average (score of 3). In the final three columns, a distribution of the importance assigned by the respondents is shown. In the last row of the table, the weighted average score for capability is calculated, where the average is weighted by the importance score.
Table 3.9: Scores and importance of capabilities
Lowest Central Highest Average Sig. Importance
1 2 3 4 5 (95%) ++ +/- -- 1 Understanding the energy sector - 7 12 32 15 3.83 Y (above) 63 3 - 2 Clearly defining objectives 2 8 29 24 3 3.27 Y (above) 51 15 - 3 Adapting to changing circumstances 1 12 27 24 2 3.21 Y (above) 49 17 - 4 Incentivising cost efficiency 3 9 19 22 13 3.50 Y (above) 42 24 - 5 Promoting financial sustainability 5 14 21 24 2 3.06 56 10 - 6 Incentivising optimal quality of service 4 14 23 19 6 3.14 29 33 4 7 Influencing environmental policies 5 21 32 8 - 2.65 Y (below) 11 36 19 8 Promoting timely investment 6 10 24 24 2 3.09 45 21 - 9 Promoting technological innovation 8 14 31 12 1 2.76 Y (below) 32 25 9 10 Creating long-term regulatory commitment 5 8 25 24 4 3.21 Y (above) 60 6 - 11 In-time decision making 3 11 37 13 2 3.00 50 16 - 12 Quality of information services and
communication 1 7 27 28 3 3.38 Y (above) 27 37 2 Weighted total capability score 3.20 Y (above) 58 7 1
Source: PwC analysis 49 49 50 51 51 56 56 60 63 63 - 10 20 30 40 50 60 70
Minimising regulatory uncertainty Adapting to changing circumstances In-time decision making Consistency of decisions Clearly defining objects Integrity Promoting financial sustainability of the network companies Creating long-term regulatory commitment Transparency Understanding the energy sector
Respondents gave the highest average grade to ‘understanding the energy sector’ (3.8), whereas the lowest score is given to ‘influencing environmental policies’ (2.6). Most important indicator is ‘understanding the energy sector’ and least important indicator is ‘influencing environmental policies’.
The capabilities of the regulator that have been rated significantly better than the expected average (i.e. higher than 3), are: (1) understanding the energy sector, (2) clearly defining objects, (3) adapting to changing
circumstances (4) incentivising cost efficiency, (10) creating long-term regulatory commitment and (12) quality of information services and communication. The indicators of capabilities of the regulator that are significantly rated below the expected average (i.e. lower than 3) are: (7) influencing environmental policies and (9)
promoting technological innovation.
The main reason for the low score on influencing environmental policies is the low priority for stimulating renewables and environmental policies for regulators.4
The low score on promoting technological innovation is explained by the respondents as the regulator not having a focus on technological innovation. They also state that there is lack of incentives to innovate, since the payback of investments in new technologies is uncertain. There is ‘no budget allowance for innovation’ and ‘technologies such as smart meters are excluded from the cost-based price structure’.
The overall weighted score for capability of regulators is 3.2, which is significantly higher than the central score of 3.
Due to the limited sample size per individual country, no meaningful statistical comparison between countries can be made. However, when simply looking at the average indicator ratings per country with 3 or more respondents, we see some countries received relatively low ratings (i.e. below 3). The regulator of Spain for instance, was on average rated below 3 on all capability indicators except ‘quality of information services and communication’. The Finnish regulator was the only regulator with a positive rating for influencing
environmental policies.
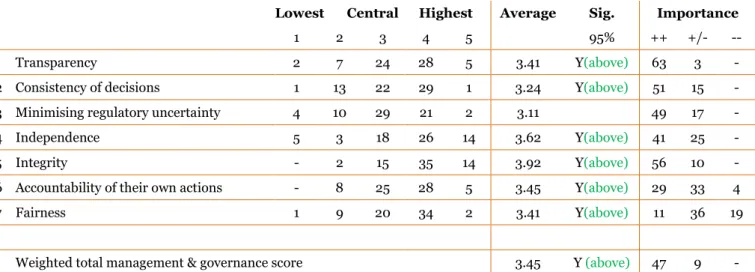
Management & governance
The findings for the indicators relating to management & governance are presented in the table below.
Table 3.10: Scores and importance of management & governance
Lowest Central Highest Average Sig. Importance
1 2 3 4 5 95% ++ +/- --
1 Transparency 2 7 24 28 5 3.41 Y(above) 63 3 - 2 Consistency of decisions 1 13 22 29 1 3.24 Y(above) 51 15 - 3 Minimising regulatory uncertainty 4 10 29 21 2 3.11 49 17 - 4 Independence 5 3 18 26 14 3.62 Y(above) 41 25 - 5 Integrity - 2 15 35 14 3.92 Y(above) 56 10 - 6 Accountability of their own actions - 8 25 28 5 3.45 Y(above) 29 33 4 7 Fairness 1 9 20 34 2 3.41 Y(above) 11 36 19
Weighted total management & governance score 3.45 Y (above) 47 9 -
Source: PwC analysis
Respondents gave the highest average grade to ‘integrity’ (3.9), whereas the lowest score was given to
‘minimising regulatory uncertainty’ (3.0). None of the indicators have on average been rated below the central rate of 3.
4 The Ministry will generally be responsible for setting policies to stimulate renewables. But, the regulator will
All indicators of management & governance have been rated significantly higher than the central rate, except the indicator ‘minimising regulatory uncertainty’.
The total weighted average score for management & governance is a 3.5, and this is significantly higher than the expected average of 3. Thus the management & governance of regulators is overall rated positively.
When analysing average scores per country with 3 or more respondents; the regulator from Spain scores below 3 on all indicators, except the indicator ‘integrity’. Also the Czech regulator is negatively rated on management & governance except for the indicators ‘Independence’, ‘integrity’ and ‘accountability of their own actions’. None of the regulators were negatively rated on ‘integrity’.
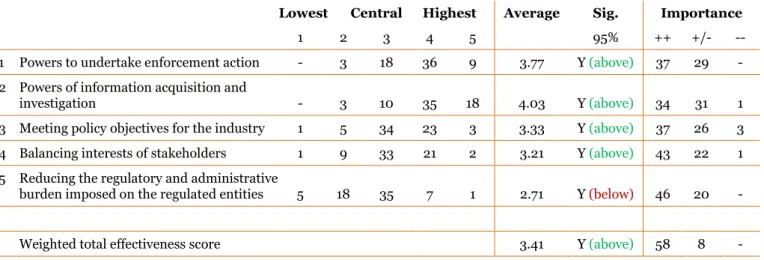
Effectiveness
The findings for the indicators relating to effectiveness are presented in the table below.
Table 3.11: Scores and importance of effectiveness
Lowest Central Highest Average Sig. Importance
1 2 3 4 5 95% ++ +/- --
1 Powers to undertake enforcement action - 3 18 36 9 3.77 Y (above) 37 29 - 2 Powers of information acquisition and
investigation - 3 10 35 18 4.03 Y (above) 34 31 1 3 Meeting policy objectives for the industry 1 5 34 23 3 3.33 Y (above) 37 26 3 4 Balancing interests of stakeholders 1 9 33 21 2 3.21 Y (above) 43 22 1 5 Reducing the regulatory and administrative
burden imposed on the regulated entities 5 18 35 7 1 2.71 Y (below) 46 20 -
Weighted total effectiveness score 3.41 Y (above) 58 8 -
Source: PwC analysis
The weighted average score of effectiveness is significantly higher than the expected average (i.e. above 3) with a rating of 3.4. This implies that effectiveness is overall positively rated.
Respondents gave the highest average grade to ‘powers of information acquisition and investigation’ (4.0), whereas the lowest score is given to ‘reducing the regulatory and administrative burden imposed on the regulated entities’ (2.7).
The regulators have been rated significantly better than the central rate (i.e. higher than 3) on the indicators of: (1) powers to undertake enforcement action, (2) powers of information acquisition and investigation, (3) meeting policy objectives for the industry and (4) balancing interests of stakeholders.
The effectiveness of the regulator in terms of reducing the regulatory and administrative burden imposed on the regulated entities was scored lower than the expected average (i.e. below 3). In general, the respondents see a growing demand for information. Besides, they see a larger effort by the companies themselves than by the regulator to reduce the administrative burden.
When analysing the indicator ratings of countries with a response of 3 or more, we notice that the regulator of Spain is the only regulator that is negatively rated on the weighted total effectiveness score. None of the regulators was rated negatively on powers of information acquisition and investigation. Only the Danish regulator received a positive rating for reducing the regulatory and administrative burden.