UNIVERSITÀ DEGLI STUDI DI SASSARI CORSO DI DOTTORATO DI RICERCA
Scienze Agrarie
Curriculum Agrometeorologia ed Ecofisiologia dei Sistemi Agrari e Forestali
Ciclo XXIX
Anno Accademico 2015 - 2016
A modeling tool to assess local and regional impact of climate
change on crop water requirement in Euro-Mediterranean
Countries, and assessment of Mediterranean irrigated
agriculture vulnerability
dr. Sara Masia
Coordinatore del Corso Prof. Antonello Cannas Referente di Curriculum Prof. Donatella Spano Docente Guida Tutor Co-tutor Dr. Serena Marras Dr. Costantino Sirca Dr. Antonio Trabucco
UNIVERSITÀ DEGLI STUDI DI SASSARI CORSO DI DOTTORATO DI RICERCA
Scienze Agrarie
Curriculum Agrometeorologia ed Ecofisiologia dei Sistemi Agrari e Forestali
Ciclo XXIX
Sara Masia – A modeling tool to assess local and regional impact of climate change on crop water requirement in Euro-Mediterranean Countries, and assessment of Mediterranean irrigated agriculture vulnerability – Tesi di Dottorato in Scienze Agrarie – Curriculum “Agrometeorologia ed Ecofisiologia dei
Sistemi Agrari e Forestali” – Ciclo XXIX – Università degli Studi di Sassari – Anno Accademico 2015 - 2016 La presente tesi è stata prodotta durante la frequenza del corso di
dottorato in Scienze Agrarie dell’Università degli Studi di Sassari, a.a. 2015/2016 - XXIX ciclo, con il sostegno di una borsa di studio cofinanziata con le risorse del P.O.R. SARDEGNA F.S.E. 2007-2013 - Obiettivo competitività regionale e occupazione, Asse IV Capitale umano, Linea di Attività l.3.1 “Finanziamento di corsi di dottorato finalizzati alla formazione di capitale umano altamente specializzato, in particolare per i settori dell’ICT, delle nanotecnologie e delle biotecnologie, dell'energia e dello sviluppo sostenibile, dell'agroalimentare e dei materiali tradizionali”.
La tesi è stata prodotta, altresì, grazie al contributo della Fondazione di Sardegna.
Sara Masia presents her sincere thanks to the Sardinian Regional Government for the financial support of her PhD scholarship (P.O.R. Sardegna F.S.E. Operational Programme of the Autonomous Region of Sardinia, European Social Fund 2007-2013 - Axis IV Human Resources, Objective l.3, Line of Activity l.3.1.).
Sincere thanks also to the Fondazione di Sardegna for the financial contribution.
Sara Masia – A modeling tool to assess local and regional impact of climate change on crop water requirement in Euro-Mediterranean Countries, and assessment of Mediterranean irrigated agriculture vulnerability – Tesi di Dottorato in Scienze Agrarie – Curriculum “Agrometeorologia ed Ecofisiologia dei Sistemi Agrari e Forestali” – Ciclo XXIX – Università degli Studi di Sassari – Anno Accademico 2015 - 2016
Table of Contents
ABSTRACT ... 1
INTRODUCTION ... 4
Impact of climate change in European regions ... 4
Modeling the climate system ... 7
Representative Concentration Pathways (RCPs) climate scenarios ... 9
Agriculture and water resources in the Euro-Mediterranean regions ... 12
The impact of climate change on hydrological cycle ... 16
The impact of climate change on plant physiology ... 17
Evapotranspiration concept ... 19
Methods to compute reference and actual evapotranspiration ... 24
Reference evapotranspiration calculation ... 24
Standardized reference evapotranspiration for short canopies ... 25
Hargreaves - Samani equation ... 30
Actual evapotranspiration calculation ... 30
Indirect methods ... 30
Direct methods ... 32
REFERENCES ... 37
OBJECTIVE ... 46
PART 1. The SIMETAW_R model: evaluation of model performance in estimating crop evapotranspiration and irrigation requirements at local scale 48
1.1 INTRODUCTION ... 48
1.2 MATERIALS AND METHODS ... 50
1.2.1 SWOT analysis ... 50
1.2.2 SIMETAW_R model ... 52
1.2.2.1 Main equations used to estimate crop water consumption and irrigation demand ... 53
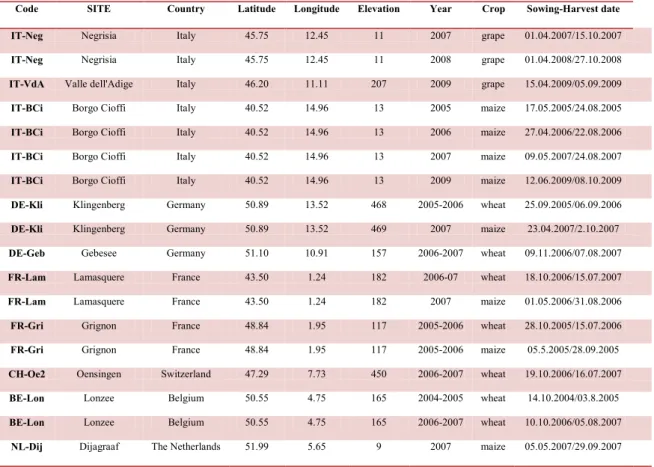
1.2.3 Experimental sites ... 59
1.2.4 Eddy Covariance measurements ... 64
1.2.5 Statistical model validation ... 65
1.3 RESULTS ... 67
Sara Masia – A modeling tool to assess local and regional impact of climate change on crop water requirement in Euro-Mediterranean Countries, and assessment of Mediterranean irrigated agriculture vulnerability – Tesi di Dottorato in Scienze Agrarie – Curriculum “Agrometeorologia ed Ecofisiologia dei Sistemi Agrari e Forestali” – Ciclo XXIX – Università degli Studi di Sassari – Anno Accademico 2015 - 2016
1.3.2 Grignon (FR-Gri) ... 75
1.3.3 Dijgraaf (NL-Dij) ... 82
1.3.4 Oensingen (CH-Oe2) ... 86
1.3.5 Lamasquère (FR-Lam) ... 90
1.3.6 Lonzee (BE-Lon) ... 96
1.3.7 Borgo Cioffi (IT-BCi) ... 101
1.3.8 Negrisia (IT-Neg) ... 107
1.3.9 Valle dell’Adige (IT-VdA)... 113
1.3.10 Gebesee (De-Geb) ... 117
1.4 DISCUSSIONS AND CONCLUSIONS ... 121
REFERENCES ... 123
PART 2. Regional assessment of climate change impact on crop evapotranspiration and irrigation demand in Euro-Mediterranean Countries 133
2.1 INTRODUCTION ... 133
2.2 MATERIALS AND METHODS ... 135
2.2.1 The SIMETAW_GIS platform ... 135
2.2.1.1 Input data ... 137
2.2.2 Data processing and simulations ... 145
2.2.3 Statistical analysis ... 146
2.3 RESULTS ... 147
2.3.1 Regional ETo estimation for past climate conditions... 148
2.3.1.1 Validation of ETo regional estimates ... 153
2.3.2 Regional ETo estimation for future climate conditions ... 158
2.3.3 Impact of climate change on crop evapotranspiration and irrigation demand ... 164
2.3.3.1 Maize ... 164
2.3.3.2 Wheat ... 173
2.3.3.2.1 Irrigated wheat ... 173
2.3.3.2.2 Rainfed wheat ... 181
2.3.3.3 Grape ... 186
2.4 DISCUSSIONS AND CONCLUSIONS ... 195
REFERENCES ... 201
PART 3. Vulnerability assessment of Euro-Mediterranean irrigated agriculture under climate change 210
Sara Masia – A modeling tool to assess local and regional impact of climate change on crop water requirement in Euro-Mediterranean Countries, and assessment of Mediterranean irrigated agriculture vulnerability – Tesi di Dottorato in Scienze Agrarie – Curriculum “Agrometeorologia ed Ecofisiologia dei Sistemi Agrari e Forestali” – Ciclo XXIX – Università degli Studi di Sassari – Anno Accademico 2015 - 2016
3.1 INTRODUCTION ... 210
3.2 MATERIALS AND METHODS ... 213
3.2.1 Study domain ... 213
3.2.2. Climate database ... 213
3.2.3 Principal dams for irrigation use over the Euro-Mediterranean domain ... 214
3.2.3.1 Dam (GranD) database ... 214
3.2.3.2 Main reservoir systems used for irrigation over the Euro-Mediterranean domain ... 215
3.2.4 Physical characteristics of the reservoir systems - Aridity index ... 216
3.2.5 Reservoirs upstream basin area and change of runoff flow in the reservoirs ... 218
3.2.5.1 Reservoirs upstream basin area ... 219
3.2.6 Runoff coefficient ... 221
3.2.7 Irrigation requirements ... 223
3.2.8 Irrigation systems vulnerability indicator: ... 224
3.3 RESULTS ... 226
3.3.1 Stretta di Calamaiu ... 227
3.3.2 Cuga and Alto Temo ... 231
3.3.3 Monte Pranu ... 235
3.3.4 Rosamarina ... 238
3.3.5 San Giuliano ... 241
3.4 DISCUSSIONS AND CONCLUSIONS ... 245
REFERENCES ... 248
ACKNOWLEDGMENTS ... 256
APPENDIX 1 ... 259
1
Sara Masia – A modeling tool to assess local and regional impact of climate change on crop water requirement in Euro-Mediterranean Countries, and assessment of Mediterranean irrigated agriculture vulnerability – Tesi di Dottorato in Scienze Agrarie – Curriculum “Agrometeorologia ed Ecofisiologia dei Sistemi Agrari e Forestali” – Ciclo XXIX – Università degli Studi di Sassari – Anno Accademico 2015 - 2016
ABSTRACT
Climate change is recognized to have a strong impact on water availability, especially in the Mediterranean areas, by enhancing drought conditions and water scarcity issues. The availability of water is crucial in the agriculture sector and affects crop growth and yield. Irrigation practices are then quite diffuse for sustaining crop production, so the assessment of crop water requirement becomes extremely important. In addition, to cope with the changing crop water needs due to global warming, strategies to find the best balance between water application and crop yield need to be developed.
This work aims to develop a tool able to estimate crop water consumption and irrigation requirement for economically relevant crops, at local and regional scale, for both actual and future climate conditions. Specifically, the developed tool will allow to quantify, per each crop and per each crop growth stage, the amount of water effectively consumed by plants and the irrigation volumes and scheduling. Based on that, this work aims to evaluate the impact of climate change on future water needs for three crops (maize, wheat, and grape) at Euro-Mediterranean basin scale. In addition, the vulnerability of Mediterranean irrigated agriculture is investigated.
The Simulation of Evapotranspiration of Applied Water model was selected and converted in a R programming language, and implemented in R platform (SIMETAW_R) to estimate crop irrigation requirements at different scales, and with large dataset generated by climate models. The new tool, originally developed to work at farm level, was included into a GIS platform under R, named SIMETAW_GIS, fully developed in this work, which could process geospatial environmental data and reiterate simulations over regional scale.
This work is organized in different sections: an introductive part and three chapters. The introductive part would aim to briefly introduce climate changes issues, their implication for agriculture, and to describe the main concepts related to the estimation of crop water consumption.
The first chapter aims at identifying and evaluating the flexible tool needed to estimate crop water needs. It then describes the improvement made on the Simulation of Evapotranspiration of Applied Water (SIMETAW_R) model, and evaluates its
2
Sara Masia – A modeling tool to assess local and regional impact of climate change on crop water requirement in Euro-Mediterranean Countries, and assessment of Mediterranean irrigated agriculture vulnerability – Tesi di Dottorato in Scienze Agrarie – Curriculum “Agrometeorologia ed Ecofisiologia dei Sistemi Agrari e Forestali” – Ciclo XXIX – Università degli Studi di Sassari – Anno Accademico 2015 - 2016
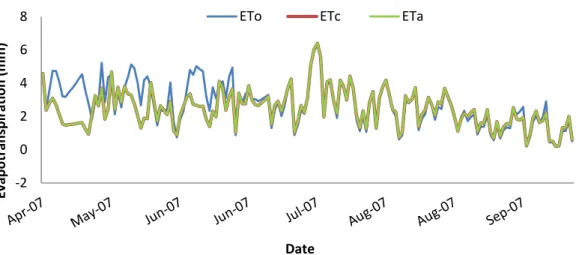
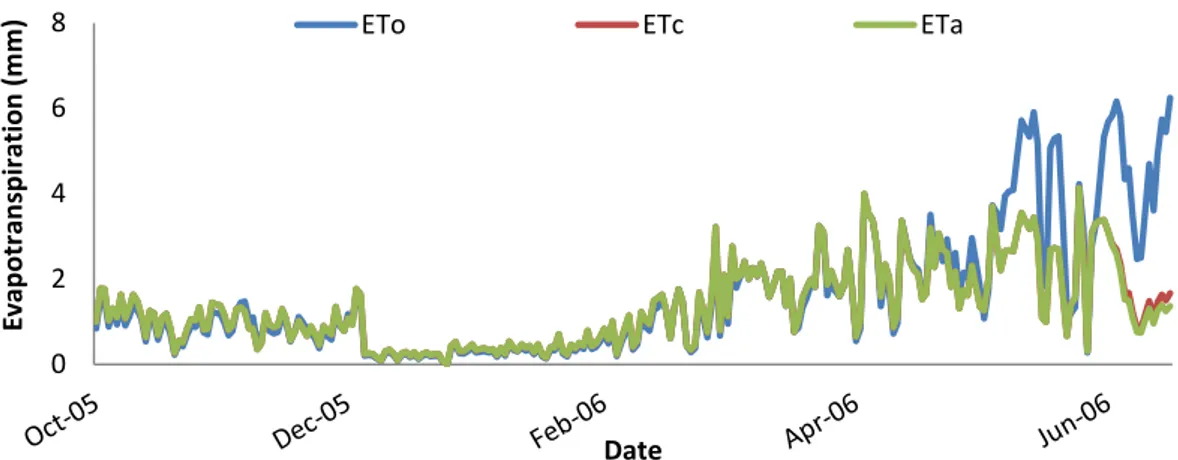
performance in estimating crop evapotranspiration and irrigation requirement at local scale and under several pedo-climatic conditions. SIMETAW_R model was applied in 10 European sites selected through the international FLUXNET network. Model estimates of actual evapotranspiration (ETa) where validated through the comparison with ETa values directly measured by Eddy Covariance stations at each site. In addition, the performance of the Hargreaves-Samani and standardized Penman-Monteith equations were assessed in order to identify the one more accurate in estimating reference evapotranspiration with the available input, that was then selected to be used for the estimation of crop and actual evapotranspiration.
The second chapter illustrates the development and the application of SIMETAW_GIS as a tool to simulate crop water use and water application at regional scale. The analysis was conducted for past climate conditions (1976-2005) and under future climate (2036-2065) by using two Representative Concentration Pathway scenarios, RCP 4.5 and 8.5. The analysis allowed to estimate the impact of climate change on crop water needs per each Euro-Mediterranean Country of the domain under investigation.
SIMETAW_R and its platform SIMETAW_GIS allow to compute the daily soil water balance, reference, crop, and actual evapotranspiration, as well as the evapotranspiration of applied water, i.e. the total amount of water applied per each event. The model schedules also the number of irrigation events.
Finally, the third chapter indicates the assessment of the irrigation supply vulnerabilities for specific watersheds in the Euro-Mediterranean basin including the changes of irrigation requirements and of water availability into dams as a result of climate change, and the study of potential future conflicts among sectors in the use of water resources. Results showed higher values of reference, crop, and actual evapotranspiration, as well as irrigation requirement, under future climate conditions, and differences were often greater under RCP 4.5 than 8.5 scenario. The impact of global warming on maize, grape, and wheat water consumption and irrigation was more severe in Mediterranean Countries, already affected by water scarcity. In term of yield losses, the best response to future increasing CO2 concentration in the atmosphere was given by wheat and grape
(C3 crops).
The new SIMETAW_R model outcomes at local scale, as well as the SIMETAW_GIS platform gridded outcomes at regional scale may be useful to increase awareness on
3
Sara Masia – A modeling tool to assess local and regional impact of climate change on crop water requirement in Euro-Mediterranean Countries, and assessment of Mediterranean irrigated agriculture vulnerability – Tesi di Dottorato in Scienze Agrarie – Curriculum “Agrometeorologia ed Ecofisiologia dei Sistemi Agrari e Forestali” – Ciclo XXIX – Università degli Studi di Sassari – Anno Accademico 2015 - 2016
climate change impact in Euro-Mediterranean regions, thus to address farmers, decision makers, and politicians in developing sustainable strategies in agriculture target to better manage water resource.
4
Sara Masia – A modeling tool to assess local and regional impact of climate change on crop water requirement in Euro-Mediterranean Countries, and assessment of Mediterranean irrigated agriculture vulnerability – Tesi di Dottorato in Scienze Agrarie – Curriculum “Agrometeorologia ed Ecofisiologia dei Sistemi Agrari e Forestali” – Ciclo XXIX – Università degli Studi di Sassari – Anno Accademico 2015 - 2016
INTRODUCTION
Impact of climate change in European regions
According to the Intergovernmental Panel on Climate Change (IPCC), “Climate change refers to a change in the state of the climate that can be identified (e.g., by using statistical tests) by changes in the mean and/or the variability of its properties, and that persists for an extended period, typically decades or longer. Climate change may be due to natural internal processes or external forcings such as modulations of the solar cycles, volcanic eruptions, and persistent anthropogenic changes in the composition of the atmosphere or in land use. Note that the Framework Convention on Climate Change (UNFCCC), in its Article 1, defines climate change as: ‘a change of climate which is attributed directly or indirectly to human activity that alters the composition of the global atmosphere and which is in addition to natural climate variability observed over comparable time periods’. The UNFCCC thus makes a distinction between climate change attributable to human activities altering the atmospheric composition, and climate variability attributable to natural causes.” (IPCC, 2014).
Climate is a very complex system characterized by the interactions among factors such as vegetation, oceans, atmosphere, and so on. This system is prone to natural or anthropogenic changes, and depend on space and time scale. One of the main cause of global warming is the constant increasing concentration of the anthropogenic greenhouse gas emissions (GHGs) in the atmosphere since the pre-industrial revolution (IPCC, 2014).
Climate change is one of the most important challenge for our society in the 21st century. According to the Fifth Assessment Report of the IPCC this challenge is expected to worsen in the next few decades due to the quick demographic growth, the socio-economic development, the increasing demand of raw materials and energy, the extension of residential centres, as well as the improvement of quality of life.
The quick increasing temperature from 2005 onward is related to the increasing concentration of GHGs in the atmosphere (Collins et al., 2013). The contribution of each GHG emission to the long-term future radiative forcing, and projections of global
5
Sara Masia – A modeling tool to assess local and regional impact of climate change on crop water requirement in Euro-Mediterranean Countries, and assessment of Mediterranean irrigated agriculture vulnerability – Tesi di Dottorato in Scienze Agrarie – Curriculum “Agrometeorologia ed Ecofisiologia dei Sistemi Agrari e Forestali” – Ciclo XXIX – Università degli Studi di Sassari – Anno Accademico 2015 - 2016
surface temperature change, for each Representative Concentration Pathway scenario (RCP), obtained through a models ensemble, is shown in Figure 1a and 1b.
Fig. 1a. Changes of global annual mean surface temperature (°C) from 1980 to 2300. Fig. 1b. Percentage of the contribution of each GHGs expressed considering each RCP used in CMIP5. CO2 is the Carbon dioxide, CH4 the methane, N2O the nitrous oxide, O3 the ozone, and LU the
land use from 2010 to 2100 (Collins et al., 2013).
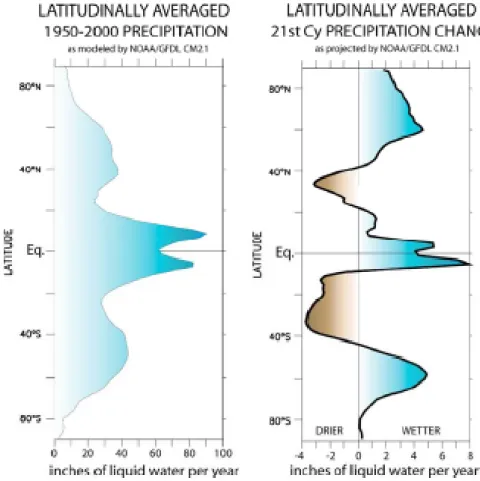
In parallel with increasing temperature, saturation vapor pressure is also expected to increase. In addition, strong changes in water cycle are expected, but these are more difficult to characterize, because of the random patterns that precipitation events can assume. According to the phrase, “the wet get wetter and the dry get drier”, rainfall is projected to increase in fact in the already wet areas near the equator, and to decrease in
1b 1a
6
Sara Masia – A modeling tool to assess local and regional impact of climate change on crop water requirement in Euro-Mediterranean Countries, and assessment of Mediterranean irrigated agriculture vulnerability – Tesi di Dottorato in Scienze Agrarie – Curriculum “Agrometeorologia ed Ecofisiologia dei Sistemi Agrari e Forestali” – Ciclo XXIX – Università degli Studi di Sassari – Anno Accademico 2015 - 2016
areas already characterized by low precipitation as the subtropical one, particularly under RCP 8.5 (IPCC, 2013). This fact happens because the water vapor is constantly transported from subtropics (around 20° to 40° latitude in both Hemispheres) to the higher latitude (50 and 70° latitude in the Northen and Southern Hemisphers), thus as a consequence of the increasing temperature, the amount of water vapor which moves from subtropic to subpolar region will be higher (Held and Vecchi, 2008) (Figure 2).
Fig. 2. Latitudinally averaged precipitation simulated by the GFLD CM2.1 model over the period 1951-2000 and 2081-2100 (Held and Vecchi, 2008).
The impact of climate change (CC) in Europe is different from region to region, and it is strictly dependent on social, economic, climatic, and geographic factors (Figure 3). Since future projections indicate large impact over different sectors across Europe, the European Countries decided to adopt a medium-term strategies which aims at a more sustainable economy to cope with climate changes. The European 2020 strategy aims to reduce the GHGs concentration in the atmosphere by 20%, in comparison to 1990 level,
7
Sara Masia – A modeling tool to assess local and regional impact of climate change on crop water requirement in Euro-Mediterranean Countries, and assessment of Mediterranean irrigated agriculture vulnerability – Tesi di Dottorato in Scienze Agrarie – Curriculum “Agrometeorologia ed Ecofisiologia dei Sistemi Agrari e Forestali” – Ciclo XXIX – Università degli Studi di Sassari – Anno Accademico 2015 - 2016
to reach 20% energy dependencies by renewable sources, and to increase the energy efficiency up to 20% (EEA, 2015).
Fig. 3. Impact of climate change in Europen regions (EEA, 2017).
Modeling the climate system
Physics and mathematics are the bases of climate models, which are able to represent future climate conditions with a range of confidence that is higher for certain variables such as temperature and lower for others as precipitation. The confidence of climate model outcomes is measured also by their ability in reproducing past climate change and observed climate (Randall et al., 2007). Although models are simplification of the reality, they are essential to predict future impacts, and to assess adaptation and mitigation strategies.
8
Sara Masia – A modeling tool to assess local and regional impact of climate change on crop water requirement in Euro-Mediterranean Countries, and assessment of Mediterranean irrigated agriculture vulnerability – Tesi di Dottorato in Scienze Agrarie – Curriculum “Agrometeorologia ed Ecofisiologia dei Sistemi Agrari e Forestali” – Ciclo XXIX – Università degli Studi di Sassari – Anno Accademico 2015 - 2016
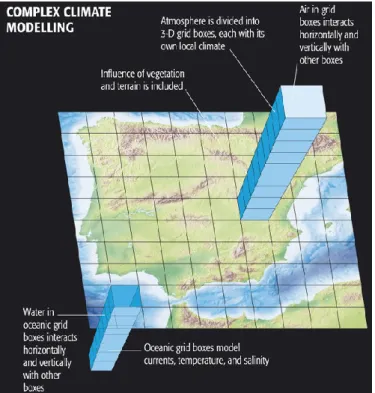
Global Climate Models (GCMs) are used to reproduce the climate system at global scale, thus all the interactions among changes in GHGs concentration, land surface, sea level, and so on. They are built to reconstruct and simulate the main Earth’s system components using a three dimensional grid (Figure 4).
Fig. 4. General scheme of the complex, gridded Global Climate Model.
Atmosphere, land and oceans are divided in small grids evaluating the interactions with the surrounding grid boxes. Any variable, such as humidity, temperature, and cloud coverage, is considered uniform for the entire cell.
Although the spatial GCMs resolution has increased from 1990 (around 500 km, 1st Assessment Report) until 2010 (around 80 km, 5th Assessment Report) (IPCC, 2013), a downscaling technique is needed to reproduce the climate system at regional scale and at higher resolution. The downscaling process (Figure 5a and 5b) provides an increase of GCM spatial resolution (around 25 km), thus more detailed features (e.g. topography) in the studied domain.
9
Sara Masia – A modeling tool to assess local and regional impact of climate change on crop water requirement in Euro-Mediterranean Countries, and assessment of Mediterranean irrigated agriculture vulnerability – Tesi di Dottorato in Scienze Agrarie – Curriculum “Agrometeorologia ed Ecofisiologia dei Sistemi Agrari e Forestali” – Ciclo XXIX – Università degli Studi di Sassari – Anno Accademico 2015 - 2016
Fig. 5a. Scheme of downscaling from Global Climate Model (GCM) to Regional Climate Model (RCM) (Giorgi., 2008).
Fig. 5b. Downscaling process of future climate scenarios (http://www.slideshare.net/GRFDavos/bonn-lr).
Representative Concentration Pathways (RCPs) climate scenarios
One of the main cause of climate change is the increase of natural or anthropogenic emissions of greenhouse gases in the atmosphere. According to the last report of the European Environmental Agency (2009), the CO2 concentration in the atmosphereincreased up to 400 parts per million (ppm) in 2016, specifically compared to the the pre-industrial revolution, the level was about 40% higher.
10
Sara Masia – A modeling tool to assess local and regional impact of climate change on crop water requirement in Euro-Mediterranean Countries, and assessment of Mediterranean irrigated agriculture vulnerability – Tesi di Dottorato in Scienze Agrarie – Curriculum “Agrometeorologia ed Ecofisiologia dei Sistemi Agrari e Forestali” – Ciclo XXIX – Università degli Studi di Sassari – Anno Accademico 2015 - 2016
It is stated that there is a direct relationship between air temperature and the variation of GHGs concentrations (IPCC, 2007; Lüthi et al., 2008) (Figure 6).
Fig. 6. Direct relationship between air temperature (red line) and carbon dioxide (blue line) (from www.riscaldamentoglobale.it).
According to the IPCC, the GHGs emissions are constantly increasing, leading to a continuous raise in surface temperature. At global level, according to Hartmann et al. (2013), the mean surface temperature is increase with a range of 0.49 °C to 0.89 °C, with an average of 0.72 °C, in the period from 1951 to 2012. Despite the huge number of policies developed in order to mitigate climate change, 2014 and 2015 were the warmest years in the last decades (ISPRA, 2016). According to the IPCC scenarios, without mitigation policies the mean surface temperature will rise up to 3.7 – 4.8 °C by 2100 compared to the pre-industrial time (IPCC, 2014).
Since climate is influenced by the concentration of GHG, the research and definition of climate change needs to consider plausible scenarios of GHG emissions. At the moment, four Representative Concentration Pathways (RCPs) are mostly taken as reference (Figure 7), considering their total radiative forcing (W m-2) pathway (trajectories over time), i.e. the total amount of GHGs emissions due to human activities until 2100. RCPs scenarios are useful frameworks for the scientific community to describe the influence of anthropogenic emissions on future climate (http://sedac.ipcc-data.org/ddc/ar5_scenario_process/RCPs.html). The radiative forcing ranges from 2.6 to 8.5 W m-2, and are considered rather “representative” because each of them refers to a substantial large number of scenarios available in literature. The definition “concentration pathways” is used to underline that they are sets of future projections of the radiative forcing components (van Vuuren et al., 2011).
11
Sara Masia – A modeling tool to assess local and regional impact of climate change on crop water requirement in Euro-Mediterranean Countries, and assessment of Mediterranean irrigated agriculture vulnerability – Tesi di Dottorato in Scienze Agrarie – Curriculum “Agrometeorologia ed Ecofisiologia dei Sistemi Agrari e Forestali” – Ciclo XXIX – Università degli Studi di Sassari – Anno Accademico 2015 - 2016
Fig. 7. Cumulative total anthropogenic CO2 emissions and temperature anomalies (IPCC,
2013).
A brief description of the sets of RCPs and their main features is reported in Table 1.
Tab. 1. Description of the four Representative Concentration Pathways Scenarios and their main characteristics. IA model=Integration Assessment Model
(modified from http://sedac.ipcc-data.org/ddc/ar5_scenario_process/RCPs.html and van Vuuren et al. (2011)).
Scenario components
Description IA Model Publication – IA
Model Greenhouse gas emissions Agricultural area Air pollution RCP8.5
Rising radiative forcing pathway leading to 8.5 W/m2 (~ 1370 ppm CO 2 eq) by 2100. MESSAGE Riahi et al. (2007) Rao & Riahi
(2006) High baseline Medium for both cropland and pasture Medium-high RCP6 Stabilization without overshoot pathway to 6 W/m2 (~ 850 ppm CO 2
eq) at stabilization after 2100
AIM
Fujino et al. (2006) Hijioka et al.
(2008) Medium baseline; high mitigation
Medium for cropland but very low for pasture (total low) Medium RCP4.5 Stabilization without overshoot pathway to 4.5 W/m2 (~ 650 ppm CO 2
eq) at stabilization after 2100 GCAM Smith and Wigley (2006) Clarke et al. (2007) Wise et al. (2009) Medium-low mitigation Very low baseline
Very low for both cropland and
pasture
Medium
RCP2.6 Peak in radiative forcing
at ~ 3 W/m2 (~ 490 ppm
CO2 eq) before 2100 and
then decline
IMAGE
van Vuuren et al. (2006 and 2007) Very low Medium for cropland and pasture Medium-low
12
Sara Masia – A modeling tool to assess local and regional impact of climate change on crop water requirement in Euro-Mediterranean Countries, and assessment of Mediterranean irrigated agriculture vulnerability – Tesi di Dottorato in Scienze Agrarie – Curriculum “Agrometeorologia ed Ecofisiologia dei Sistemi Agrari e Forestali” – Ciclo XXIX – Università degli Studi di Sassari – Anno Accademico 2015 - 2016
RCPs are expected to be used as input for climate models and mitigation analysis, as well as for the assessment of climate change impact.
Agriculture and water resources in the Euro-Mediterranean
regions
Agriculture is a sector with large relevance for water needs, and definitively the most responsible for water use in semi arid areas like southern Europe and Mediterranean areas. Around 2010, the mean total water withdrawal for agriculture, which includes irrigation, livestock, and aquaculture, is accounted for about 25% at European level (Figure 8a), where the percentage accounted for in Western and Central Europe (27%) is higher than the one estimated in Eastern Europe (21%). The 57% (Figure 8b) of the total water use is estimated in Mediterranean Countries. In Northern Africa the percentage of water withdrawal for agricultural use is about the 84% (Figure 8c) (http://www.fao.org/nr/water/aquastat/tables/WorldData-Withdrawal_eng.pdf).
Fig. 8a, 8b, and 8c. Mean total percentage of water withdrawal by sector in Europe, Mediterranean Countries, and North Africa, respectively, around 2010.
(http://www.fao.org/nr/water/aquastat/tables/WorldData-Withdrawal_eng.pdf).
21% 54% 25%
Europe
Municipal Industrial Agricutural
57% 25%
18%
Mediterranean Europe
Municipal Industrial Agricultural
Municipal 13% Industrial 3% Agricutural 84% North Africa 8a 8b 8c
13
Sara Masia – A modeling tool to assess local and regional impact of climate change on crop water requirement in Euro-Mediterranean Countries, and assessment of Mediterranean irrigated agriculture vulnerability – Tesi di Dottorato in Scienze Agrarie – Curriculum “Agrometeorologia ed Ecofisiologia dei Sistemi Agrari e Forestali” – Ciclo XXIX – Università degli Studi di Sassari – Anno Accademico 2015 - 2016
The recently increasing temperature associated with decreasing precipitation result in a limited water availability in the Southern regions, where irrigation is an essential practice for agricultural production. In the Northern areas, most of the water resources is used for livestock, while in the Southern arid and semi-arid areas, with particular attention to the Mediterranean regions, it is used for irrigation (EEA, 2009).
The highest percentage (around 60%) of the total freshwater abstraction used for irrigation is in fact accounted for in Southern and Southern East Europe
(http://ec.europa.eu/eurostat/statistics-explained/index.php/Agri-environmental_indicator_-_water_abstraction). A brief overview of the agricultural areas and water resources in Euro-Mediterranean Countries is presented in this section. The cultivated area, the total area equipped for irrigation (Figure 9a), and specifically the area actually irrigated, the irrigation water withdrawal (Figure 9b), the total harvested irrigated area, as well as the total area equipped for surface irrigation, sprinkler and localized irrigation are reported in Table 2 for European Countries and in Table 3 for the Mediterranean Countries.
Tab. 2. Cultivated area, total area equipped for irrigation, area actually irrigated, irrigation water withdrawal, total harvested irrigated area, and total area equipped for surface irrigation, sprinkler and localized irrigation in European Countries. Areas are expressed in ha (x 1000), and water abstraction in 10^9 m3 yr-1
(http://www.fao.org/nr/water/aquastat/data/query/index.html?lang=en). Cultivated area (1000 ha) Area equipped for full control irrigation (1000 ha) Area equipped for irrigation: actually irrigated (1000 ha) Irrigation water withdrawal (10^9 m3 yr -1) Total harvested irrigated crop area (1000 ha) Area equipped for surface irrigation (1000 ha) Area equipped for sprinkler irrigation (1000 ha) Area equipped for localized irrigation (1000 ha) Austria 1417 (2014) 119.80 (2013) 51.68 (2013) 0.01 (2010) 43.40 (2008) 131 (1993) Belgium 839.30 (2014) 19.18 (2013) 5.74 (2013) 5.70 (2008) Bulgaria 3613 (2014) 115.50 (2013) 40.51 (2011) 0.31 (2011) 72.64 (2008) 80.60 (2007) 21 (2007) 3 (2007) Czechia 3219 (2014) (2013) 34.07 (2013) 17.84 (2013) 0.01 (2007) 19.91 (2007) 22.53 (2007) 11 5 (2007) Denmark 2436 (2014) 439 (2013) 242 (2013) 0.09 (2012) 254.10 (2008) Estonia 654.30 (2014) 0.45 (2010) 0.32 (2010) 0 (2010) 0.32 (2010) 3.68 (1995) Finland 2234 (2014) 102.10 (2013) (2010) 15.02 (2005) 0.04 (2010) 15.02 (2010) 58.78 9.80 (2010) Germany 12074 (2014) 639 (2010) 372.80 (2010) 0.17 (2010) 234.60 (2006) 10.70 (2006) 500 (2006) 5 (2006) Ireland 1059 (2014) 1.10 (1998) 1.10 (1998) 0.003 (1998) 1.10 (1998) 60 (2000) Latvia 1215 (2014) 0.63 (2013) 0.41 (2013) 0.62 (2007) Lithuania 2384 4.44 1.60 0 1.53 9.24
14
Sara Masia – A modeling tool to assess local and regional impact of climate change on crop water requirement in Euro-Mediterranean Countries, and assessment of Mediterranean irrigated agriculture vulnerability – Tesi di Dottorato in Scienze Agrarie – Curriculum “Agrometeorologia ed Ecofisiologia dei Sistemi Agrari e Forestali” – Ciclo XXIX – Università degli Studi di Sassari – Anno Accademico 2015 - 2016
(2014) (2012) (2013) (2011) (2010) (1995) Luxembourg 64.16 (2014) (2007) 0 (2013) 0 Hungary 4585 (2014) 184.8 (2014) 99.32 (2014) 0.23 (2013) 87.62 (2008) 18.9 (2007) 118 (2007) 4 (2007) Netherlands 1081 (2014) 499.40 (2013) 101.80 (2013) 0.02 (2012) 202.30 (2008) Norway 811.10 (2014) (2013) 88.91 (2013) 19.45 (2006) 0.11 55 (2007) Poland 11304 (2014) 75.81 (2013) 45.55 (2013) 0.08 (2012) 72.06 (2007) 102.70 (2007) 5 (2007) 8 (2007) Portugal 1885 (2014) 583.70 (2007) 421.50 2007) 3.76 (2009) 421.50 (2008) 40 (1999) 25 (1999) Romania 9203 (2014) 230.40 (2013) 152.80 (2013) 0.34 (2013) 173.40 (2008) 448 (2003) 4 (2003) Serbia 2794 (2014) 91.96 (2011) 34.17 (2011) 0.08 (2013) 34.17 (2011) Slovakia 1413 (2014) 99.64 (2013) 24.60 (2013) 0.01 (2014) 39.09 (2008) Sweden 2597 (2014) 155.50 (2013) 51.87 (2013) 0.06 (2010) 54.17 (2007) Switzerland 425.70 (2014) 61 (2010) 36.18 (2010) 0.13 (2012) 36.18 (2010) Macedonia 452 (2014) 127.80 (2004) 79.64 (2007) 0.15 (2013) 79.64 (2007) United Kingdom 6279 (2014) 228 (2005) 49.13 (2013) 0.04 (2012) 138.20 (2007) 117 (2005) 105 (2005) 6 (2005)
Tab. 3. Cultivated area, total area equipped for irrigation, and specifically the area actually irrigated, irrigation water withdrawal, total harvested irrigated area, and total area equipped for surface irrigation, sprinkler and localized irrigation for Mediterranean Countries. Areas are expressed in ha (x 1000) and water abstraction in 10^9 m3 yr-1
(http://www.fao.org/nr/water/aquastat/data/query/index.html?lang=en). Cultivat ed area (1000 ha) Area equipped for irrigation (1000 ha) Area equipped for irrigatio n: actually irrigated (1000 ha) Irrigatio n water withdra wal (10^9 m3 yr-1) Total harvest ed irrigate d crop area (1000 ha) Area equipped for surface irrigatio n (1000 ha) Area equipped for sprinkler irrigation (1000 ha) Area equipped for localized irrigation (1000 ha) Albania 696 (2014) 337.60 (2013) 205.30 (2013) 0.51 (2006) 102.70 (2006) Algeria 8439 (2014) (2012) 1177 (2012) 1012 (2001) 3.50 858.20 (2008) 686.90 (2012) (2012) 270 (2012) 220 Bosnia and Herzegovina 1117 (2014) 3 (2000) Croatia 890.80 (2014) 25.87 (2013) 13.43 (2013) 0.01 (2010) 4.86 (2002) 0.25 (2002) 0.01 (2002) Cyprus 106.30 (2014) 39.54 (1994) 0.16 (2013) 31.26 (2008) 35.59 (1994) Egypt 3745 (2014) 3610 (2010) 6333 (2010) 2730 (2010) 410 (2010) 470 (2010) France 19328 (2014) 2811 (2013) 1424 (2013) 3.14 (2009) 1512 (2008) 115 (2007) 2420 (2007) 107.50 (2007) Greece 3725 (2014) 1517 (2013) 1165 (2013) 7.86 (2011) 1280 (2008) Israel 397.70 (2014) 225 (2004) 181.50 (2006) 183.60 (2006) 168.80 (2004) Italy 9121 (2014) 4004 (2013) 2866 (2013) 12.89 (2007) 2666 (2008) 2399 (2007) 981.20 (2007) 570.60 (2007) Lebanon 258 (2014) 104 (1998) 90 (1998) 105.30 (2003) 66.13 (1998) 29.04 (1998) 8.83 (1998) Libya 2050 (2014) (2008) 400 (2008) 335 (2000) 406 Malta 10.23 4.20 3.66 0.02 2.81
15
Sara Masia – A modeling tool to assess local and regional impact of climate change on crop water requirement in Euro-Mediterranean Countries, and assessment of Mediterranean irrigated agriculture vulnerability – Tesi di Dottorato in Scienze Agrarie – Curriculum “Agrometeorologia ed Ecofisiologia dei Sistemi Agrari e Forestali” – Ciclo XXIX – Università degli Studi di Sassari – Anno Accademico 2015 - 2016
(2014) (2013) (2013) (2013) (2008) Montenegro 13.74 (2014) (2010) 2.41 (2010) 2.41 (2010) 2.41 (2010) 0 (2010) 0.90 (2010) 1.50 Morocco 9592 (2014) 1458 (2011) 1341 (2012) 1711 (2011) 1044 (2011) 125.80 (2011) 288.2 (2011) Slovenia 237.30 (2014) 7.60 (2010) 3.50 (2010) 0.003 (2013) 3.50 (2010) 5.26 (2010) 2.33 (2010) Spain 17188 (2014) (2012) 3923 (2012) 3504 (2012) 23.37 (2009) 3093 Syria 5733 (2014) 1341 (2010) 1210 (2000) 1334 (2000) 1043 (2010) 187.10 (2010) 110.90 (2010) Tunisia 5232 (2014) 459.60 (2012) 380 (2011) 419 (2011) 189.40 (2012) 115.20 (2012) 155 (2012) Turkey 23944 (2014) 5340 (2012) 4206 (2004) 4206 (2004) 4690 (2012) 500 (2012) 150 (2012)
The cultivated area, given by the sum of arable lands and permanent crops, is estimated higher than 8 million hectares in Algeria, France, Germany, Morocco, Polonia, Italy, Romania, Spain, and Turkey. It is worth noting that the areas equipped for full control irrigation are higher than the ones actually irrigated in all Euro-Mediterranean Countries. Most of the areas equipped for irrigation and actually irrigated are in the Mediterranean basin, in particular areas larger than 1 million hectares are located in Algeria, France, Greece, Italy, Morocco, Spain, Syria, and Turkey. The highest values ( > 3 x 10^9 m3 yr-1 ) of annual water withdrawal for irrigation are in general always in correspondence with the largest cultivated and irrigated areas. Southern regions are also accounted for the highest total harvested irrigated crop lands. Egypt, Italy, Syria, Turkey, and Morocco are the Countries where surface irrigation is mainly used. More than 500,000 ha are irrigated using sprinkler system in France, Germany, Italy, and Turkey. In addition, land irrigated using localized irrigation are also located in Mediterranean basin where the total hectares were higher than 100,000 in most of the Countries.
Total harvested irrigated crop area refers to specific crops irrigated for their entire growing season. Since the same area may be under double irrigated cropping, it could be counted twice, hence the total harvested irrigated crop area may be larger than the area equipped for full control irrigation (Egypt, Lebanon, Libya, and Morocco). It is evident that, in the wet Northern-East Countries such as Austria, Bulgaria, Czechia, Denmark, Finland, Germany, Lithuania, Netherlands, Norway, Romania, Slovakia, Sweden, Switzerland, and United Kingdom, despite the large areas equipped for irrigation, the harvested irrigated crop lands are lower.
16
Sara Masia – A modeling tool to assess local and regional impact of climate change on crop water requirement in Euro-Mediterranean Countries, and assessment of Mediterranean irrigated agriculture vulnerability – Tesi di Dottorato in Scienze Agrarie – Curriculum “Agrometeorologia ed Ecofisiologia dei Sistemi Agrari e Forestali” – Ciclo XXIX – Università degli Studi di Sassari – Anno Accademico 2015 - 2016
Fig. 9a. Total area equipped for irrigation expressed in ha (1000 ha) (http://www.fao.org/nr/water/aquastat/maps/EqIrr_eng.pdf). Fig. 9b. Percentage of total water withdrawal abstracted for agriculture in Euro-Mediterranean Countries (http://www.fao.org/nr/water/aquastat/maps/WithA.WithT_eng.pdf).
Due to the water losses in the supply system, the abstraction rates is generally higher than the water demand (OECD, 2006). In order to solve this issue, strategies to improve water efficiency are necessary to develop a more sustainable agriculture in particular in areas already affected by water scarcity.
The impact of climate change on hydrological cycle
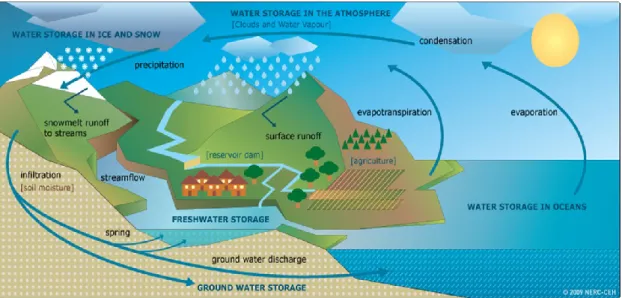
The hydrological cycle is a natural process characterized by a constant movement of water on, above, and below the Earth surface (Figure 10). The sun drives the changes of water state between ice, liquid, and vapor through physical processes. Water moves from liquid to vapor through the processes of 1) evaporation from water bodies and soil, and 2) transpiration from plants. Water vapor moves to the atmosphere where it is stored in clouds. Water changes its state from vapor to liquid or solid through the process of condensation, and falls to the surface where it returns naturally as rainfall or snowfall to the surface (Trenberth et al., 2006).
17
Sara Masia – A modeling tool to assess local and regional impact of climate change on crop water requirement in Euro-Mediterranean Countries, and assessment of Mediterranean irrigated agriculture vulnerability – Tesi di Dottorato in Scienze Agrarie – Curriculum “Agrometeorologia ed Ecofisiologia dei Sistemi Agrari e Forestali” – Ciclo XXIX – Università degli Studi di Sassari – Anno Accademico 2015 - 2016
Fig. 10. The hydrological cycle. Movement of water molecules through physical processes in the Earth system.
It is widely known that the physical processes involved in the water cycle are influenced by climate and its changes. One of the most serious consequences of the increasing concentrations of GHGs in the atmosphere may be a variation of the water amount and distribution in the Earth system. The impact of climate change on water resources is expected to be exacerbated by the end of the current century creating several areas characterized by perennial droughts and others by frequent floods (Graham et al., 2010). Christensen et al. (2007) stated that there will be no uniform changes in global water cycle. Climate models foresee an increase of annual precipitation in Northern Europe and a decrease in Southern Europe. In central Europe and in Mediterranean areas a reduction of the number of rainy days, with a high risk of consequently drought summer, is expected in the next few years (IPCC, 2013). Water availability is predicted to be increasingly scarcer worldwide, and this trend will be exacerbated not only by climate change conditions but also by the quick and significant population growth, the socio-economic development, the increasing demand for raw materials, as well as changes in lifestyle. The reduction of available water may trigger a competition among sectors for water use, making difficult to find a balance between demand and supply.
The impact of climate change on plant physiology
The increasing GHG concentration in the atmosphere is the main responsible for the increasing temperature, but also variation of the relative humidity in the atmosphere are
18
Sara Masia – A modeling tool to assess local and regional impact of climate change on crop water requirement in Euro-Mediterranean Countries, and assessment of Mediterranean irrigated agriculture vulnerability – Tesi di Dottorato in Scienze Agrarie – Curriculum “Agrometeorologia ed Ecofisiologia dei Sistemi Agrari e Forestali” – Ciclo XXIX – Università degli Studi di Sassari – Anno Accademico 2015 - 2016
expected. This affects transpiration process, thus, warming will have a direct and strong impact on evapotranspiration. Additionally, plants react to higher values of CO2
concentration with the partially closure of stomata that results in the reduction of conductance (Bernacchi et al., 2007; Snyder et al., 2011).
Plants need to absorb carbon dioxide (CO2) from the atmosphere to carry on the
photosynthetic process and to loose water to regulate internal temperature. The water lost from the leaves during the plant’s lifetime is equivalent to hundred times the fresh weight of the specific plant (Taiz and Zeiger, 2008). The transpiration is basic for plant physiology. Nowadays, it is known as one of the most important processes thanks to which the plant can regulate internal temperature in order to not impact metabolism (Cocucci, 2006). The conversion of water from liquid to vapor requires energy, which is provided by the plant through the dissipation of heat; evaporative process leads to cool plant structures (Taiz and Zeiger, 2008). Water passes from cell to cell through membranes following a water potential gradient from soil to leaves which is important also to measure the “water status” of a plant (Taiz and Zeiger, 2008). The movement of water in the atmosphere occurs through small pores named stomata located in the leaves surface. Stomata are generally closed as a response to water stress due to increasing temperature; this reduces the exchange of water vapor and CO2 between plant and
atmosphere (Taiz and Zeiger, 2008).
The impact of global warming on plant physiology is still controversial. It is crucial to understand and to quantify the effect of rising CO2 concentration and consequently
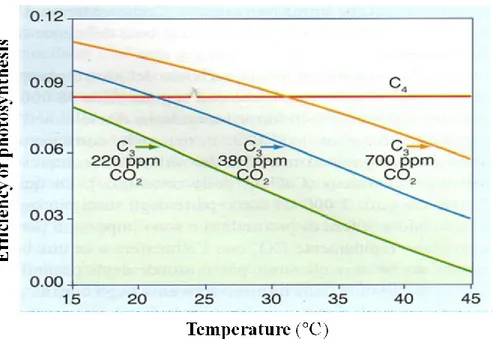
increasing temperature on photosynthetic process (Bernacchi et al., 2003) because this can influence crop yield (Streck, 2005). The response of C3 and C4 plants to the climate change is different due to their attitude in fixing and reducing CO2. Several studies
stated that competitiveness of C3 plants increases with the increasing concentration of CO2 in the atmosphere. It stimulates C3 photosynthesis, that results in a more vigorous
growth and higher yields (Patterson et al., 1984; Cure and Acok, 1986). C3 plants respond reducing photorespiration and increasing photosynthesis until the point where both CO2 uptake and release are balanced (Taiz and Zeiger, 2008). The efficiency of C3
and C4 plants related to carbon dioxide concentration and temperature is shown in Figure 11.
19
Sara Masia – A modeling tool to assess local and regional impact of climate change on crop water requirement in Euro-Mediterranean Countries, and assessment of Mediterranean irrigated agriculture vulnerability – Tesi di Dottorato in Scienze Agrarie – Curriculum “Agrometeorologia ed Ecofisiologia dei Sistemi Agrari e Forestali” – Ciclo XXIX – Università degli Studi di Sassari – Anno Accademico 2015 - 2016
Fig. 11. C3 and C4 plants photosynthetic efficiency in relation to temperature and atmospheric CO2 concentration (modified from Rascio et al., 2012).
Cure and Acok (1986) stated that in case of doubling CO2 concentration in the
atmosphere, the leaf area tends to increase, while transpiration tends to decrease by about 23% as a direct consequence of water stress. In that case, water efficiency is improved, and that results in a lower crop water needs that tends to be an advantage during dry periods (Samarkoon and Gifford, 1995).
Evapotranspiration concept
Evapotranspiration (ET) is the combination of two processes, evaporation and transpiration. Water is converted from liquid to gas simultaneously from several surfaces and open water bodies such as soil, wet vegetation, rivers, oceans, seas, and lakes by evaporation (E), and from plant tissues by transpiration (T) (Allen et al., 1998). Air temperature, wind speed, solar radiation, as well as relative humidity are the key factors in the transfer of water vapor to the atmosphere.
The energy necessary to change the state of water molecules from liquid to vapor from the abovementioned surfaces in the evaporation process is provided by the sun. The process is a direct function of the temperature and an inverse function of the air humidity. The sun is the driving force also in the transpiration process. Stomata control the loss of water from leaves. The process is influenced not only by the climatological
20
Sara Masia – A modeling tool to assess local and regional impact of climate change on crop water requirement in Euro-Mediterranean Countries, and assessment of Mediterranean irrigated agriculture vulnerability – Tesi di Dottorato in Scienze Agrarie – Curriculum “Agrometeorologia ed Ecofisiologia dei Sistemi Agrari e Forestali” – Ciclo XXIX – Università degli Studi di Sassari – Anno Accademico 2015 - 2016
parameters involved in direct evaporation but also by the crop, the environment, and plant management.
The two processes are simultaneous but the percentage of water lost by each is different, and varies during the growing season. Taking into account the leaf area index (LAI) development in the growing season, at sowing the 100% of water lost is determined by evaporation, while for a well developed crop, where canopy covers a high percentage of soil, nearly the 90% of water losses are due to transpiration (Figure 12) (Allen et al., 1998).
Fig. 12. Evaporation and transpiration ratio during the crop growing season (Allen et al., 1998).
The evapotranspiration values are usually referred to the depth of water lost in a time period through both evaporation and transpiration processes. ET is expressed in millimetres (mm) per unit of time. The ET data can be reported annually (mm yr-1), montly (mm month-1), daily (mm day-1), hourly (mm h-1), or seasonally (mm season-1). Evapotranspiration is expressed also in terms of millimeters of water lost per unit of area or considering the amount of energy per unit of area (Table 4) (Allen et al., 1998).
Tab. 4. Conversion factors and units used to express evapotranspiration. Values are referred to a temperature of 20 °C and to a water density of 1000 kg m-3 (Allen et al., 1998).
Depth Volume per unit area Energy per unit area mm day-1 m3 ha-1 day-1 L s-1 ha-1 MJ m-2 day-1
1 mm day-1 1 10 0.116 2.45
1 m3 ha-1 day-1 0.1 1 0.012 0.245
1 l s-1 ha-1 8.640 86.40 1 21.17
21
Sara Masia – A modeling tool to assess local and regional impact of climate change on crop water requirement in Euro-Mediterranean Countries, and assessment of Mediterranean irrigated agriculture vulnerability – Tesi di Dottorato in Scienze Agrarie – Curriculum “Agrometeorologia ed Ecofisiologia dei Sistemi Agrari e Forestali” – Ciclo XXIX – Università degli Studi di Sassari – Anno Accademico 2015 - 2016
When the process of evapotranspiration is referred to a hypothetical well watered crop, which covers entirely the soil, with a uniform height of 12 cm, an albedo of 0.23, and a surface resistance fixed to 70 s m-1, it is named reference evapotranspiration (ETo) (Allen et al., 1998).
Thus ETo refers to the evaporative request of the atmosphere for an hypothetical crop independent by crop features, stage of growth, and management. The water lost is referred to a reference surface, that can be used to make comparison of ET measured from other surfaces, at different places or at different time scales. Reference evapotranspiration is only affected by meteorological variables; for this reason it is calculated using weather data without regard to crop and soil features (Figure 13) (Allen et al., 1998).
Fig. 13. Reference evapotranspiration (ETo) conceptual scheme (Allen et al., 1998).
Solar radiation, wind speed, relative humidity and air temperature are the weather variables which mainly have an impact on evapotranspiration.
Hot temperature, low humidity, strong wind, and sunny days result in higher values of crop water requirements than values achieved in sites characterized by cool temperature, high humidity, little wind, and cloudy sky
(http://www.fao.org/docrep/x0490e/x0490e04.htm).
ETo is related to crop evapotranspiration (ETc) (eq.1) through a crop coefficient (Kc) obtained by the ratio between ETo and ETc.
22
Sara Masia – A modeling tool to assess local and regional impact of climate change on crop water requirement in Euro-Mediterranean Countries, and assessment of Mediterranean irrigated agriculture vulnerability – Tesi di Dottorato in Scienze Agrarie – Curriculum “Agrometeorologia ed Ecofisiologia dei Sistemi Agrari e Forestali” – Ciclo XXIX – Università degli Studi di Sassari – Anno Accademico 2015 - 2016
ETc refers to the total water amount used by a specific crop to grow up in standard conditions, that is to say a crop well-watered and fertilized, free from disease, grown in a large field (Allen et al., 1998).
The crop coefficient depends on the considered crop, the stage in the growing season, the crop physiology, the soil humidity, the absorbed light, as well as the plant age, morphology and ecophysiology. Since Kc is the ratio between ETc and ETo, it can be used to “adjust” the differences between the evapotranspiration of a specific and the reference crop. Kc values during the crop growing season are determined through the crop coefficient curve that is characterized by a different shape that is typical for each crop. In well-watered condition, the ET process mostly depend on the energy needed to vaporize water both from the soil and the canopy, thus the solar radiation plays a key role in the daily process. Considering the components of ET separately, i.e. E and T, in field or row crops, higher values of evaporation are measured before the sowing/budbreak, and after harvest/leaf fall. In this condition, the soil is bare and mostly exposed to the sunlight. Only the 10% of the canopy covers the ground since this period represents the first step of the growing season (stage AB, Figure 14).
Fig. 14. Example of pattern of crop coefficient during the growing season of annual crops (Snyder et al., 2007).
The transpiration values increase depending on the crop growth; the process is dominant during the midseason (stage CD, Figure 14) when the solar radiation is mostly intercepted by the canopy, with only a small reaching the soil. The ratio of evaporation to ET increases again when the crop is near to the senescence.
The different growth stages during the growing season are different in deciduous plants and vine crops, where the initial growth stage is omitted (Figure 15) (Snyder et al.,
23
Sara Masia – A modeling tool to assess local and regional impact of climate change on crop water requirement in Euro-Mediterranean Countries, and assessment of Mediterranean irrigated agriculture vulnerability – Tesi di Dottorato in Scienze Agrarie – Curriculum “Agrometeorologia ed Ecofisiologia dei Sistemi Agrari e Forestali” – Ciclo XXIX – Università degli Studi di Sassari – Anno Accademico 2015 - 2016
2007), and the midseason starts with canopy covering 70% of soil. The growing season begins rapidly at the budbreak, and it ends when transpiration is equal to zero, i.e. when leaf drop (Snyder et al., 2005).
Fig. 15. Crop growing season of deciduous plants and grape (Snyder et al., 2007).
Since during initial growing period and off-season the evaporation process is dominant, rather than transpiration, the crop coefficient for bare soil should be computed to estimate water lost through ET. Crop coefficient for bare soil during these periods is a function of the reference evapotranspiration and soil wetness (Snyder et al., 2005). Crops do not always grows under standard or optimal conditions. Most of the time in fact they are affected by disease, limited water resources, and low soil fertility. Under these conditions, crop yield and quality decrease. The evapotranspiration of a crop under no-standard conditions is called Actual Evapotranspiration (ETa) (Figure 16). It refers to an adjusted crop evapotranspiration (ETc adj) computed taking into account a stress coefficient (Ks).
Fig. 16. Crop and actual evapotranspiration under standard and no-standard growing conditions conceptual scheme (Allen et al., 1998).
24
Sara Masia – A modeling tool to assess local and regional impact of climate change on crop water requirement in Euro-Mediterranean Countries, and assessment of Mediterranean irrigated agriculture vulnerability – Tesi di Dottorato in Scienze Agrarie – Curriculum “Agrometeorologia ed Ecofisiologia dei Sistemi Agrari e Forestali” – Ciclo XXIX – Università degli Studi di Sassari – Anno Accademico 2015 - 2016
ETa is calculated multiplying the ETc by a Ks (Allen et al., 1998) (eq.2). (mm) eq. 2
The amount of water lost through the evapotranspiration process should be replenished to guarantee a well-watered condition for an optimal crop growth. The water necessary to refill the losses due to evapotranspiration is named “Crop Water Requirement” (CWR) (Allen et al., 1998).
Evapotranspiration, and thus crop water requirements are influenced by several environmental, crop, weather, and management factors. Crop diseases, chemical and physicals soil properties can reduce crop growth and consequently the evapotranspiration. The amount of water lost by the crop depends also on the variety, the cultivar, the ground cover, the rooting depth, the canopy height and roughness. The depth of water applied to refill the soil up to the field capacity is named Net water Application (NA). In addition, differences in frequency and intensity of irrigation as well as the irrigation system, should be taken into account to assess the process, and to define strategies to reduce water losses (Allen et al., 1998).
Methods to compute reference and actual evapotranspiration
Reference evapotranspiration calculation
In the past years, three different approaches were followed to estimate ETo: radiation model, temperature model, and or the combination of different models (Jacobs, 2001) (Table 5).
Many equations were developed to compute ETo, and many changes were done in the past to develop the best procedure. Most of the equations proposed were strictly related to the specific climatic condition where they were developed (Allen et al., 1998).
In 1990, the Expert Consulation stated that “the FAO Penman-Monteith is recommended as the sole standard method for the definition and computation of the reference evapotranspiration” (http://www.fao.org/docrep/x0490e/x0490e06.htm). The FAO Penman-Monteith method is considered the most precise equation, because it is based on a detailed theoretical base (Buttafuoco et al, 2010). It requires detailed climate data such as air temperature, relative humidity, net radiation, and wind speed as
25
Sara Masia – A modeling tool to assess local and regional impact of climate change on crop water requirement in Euro-Mediterranean Countries, and assessment of Mediterranean irrigated agriculture vulnerability – Tesi di Dottorato in Scienze Agrarie – Curriculum “Agrometeorologia ed Ecofisiologia dei Sistemi Agrari e Forestali” – Ciclo XXIX – Università degli Studi di Sassari – Anno Accademico 2015 - 2016
well as other crop parameters. A simpler method is the Hargreaves Samani equation (Buttafuoco et al., 2010), which requests only data on extra-terrestrial solar radiation, maximum and minimum temperature (Samani, 2000). A brief description of these two equations is reported below.
Tab. 5. Different approaches to compute Reference evapotranspiration (ETo) (Jacobs., 2001).
Abbreviation Approach Source and Description
McCloud Temperature IFAS golf course and turf publications
Thornthwaite Temperature Thornthwaite and Mather (1957)
MBC Temperature Modified Blaney-Criddle
SFWMD Temperature Modified Blaney-Criddle with SFWMD crop coefficients
MMBC Radiation SFWMD Modified-Modified Blaney-Criddle (Shih, 1981)
Harg Radiation 1985, Hargreaves (Hargreaves et al., 1985)
Turc Radiation 1961, (Turc, 1961)
Pen48 Combination 1948 Original Version of Penman (Penman, 1948)
Pen63 Combination 1963 Version of Penman (Penman, 1963)
Pen77 Combination FAO24 Modified Penman (Doorenbos and Pruitt, 1977)
IFAS Pen Combination IFAS Florida Modified Penman (Jones et al, 1984)
ASCE PM-90 Combination ASCE-Penman Monteith, Jensen et al. (1990) w/Rn56, G56, ra & rs = F(ht) , λ=F(T)
Pen, FAO Combination ASCE-PM w/ht = 0.12 m , rs = 70 s/m and albedo = 0.23 , Rn 56, G = 0 , λ = 2.45 MJ kg-1 (Allen et al.,
1998)
ASCE00 Combination ASCE-PM, ra = f(ht) , albedo=0.23 , daily Et0 rs = 70 s/m ,
hourly Et0 rs = 50 & 200 s m-1 , daily Etr rs = 45 s m-1
hourly Etr rs = 30 s/m & 200 s m-1 (Walter et al., 2000)
Standardized reference evapotranspiration for short canopies
Based on the FAO-56 Penman-Monteith equation, the daily standardized reference evapotranspiration rates for short canopies (ETos) is calculated using daily data of solar net radiation (MJ m2), minimum and maximum relative humidity (%), wind speed (m s
-1), and minimum and maximum air temperature (°C) (Allen et al., 1998; Allen et al.,
2005) (eq. 3). The equation is calculated considering either relative humidity or dew point temperature (°C).
26
Sara Masia – A modeling tool to assess local and regional impact of climate change on crop water requirement in Euro-Mediterranean Countries, and assessment of Mediterranean irrigated agriculture vulnerability – Tesi di Dottorato in Scienze Agrarie – Curriculum “Agrometeorologia ed Ecofisiologia dei Sistemi Agrari e Forestali” – Ciclo XXIX – Università degli Studi di Sassari – Anno Accademico 2015 - 2016
(mm) eq. 3
where Δ is the slope of the saturation vapour pressure-temperature at the mean air temperature curve (kPa °C-1), Rn is the net radiation measured or calculated at the crop surface (MJ m2 d-1), T is the mean daily air temperature (°C) calculated by the minimum and maximum daily temperature, u2 is the mean wind speed measured at 2 m height (m s-1), G is the ground heat flux density measured at the soil surface (MJ m2 d-1), es is computed as the mean of saturation vapor pressure at the maximum and minimum air temperature, and it is the saturation vapor pressure at 1.5 to 2.5 m height (kPa), ea is the mean actual vapor pressure at 1.5 to 2.5 m height (kPa), γ is the psychometric costant, rc and ra are the surface and aerodynamic resistance (m s-1), respectively.
The elevation of the site is basic to calculate the mean atmospheric pressure (P) following the Universal Gas Law, as:
(kPa) eq. 4
where P is the mean atmospheric pressure at the station elevation "z" above mean sea level (m).
The Psycometric Costant ) is calculated as:
(kPa °C-1) eq. 5
where P is the mean atmospheric pressure at the station elevation "z", λ is the latent heat of vaporization, cp the specific heat measured considering a constant pressure, and ε is the ratio between molecular weight of vapor and dry air (Allen et al., 1998).
According to Allen et al. (1998, 2005) the slope of Saturation Vapor Pressure curve ( ) is computed as:
27
Sara Masia – A modeling tool to assess local and regional impact of climate change on crop water requirement in Euro-Mediterranean Countries, and assessment of Mediterranean irrigated agriculture vulnerability – Tesi di Dottorato in Scienze Agrarie – Curriculum “Agrometeorologia ed Ecofisiologia dei Sistemi Agrari e Forestali” – Ciclo XXIX – Università degli Studi di Sassari – Anno Accademico 2015 - 2016
(kPa °C
-1) eq. 6
where is the slope of saturation vapor pressure curve and T is the daily mean air temperature (°C).
The saturation Vapor Pressure Deficit equation is:
(kPa) eq. 7
where es is the saturation vapor pressure and ea the actual vapor pressure
The capacity of the air to hold water is named as Saturation Vapor Pressure (es), and it is calculated as:
(kPa) eq. 8
where is the saturation vapor pressure function:
(kPa) eq. 9
The actual vapor pressure at the dew point temperature (ea), can be computed following several equations. The choice of the method to calculated ea depends on the available data. When dew point temperature (Tdew) values are available, the equation to compute ea is:
(kPa) eq. 10
The Tdew is a measure of the atmospheric moisture. It represents the temperature to which the air is saturated with water vapor. Higher dew point temperature means more moisture in the atmosphere. When minimum and maximum air temperature, and relative humidity are known, ea is calculated following the equation: