Sci Tot Environ guide for authors:
www.elsevier.com/journals/science-of-the-total-environment/0048-9697/guide-for-authors#39000
Total and differentially extractable fractions of metals in the soil of home gardens and
cultivated vegetables in the province of Brescia, Italy: Implications for human
exposure
Roberta Ferri1, Donald R. Smith2, Stefano Guazzetti3, Filippo Donna1, Enrica Ferretti4, Michele
Curatolo4, Caterina Moneta4, Gian Maria Beone5, Dana Hashim6, Roberto G. Lucchini1,2,6
1. Department of Experimental and Applied Medicine, University of Brescia, Brescia, Italy; 2. Microbiology and Environmental Toxicology, University of California, Santa Cruz, CA, USA; 3. Public Health Service, Reggio Emilia, Italy;
4. Department of Food Chemistry, Metal Laboratory, IZSLER Brescia, Italy;
5. Institute of Agricultural and Environmental Chemistry, Università Cattolica, Piacenza, Italy; 6. Department of Preventive Medicine, Mount Sinai School of Medicine, New York, USA. 5
10
ABSTRACT
Background. Ferroalloy industries in the province of Brescia, Italy have produced emissions of particulates enriched in metals such as manganese (Mn), lead (Pb), zinc (Zn), copper (Cu), cadmium (Cd), chromium (Cr), iron (Fe), aluminum (Al) for up to a century. Prior studies in the province have shown associations between soil Mn and Pb levels and neurological impairments in children and adults. The aim of this study was to assess the soil metal loadings and concentrations in home grown vegetables in areas of different ferroalloy industrial activity durations.
Methods. Home gardens (n=63) of local study participants were selected in three sites of varying ferroalloy plant activity in Brescia province. Total soil metal concentration and metal extractability were measured using X-ray fluorescence (XRF), aqua regia extraction, and a modified Community Bureau of Reference (BCR) sequential extraction method. Unwashed and washed spinach and turnips cultivated in the same gardens were also analyzed for element concentrations by flame atomic absorption spectrometry.
Results. The median concentrations of Al, Cd, Fe, Mn, Pb, and Zn in soil were significantly higher in the home gardens near ferroalloy plants compared to home gardens more distant from the ferroalloy plants. The BCR showed the most mobile fraction of soil (defined here as the sum of extractable metals in BCR fractions 1 + 2) that reflect the Ferroalloy plant processing was higher in the areas with ferroalloy plants, for all elements. Unwashed spinach showed higher metal concentrations compared to washed spinach, and metals in washed spinach were higher in the areas of agricultural product use. Over 60% of washed spinach samples exceeded by 2 to 4-fold the maximum level of Pb set by the Commission of the European Communities and the Codex Alimentarius Commission, whereas 10% of spinach samples exceeded by 2 to 3-fold the maximum Cd level set by both organizations. Metal levels in turnip samples were below these maximum standard reference values.
Conclusions. Prolonged industrial emissions can increase median element concentrations and their most soluble fraction (BCR F1+F2) in the soil of home gardens located in the ferroalloy plant vicinities. Ferroalloy plant activity was also associated with increased external contamination of leafy vegetables to levels several-fold above the maximum standard reference values. It is recommended that vegetables be carefully washed to avoid exceeding element exposure concentrations above homeostatic requirements that would harm human health.
Keywords: metal, phytoavailability, ferroalloy industry emissions, vegetables, plant uptake, modified BCR sequential extraction procedure
20 25 30 35 40 45 50
1. INTRODUCTION
Soil contaminated with metals as a result of anthropogenic activities has been demonstrated to pose health risks to surrounding populations (Carrizales et al., 2006; Hinwood et al., 2004; Pruvot et al., 2006). Human exposures may occur via hand-to-mouth transfer, particularly in young children (Calabrese et al, 1997). Other exposure routes include inhalation/ingestion of re-suspended soil particulates (Harris and Davidson, 2005), and contamination of locally grown vegetables (Cambra et al, 1999, Hough et al, 2004). Metal contamination of soil may be of particular concern for communities in close proximity to industrial emissions because these communities often rely on home gardens for dietary vegetable consumption (Yujing et al., 2005; Zheng N. et al., 2007).
Manganese (Mn) is a biologically essential element and a key element of ferroalloy production. However, human exposures may become toxic when concentrations exceed the nutritional requirements. Higher lifetime Mn exposure has been found to significantly increase the prevalence of Parkinsonian disturbances in the province of Brescia (Lucchini et al, 2007). Additionally, a significant positive association between soil Mn exposure and both impaired motor coordination and odor discrimination were observed among adolescents (Lucchini et al., 2012) and elderly (Zoni et al., 2012; Lucchini et al., 2014) who reside in close proximity to ferroalloy emission sites located in Valcamonica, one of the pre-Alps valleys in the Brescia province.
Total soil metal concentration data may provide little information about the chemical mobility and bioavailability of metals to plants (Oyeyiola et al., 2011). In fact, the chemical form of metals in soil (i.e., speciation), as well as the physical and chemical characteristics of the soil environment directly influence metal mobility, reactivity and availability for plant absorption. (Olayinka et al., 2011; Anawar et al., 2008; Menzies et al., 2007). Sequential chemical extraction of soil metals can be used to determine the chemical mobility and potential bioavailability of metals in soils and their uptake by plants (Kennedy et al, 1997; Dilek et al., 2011), though the extraction efficiency is highly dependent on the extraction protocol performed. The lack of procedure uniformity and suitable reference concentrations for comparisons of methods has hindered validation of results across sutdies. To address this, the European Commission, through the BCR programme and its successors, conducted a series of inter-laboratory studies that resulted in the certification of soil and sediment reference materials for chemical extraction studies (Rauret et al., 2000). These reference materials have proven very useful for methodological calibrations, and a standardized protocol for sequential extraction, constituting the three-fraction modified European Commission Community Bureau of Reference (formerly BCR) protocol was developed, and subsequently used in the present 55 60 65 70 75 80
study (Rauret et al., 1999; Pueyo et al., 2008; Zimmerman and Weindorf 2010). The sequential extraction procedure, as well as the single extraction procedure, has been commonly used to study metal mobility in soils. Several studies (Gupta and Sinha l, 2006; Anawar et al, 2008) were conducted to correlate metal levels in plants and soil using single extraction methods, whereas very few have used sequential extraction methods
This study aimed to examine element concentrations and chemical mobility of typical ferroalloy industrial emission metals, including Mn, aluminum (Al), cadmium (Cd), chromium (Cr), copper (Cu), iron (Fe), lead (Pb), and zinc (Zn) in home garden soil and vegetables in the province of Brescia, Italy. The metal concentrations in soil and vegetables in the ferroalloy-impacted sites were compared to non-impacted sites within the same province. This study allowed also the comparison of different analytical techniques.
2. MATERIALS AND METHODS 2.1 Study site
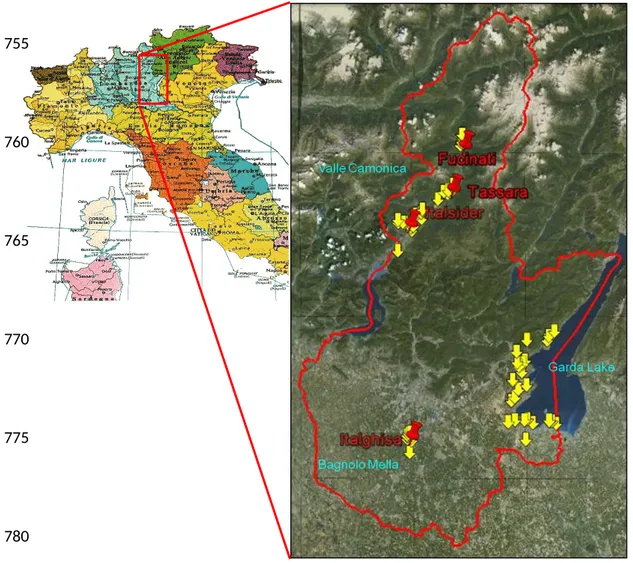
Three areas within the province of Brescia, Italy, were investigated: i) Valcamonica, a pre-Alps valley where three ferroalloy industrial sites had been active for about a century, ceasing ferroalloy activity in 2001; ii) Bagnolo Mella, located in the southern plain of the province, where a ferroalloy plant has been active since the 1970s; and iii) Garda Lake, a region with no history of metallurgic industry. More details on the study areas are reported in Ferri et al. (2012). In order to assess the potential exposure impacts of the local ferroalloy activities on the local population, the home gardens of participants were also examined in this study, including collection of home garden soils and cultivated vegetables for metal analyses. Participating home gardens were 63 in total: 27 in Valcamonica, 9 in Bagnolo Mella and 27 in Garda Lake (Fig. 1).
2.2 Soil samples
Approximately 500 g of soil from each of the 63 participating home gardens were collected prior to seasonal planting from February to April 2010, and in accordance with the official Italian method I.1 for soil chemical analysis (Ministerial Decree 13/09/1999). Each ~500 g soil sample was a composite of 10–15 sub-samples of surface soil (~30-50 g per sub-sample, excluding the first 2-3 cm of surface soil), collected into dry, clean plastic ziplock bags using an ‘X-shape’ sampling grid across the garden. Information on the sampling area, date and depth of the soil sample, and use of fertilizers was recorded. In addition to home gardens, a series of undisturbed surface soil samples 85 90 95 100 105 110
(n=14) were collected at incremental distances (80 m to 22 km) from the ferroalloy plant point sources for a comparison with home gardens soils. An aliquot of each sample was screened for total metal concentrations using a portable X-Ray Fluorescence (XRF) spectrometer (Niton, ThermoFinnigan). Within the laboratory, samples were processed and analyzed using a single extraction method of aqua regia with analysis by Flame Atomic Absorption, or using the BCR three step sequential extraction procedures with analysis by ICP-OES, as described below.
2.2.1 XRF analyses
Determination of total soil Cu, Cd, Cr, Fe, Mn, Pb, Zn total concentration was carried out by a portable X-ray spectrometer for chemical analysis (model NITON XL3t) equipped with GPS locator. Measurements were taken of the composite soil sample before sieving and starting the sequential extractions. The U.S. standard soil reference materials NIST-2709-a and NIST-2710 were used as the calibration standards for the XRF measurements. The spectrometer was calibrated before each measurement by measuring the international reference materials.
2.2.2 Modified BCR three-step sequential extraction procedure
Each composite soil sample was well-mixed and an aliquot (~1 g ± 10 %) was removed and oven-dried (65°C) to a constant weight for 24 h and sieved to <150 μm. A subset of soil samples were processed in triplicate. Sieved soil samples were analyzed with the modified version of the BCR-three step sequential extraction procedure, as previously described (Ferri et al., 2012; Pueyo et al., 2008; Rauret et al., 2000; Mossop and Davidson, 2003). First, soil metals were extracted in 40 mL of 0.11 M acetic acid (fraction 1). Second, 40 mL of 0.5 M hydoxylammonium chloride was added to the soil residue from fraction 1 and extracted at pH 1.5 (fraction 2); Next, the soil residue was extracted using 20 mL of 8.8 M hydrogen peroxide and 50 mL of 1.0 M ammonium acetate (fraction 3); Lastly, the residual soil fraction was then digested in 5 mL of 7.5 N HNO3 at 80ºC and
extracted (fraction 4).
This modified BCR procedure yielded four fractions per soil sample. Fraction 1 (F1) reflects exchangeable and weak acid soluble metals, and is the most mobile fraction of soil metals potentially available to vegetables. This fraction of elements is present in soil in a sorption complex, often associated with carbonates (Agnieszka M., 2004). The second fraction (F2) contains reducible metals, often absorbed or included in Mn-Fe oxides. The third fraction (F3) contains oxidizable metals associated with the organic matter and sulfides. Metals associated with fraction 3 are considered to be less mobile compared to fractions 1 and 2, and are often incorporated into stable high molecular weight humic substances (Dilek B. 2011). The fourth, residual fraction (R) contains 115 120 125 130 135 140 145
primarily strongly complexed metals that are relatively immobile and unavailable for plants (Dilek B. 2011).
Metal extraction efficiency and reproducibility was evaluated using a soil standard reference material processed in triplicate with each soil extraction batch (BCR 483; sewage sludge amended soil certified by the Community Bureau of Reference). This CRM has certified values for Cd, Cr, Cu, Pb and Zn, extracted using 0.05 mol L–1 EDTA and 0.43 mol L–1 acetic acid, which is indicative
of the readily extractable contents of these elements using the BCR sequential extraction procedure. Differently from this method, we used acetic acid solution of 0.11 mol L-1 to extract the first
fraction.
The concentrations of Al, Cd, Cr, Cu, Fe, Mn, Pb, Zn in the soil extracts were determined by inductively coupled plasma-optical emission spectrometry (ICP-OES; Perkin-Elmer Optima 4300 DV Series), as previously reported (Borgese et al., 2013). The relative amounts of metals extracted in F1 to R fractions were determined and their sums normalized to 100%. Results are described in terms of the percent distribution within each fraction; the first fraction indicates the most phytoavailable form of the metal. The total metal concentrations were calculated as the sum of values from all four fractions (F1, F2, F3 and R) obtained by the modified BCR sequential extraction procedure.
Average recovery of metals from the BCR 483 reference material was determined for each metal and fraction. This method resulted in a recovery range of 64-107% for each fraction extracted. The within-sample reproducibility of metal analysis was determined by analyzing a subset of composite soil sample extracts in triplicate. The relative standard deviation of samples processed and analyzed in triplicate was <5%, which was considered acceptable. Results are expressed as mg metal per kg of dry weight sample.
2.2.3 Aqua regia extraction procedure
The aqua regia procedure was used as official method and BCR modified method to estimate the speciation and the following mobility of metals in the soil. Soil samples were air dried at about 28-30°C in a shady area and ground to pass through a 0.2 mm sieve. Trace elements in soil samples were measured from aqua regia extractions, following the method XI.1 indicated by the specific Italian regulation (Ministerial Decree 13/09/1999).
Samples (~1g) were placed in 250 mL of Erlenmeyer flasks and 20 mL of H2O2 were added
gradually to eliminate the organic matter. The suspension was heated and the volume reduced to ~3 150 155 160 165 170 175
mL. Once cooled to room temperature, 9 mL HCL and 3mL HNO3 were added to the samples and
digested for 2 hours. The digested samples were filtered through an ash-free paper filter, diluted to 100 mL with deionized water and stored in polyethylene bottles until analysis. The near-total concentrations of Cd, Cr, Cu, Fe, Mn, Pb and Zn were determined in the digestate sample by atomic absorption spectrometry with flame atomization (FAAS). Aluminum was not analyzed with the aqua regia procedure.
2.3 Vegetable samples
Two of the commonest vegetable plants in Italian home gardens were selected: spinach (a leafy vegetable) and turnip (a root vegetable). Seeds of spinach ‘Spinacio lorelay’ and turnip ‘Rapa of Milan with violet collar’ were provided to and planted in the home gardens of the three study areas by participating gardeners during the end of April to end of May. Approximately 6 g of spinach seeds were spread over a 1 m2 surface area. Three seeds of turnip were placed in each hollow with a
sowing distance of ~20-30 cm between the rows and 15-20 cm on the row. After establishment, seedlings were thinned to one plant per hollow, choosing the healthiest and strongest.
2.3.1 Samples harvesting and preparation
The plants were grown for 6-8 weeks and then harvested. Participating gardeners followed typical irrigation practices and were asked not to fertilize. Spinach and turnip samples were collected from a total of 47 and 54 home gardens, respectively. For spinach, 21 vegetable samples were collected from Valcamonica, 20 from Garda Lake, and 6 from Bagnolo Mella. For turnip, 23 vegetable samples were collected from Valcamonica, 22 from Garda Lake, and 9 from Bagnolo Mella. After harvest and transportation to the laboratory, the edible portion of these vegetable samples was prepared for analysis. Edible portions of spinach were randomly divided into two fractions. To estimate the amount of soil metals removed by washing, one fraction of the vegetable was left unwashed and the other fraction was carefully washed with tap water. Washed and unwashed vegetable fractions were separately processed. For this, ~300g of each vegetable fraction was homogenized using a blade homogenizer. Turnips were prepared for analyses by washing with tap water, peeling to remove the skin, and the edible portion of the turnip chopped for subsequent homogenization; ~300 g of chopped turnip was homogenized for digestion.
2.3.2 Digestion and analysis of the vegetable samples
Chemical analyses of the vegetables were carried out by the Department of Food Chemistry’s, Metal Laboratory in IZSLER in Brescia, with AAS techniques, according to ISO guidelines. 180 185 190 195 200 205
Briefly, a total of 3 g of homogenized sample was weighed into Teflon vessels, and 2 mL (30% H2O2 and 8 mL 65% HNO3) of trace metal grade were added to each vessel. The vessels were left
for ~30 minutes at room temperature and then mineralized in a CEM microwave reaction system (model MarXpress). The microwave and thermal programs used in the process were as follows: Stage: 1; Max Power (W): 1600; Ramp (min): 30.0; Temperature: 200°C; Hold (min): 20. After the mineralization step, each sample solution was poured into a 25 mL Class A precision flask and made up to the final volume with Milli-Q water. In the digested sample solutions, Pb and Cd were detected and quantified using a Varian GF-AAS system (Mod. AAS240z V) with Zeeman background correction. Iron, Zn, and Mn were detected and quantified using a Perkin Elmer F-AAS system (Mod. 3110) using an air-acetylene flame; Cu was detected and quantified through both systems depending on its concentration in the mineralized sample. The analysis accuracy was evaluated for each batch using a spike recover approach, in which aliquots of vegetable digestates were fortified with known concentrations of metals, blank solutions, and with the standard addition method. Concentrations of metals in vegetables are expressed in mg metal kg-1 fresh weight of
vegetable sample. Spike recovery percentages on average were 60% for Cd, 76% for Zn, 82% for Cu and Pb, 83% for Mn and 89% for Fe. The lower value (60%) for Cd was due to the lower fortification, about ppb, than other metals.
2.3.3 Contribution to dietary intake of Cd and Pb from locally grown vegetables.
To assess the contribution of Cd and Pb contaminated vegetables to dietary intake, we considered two consumer groups: children (3-10 years old), and consumers older than 10 years. To measure mean individual exposure levels, the FAO/WHO (1997) formula was applied:
Mean vegetable contamination level (µg/Kg) x Mean individual daily vegetable consumption (Kg/day) Mean body weight (Kg)
Mean Pb and Cd exposures were based on locally grown spinach and turnip measurements in the three research sites. The mean individual spinach and turnip consumption for Italian subjects were based on the data reported by Leclercq (2009).
Mean individual exposure level results were expressed in µg kg-1 bw day-1 and compared to the
Tolerable Daily Intake (TDI) level of 0.36 µg kg-1 bw indicated for Cd by the European Food Safety
Authority (EFSA, 2006 and 2011). Since there is no established Pb exposure threshold for developmental neurotoxicity in children (up to age 7) and cardiovascular effects and nephrotoxicity in adults, no TDI has been indicated for Pb (EFSA, 2010; WHO, 2010). The European Food Safety Authority indicated a mean lifetime dietary Pb exposure of 1.03 µg kg-1 bw day-1 for 3-10 yrs old
210 215 220 225 230 235 240
children and of 0.68 µg kg-1 bw day-1 for overall European population (EFSA 2012). Since Pb TDI
has not yet been established, the benchmark dose levels (BMDL01) of 0.5 µg kg-1 bw day-1 for
developmental neurotoxicity, 1.50 µg kg-1 bw day-1 for effects on systolic blood pressure, 0.63 µg
kg-1 bw day-1 for chronic kidney disease estimated by the European Food Safety Agency (EFSA)
were used to compare to our calculated individual contamination concentration results.
3. STATISTICAL ANALYSIS
Empirical quartiles to summarize the data and non-parametric statistics (Kruskal-Wallis Test) were applied to compare the results of soil and vegetable measures between the study areas, followed by the post-hoc nonparametric ‘Nemenyi-Damico-Wolfe-Dunn’ test (Hollander, Wolfe 1999). The Bland-Altman method was used to evaluate the agreement of element concentrations between unwashed and washed spinach. The Bland Altman method was used also to compare the different analytical methods used for soil analysis. Spearman’s rank correlation coefficient was used to measure the correlation between metal concentrations in different fractions of soil and metal contents in vegetable samples. Statistical analysis and graphics were made with R (R Core Team, 2012). For all statistical tests of significance, alpha was set to 0.05.
4. RESULTS
4.1 Elements in soils
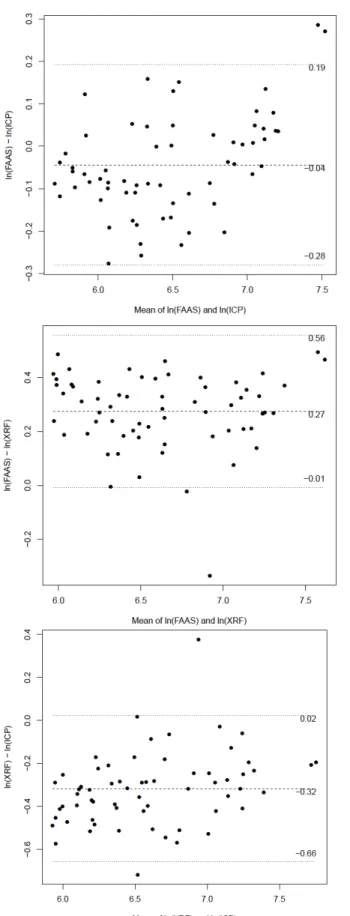
Descriptive statistics on soil metal concentrations measured using XRF, BCR modified sequential extraction with ICP-OES, and aqua regia extraction with AAS are reported in Table 1. According to the Bland Altman method the BCR showed lower values than XRF, which is expected considering that BCR does not produce complete dissolution of soil samples. The Aqua regia procedure produced higher soil metal concentration values than the BCR modified and XRF procedures for most of the analyzed metals except Mn as shown in Fig 2. A log transformation was applied order to stabilize the variance of the differences that increased with the mean level of Mn in soil. The antilogarithm of the differences can be considered as the ratio between the measures obtained with the two methods. The ratio between ICP and FAAS Mn was 0.96 (i.e. ICP underestimates FASS by about the 4%, 95% C.I. 0.75, 1.21), the ratio between XRF and FAAS was 1.32 (i.e. XRF overestimates FAAS by the 32% C.I. 0.99, 1.75) and the ratio between ICP and XRF was 0.73 (i.c. 0.52 - 1.02). 245 250 255 260 265 270
While the levels of Mn in soil measured with ICP and FAAS were in good agreement, the estimated difference between XRF and FAAS and between XRF and ICP, and the wide confidence intervals are suggestive of a poor agreement between these methods.
Median soil concentrations, obtained by BCR, were significantly higher in Valcamonica and Bagnolo Mella compared to the Garda Lake area for Al (p<0.0001 for both), Cd (p<0.0001; p=0.002), Fe (p<0.0001 for both) and Mn (p<0.0001 for both). Median soil sample values from the
Valcamonica region were significantly higher than Bagnolo Mella for Mn (p=0.0029) and Fe (p=0.0004). Zinc concentrations were significantly higher in Valcamonica (p=0.0078) compared to Garda Lake. A significant increase of Cu was observed in the Garda Lake compared to the Bagnolo Mella area (p=0.0228). Results were compared with the maximum allowable concentration indicated by the Italian regulation (n°152, Annex 4-V5) for residential sites: 100 mg kg-1 for Pb, 2
mg kg-1 for Cd, 120 mg kg-1 for Cu, 150 mg kg-1 for Zn and Cr. The percentages of soil samples
exceeding the maximum allowable concentrations were: for Pb, 7% in Valcamonica, 0% in Bagnolo Mella, 4% in Garda Lake; for Cd, 85% in Valcamonica; 100% in Bagnolo Mella, 59% in Garda Lake; for Cu, 15% in Valcamonica, 0% in Bagnolo Mella, 11% in Garda Lake; for Cr, 0% in Valcamonica, 0% in Bagnolo Mella, 4% in Garda Lake; for Zn, 59% in Valcamonica, 33% in Bagnolo Mella, 22% in Garda Lake. There was not clear relationship between the probability of exceeding threshold for these soil metal levels and the proximity to the ferroalloy plants. The average concentrations of Mn in the Garda Lake area were similar to the background level for this region of 465 ppm (Sacchi et al, 2007).
4.2 Elements in soil fractions
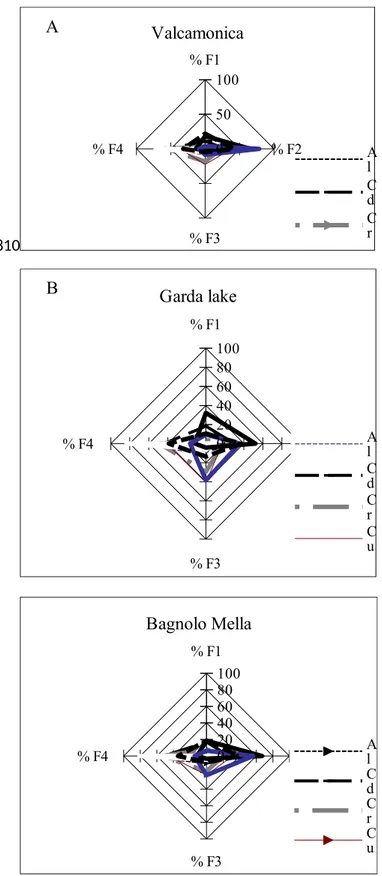
Results of the sequential extraction for Mn and the other elements are summarized in Table 2 and the chemical partitioning (%) are shown in Fig 3.
Cadmium is the only element with the same trend across the three study areas and showed comparable percentage in the F2 and R for Valcamonica samples (30%, 55% respectively), Bagnolo Mella (27%, 52% respectively) and Garda Lake (respectively 30%, 44%). The remaining of Cd was partitioned in the F1 and in the F3 for Valcamonica samples (respectively 11%, 4%), Bagnolo Mella (respectively 17%, 4%) and Garda Lake (18%, 8%). The results for Cd were in agreement with Cd being reported as an easily removed and chemically labile metal (Sahuquillo et al, 2003). Chromium showed the highest percentage in the F3 and R (respectively 30% and 49%) for Garda Lake samples while showed the highest percentage in the F2 and fraction R for Valcamonica (respectively 22%, 56%) and Bagnolo Mella (respectively 20%, 54%). The F1 was 3% for
Valcamonica, 8% for Bagnolo Mellaand 4% for Garda Lake samples.
275 280 285 290 295 300
The percentage of Cu in F1 represented the 2% for soil samples collected in Valcamonica and 0% for Bagnolo Mella and Garda Lake samples. Copper showed higher percentages in F2 for Valcamonica and Bagnolo Mella samples (38% and 31% respectively) compared to Garda Lake area (18%). Copper showed the highest percentage in F3 in Garda Lake samples (41%) compared to Valcamonica and Bagnolo Mella (23% for both).
Lead showed the highest concentrations in F2 of Valcamonica and Bagnolo Mella samples (78%, 56% respectively) and these results are comparable with data previously published by our group (Borgese, 2013). The increase of Pb in the F2 fractions shows its known tendency to be adsorbed (mainly by clay minerals, organic matter and Fe, Mn, Al oxides) and co-precipitated with Fe and Mn oxides (Favas, 2011).
Zinc showed the highest concentrations in the F2 of Valcamonica and Bagnolo Mella samples (respectively 41% and 39%). Al and Fe showed the highest percentage in the R fraction. The bivariate association between Al and Fe showed the highest positive correlation (0.78, p=0.03) among the elements considered in this study. Mn was found to be highly extractable by weak acids but was the most extracted analyte in F2 versus F1, in particular in soil samples collected on the Valcamonica and Bagnolo Mella. The order of extracted soil fractions for Mn across the three study areas was the following: F2 (66%)>F1 (18%) >R (14%)>F3 (2%) in Valcamonica; F2 (67%) >F1 (19%) >R (11%) >F3 (3%) in Bagnolo Mella and F2 (52%) >F1 (32%) >R (12%) >F3 (4%) in Garda Lake soils. Low contents of Mn in the R fraction were obtained in Garda Lake.
Regarding the comparison with undisturbed soil the percentage of Mn contained in F2 was similar in samples within very close proximity of historic or currently active ferroalloy plant operations (~68%) and Valcamonica and Bagnolo Mella home gardens, but higher than those found on the Garda Lake home gardens (~52%).
4.3 Element concentrations in vegetables
The results of trace element levels in unwashed, washed spinach and turnip samples grown in the home gardens of Valcamonica, Bagnolo Mella and Garda Lake were reported in Table 3.
Highest concentrations of trace elements were obtained from leafy vegetables for all three study areas. Lowest concentrations of trace elements were measured in root vegetables samples in accordance to the initial hypothesis.
In the home gardens the concentrations of Fe (p=0.003) and Cu (p=0.05) measured in unwashed spinach were significantly highest in the Bagnolo Mella area compared to the Valcamonica and Garda Lake. In washed spinach, levels of Cd, Cu, Mn, Zn and Pb were higher in the Garda Lake 305 310 315 320 325 330 335
area compared to the Valcamonica and Bagnolo Mella areas. In particular, Pb levels (p=0.02) and Zn levels (p=0.004) in the washed spinach were significantly higher in the Garda Lake area compared to the Bagnolo Mella area. Copper concentrations were significantly higher in turnip from Garda Lake compared to Valcamonica and Bagnolo Mella (p<0.0001, p<0.0001 respectively) areas. Washed spinach had the least median element concentration across all three study sites. The effect of washing and the metal removed percentage was calculated by following [(unwashed-washed)/unwashed]*100 for each pair of samples.
We compared levels of Cu, Fe, Mn, and Zn in vegetables with the available data in the literature (Table 4). The overall mean metal concentrations in the vegetables were lower or similar to reference values. Copper concentrations in turnip collected from the Garda Lake area were approximately double the levels in the Food Composition and Nutrition Tables (Souci et al., 2008), but in line with the US National Nutrient Database for Standard Reference (USDA, 2011).
A high percentage of spinach produced in the kitchen gardens on the Garda Lake, Valcamonica and Bagnolo Mella (65%, 62% and 17%, respectively) exceeded the guidelines set by the Commission of the European Communities and the Codex Alimentarius Commission for Pb, whereas 10% of spinach collected in the Garda Lake area exceeded both limits for Cd concentration. The turnip samples did not exceed these standards.
4.4
Spinach and Turnip consumption and dietary intake assessment for Cd and Pb
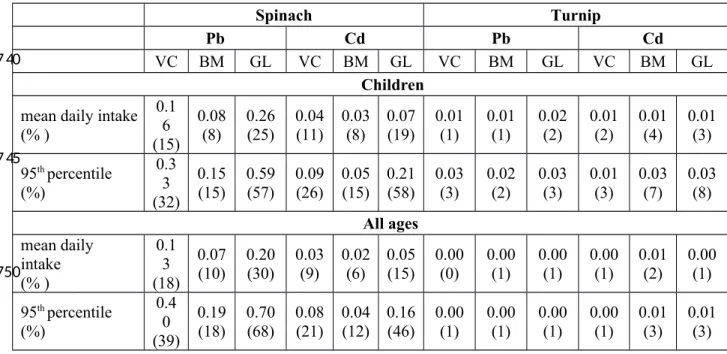
Estimates of daily intake of Pb and Cd secondary to vegetable consumption are reported in Table 5. The estimated daily intake of all elements from spinach was higher in Valcamonica and Garda Lake but not for turnip consumption. The daily intake of both Pb and Cd based on spinach consumption reached almost 60% of the mean lifetime dietary level for Pb and of the TDI level for Cd. Considering the BMDL01 for developmental neurotoxicity of Pb calculated by EFSA, the mean and 95th percentile daily intake for children on the Garda Lake area were respectively of 52% and
116% of this reference value, meaning that consumption of spinach would provide 52% max reference value Pb daily intake.
4.5 Correlation between the soil extractable metal levels and metal accumulation in plants
Metal levels in turnip were correlated to soil F3 Cu (Cs=0.35; p= 0.01) and total Cu (Cs= 0.47; p= 0.0007); to soil F1 Pb (Cs= 0.31; p=0.025), F3 Pb (Cs= 0.29; p= 0.04), R Pb (Cs= 0.28; p= 0.04) and to soil F1 Cd (Cs= 0.31; p= 0.02). No other correlation resulted between the concentrations of the metals in turnip and the soil fractions extracted. Similarly, no significant correlation was noted 340 345 350 355 360 365
between bio-concentrations in washed spinach leaves and the extractable metals content in different fractions of soils.
5. DISCUSSION
Here we used a number of complimentary analytical methods to investigate the impacts of local ferromanganese alloy plant activities on metal contamination in home garden soils and cultivated vegetables, including portable X-ray fluorescence (XRF) for field-based screening of surface soil metal levels, aqua regia digestion of soil to determine total extractable metals and a modified BCR sequential extraction method to determine chemical mobility of metals as a means to inform metal speciation in the soil and the potential bioavailability of metals to cultivated plants. We compared our results with the maximum allowable concentrations indicated by Italian regulations. The measurement of total metal concentrations in surface soil showed higher levels on Mn, Cd, Fe, Zn in the areas of current (Bagnolo Mella) and historical (Valcamonica) metal emission from ferroalloy industry). The soil from Valcamonica contained the highest metal concentrations, consistent with the century-long duration of ferroalloy activities in the valley. The intermediate values found in the Bagnolo Mella area likely reflect the current ferroalloy plant activities that have been in operation for a relatively shorter duration (~40 yrs) compared to those in the Valcamonica .
We applied the BCR sequential extraction procedure to assess the mobility of various elements to inform the potential phytoavailability of these elements. Cadmium, Mn and Zn were primarily extracted in the most chemically labile F1 fraction of soil samples collected in all the study sites; notably, the correlation between Cd and Mn (r=0.66), Cd and Zn (r=0.65), Mn and Zn (r=0.54) in the F1 fraction was highly significant (p<0.0001), suggesting similar chemical mobility of these elements across the three sites. The high percentages of these elements in the F1 fraction were probably due to their close association with carbonates (Marin, Giresse, 2001). Levels of Al, Fe, Mn, and Zn concentrations in the F2 fraction, which includes metals bound to Fe and Mn oxides, from soils of Valcamonica and Bagnolo Mella were significantly higher compared to the Garda Lake area. The highest levels of Al, Fe, Mn, and Zn elements from F2 may well reflect synthetic oxide reactions typical of ferroalloy production (i.e. MnO2 or Mn3O4). This is substantiated by
results from the comparison between impacted soils in proximity to current or historic ferroalloy plant emissions and home garden soils, suggesting that Mn was present in different 370 375 380 385 390 395
speciation/chemical compositions in the most impacted soils compared to Mn in Garda Lake home gardens with no impact of metallurgic activities.
Cromium and Cu levels in F3 from the Garda Lake soil samples were statistically higher compared to Valcamonica and Bagnolo Mella respectively; Pb level in F3 was highly significant from the Garda Lake soils if compared to Valcamonica and Bagnolo Mella areas and, possibly reflecting their strong complexation in soils relatively high in organic matter and/or sulfides (Diaz et al., 2011). The F3 fraction contains metals extracted from soil organic matter, which reduces element phytoavailability due to metal organic complexation (Gupta and Sinha, 2006). According to Udom et al. (2004), metal-organic matter complexation also decreases metal mobility in soils. Thus, the Garda Lake home garden soils contained relatively greater levels of these metals in chemical forms of lower mobility and potential phytoavailability compared to these metals in the Valcamonica and Bagnolo Mella soils. Consistent with previous findings from our group (Borgese, 2013), Al and Fe showed the highest percentage in the R fraction, indicating that Al and Fe are strongly bound to minerals and chemically-resistant components of the solid matrix. Our data on Mn fractionation are in agreement with previous results (Borgese, 2013), in that the percentage of Mn in the R fraction was lower compared to results from soils from an agricultural area published by Tokalioglu et al. (2010), further supporting the anthropogenic origin of Mn.
We observed poor correlations between the soil metal concentrations in the BCR fractions and the metal concentrations in cultivated plants. The phytoavailability of soil metals is influenced by a number of factors, including soil composition and chemistry (pH, oxygen content, etc.), organic matter content and composition, metal content and speciation, microbial activity, and of course the biochemical/molecular processes of plants that regulate metal uptake and utilization (Agbenin J, 2009). In a similar study by Olayinka (2011), no correlation was observed between the soil metal levels, as determined by sequential extraction, and bioavailability. Our results indicate that the metal content in at least these cultivated vegetables cannot be predicted using either the total or sequentially extracted soil metal levels, presumably because crop element content depends additionally on other factors such as those noted above.
This poor relationship between soil metal content and phytoavailibility may also have been difficult to quantify because of direct contamination from soil due to resuspension of soil particulates and direct airborne deposition onto the plant surfaces. For example, we did not find a significant statistical correlation between chemically labile Pb in the soil F1 fraction and Pb concentrations in spinach leaves, suggesting that the source of Pb could be not only from the labile pool in the soils but also from deposition of airborne particulate matter. It has been established in several bio-400 405 410 415 420 425 430
monitoring studies that plants accumulate trace elements from the atmosphere (Bargagli 1998; Rossini Oliva and Valdes, 2004; De Temmerman and Hoenig, 2004). According to Säumel et al. (2012), vegetables harvested at planting sites in heavy traffic neighborhoods such as in the Garda Lake area showed significantly higher Pb levels in edible biomass. In the present study, Cu concentrations were significantly higher in turnips grown in the Garda Lake compared to
Valcamonica and Bagnolo Mella regions, probably reflecting the frequent use of Cu fungicide treatments as Cu sulfate salt in the vineyards or olive trees in the Garda Lake region. The soil sampling was conducted in February, before planting the vegetables and before the ordinary treatments as mentioned above. Planting vegetable can change the fractionation pattern of the metals in the soils (Olaynka, 2011).
The higher metal concentrations on unwashed spinach in Bagnolo Mella is probably due to the re-suspension and direct deposition of soil particulates and/or airborne particulates on leaf surfaces. This is evidenced by the greater differences between washed versus unwashed metals levels for the spinach grown in the Bagnolo Mella site compared to the Valcamonica and Garda Lake sites. The highest concentrations of trace elements were obtained on leafy vegetables for all three study areas. The lowest concentrations of trace elements were measured in root vegetables samples. We speculate that turnips are not as influenced by the Pb contaminated dust attached to the leaf surface because they are less exposed to atmospheric deposition and vehicular emission. These would have been additional Pb sources due to interception and re-suspension by agricultural processes. Interception is the fraction of the total deposition on the leaf surface compared to the soil deposition and re-suspension may raise deposited material from the soil.
The concentrations of Pb and Cd in plants grown for commercial distribution are regulated by legislative standards that we used to compare concentrations measured in home-garden vegetables (Douay, 2007). The Commission of the European Communities (Reg. EC N° 1881/2006 and Reg. EC 420/2011) indicates the maximum allowable level for Cd as 0.2 mg kg-1 fresh weight (FW) for
leafy vegetables, and 0.1 mg kg-1 FW for root vegetables. The Codex Alimentarius Commission
(2001a, 2004b) sets similar levels of Cd and Pb for vegetable crops. For Pb, the European Regulation sets the Maximum Level of 0.3 mg kg-1 fresh weight for Brassica vegetables and of 0.1
mg kg-1 fresh weight for leaf vegetables. The Codex Alimentarius Commission sets the Maximum
Level of 0.1 mg kg-1 fresh weight for root/tuber vegetables including turnip and for all other
vegetables.
For the daily intake of Cd and Pb based on the consumption of locally grown vegetables, spinach consumption constituted a significantly higher proportion of these metals compared to turnip 435 440 445 450 455 460 465
consumption. The total daily intake (TDI) of Cd based on spinach consumption was not negligible, although the contamination levels were lower than the limit indicated by the EU Regulation 1881/2006. The European Food Safety Agency EFSA reported that the mean Cd oral intake in Europe is close to the tolerable weekly intake (TWI) of 2.5 µg kg-1 bodyweight, and some subgroups (vegetarians, children, smokers) can exceed the TWI by about 2-fold (EFSA 2007). Similarly, the daily intake of Pb was not negligible for all age groups and since vegetables are a staple food, a mean contribution close to 15-20% of the TDI should be considered relevant (Chen et al., 2011). These finding are quite important in view of possible increased absorption of toxic elements that may be especially harmful for children through the developmental stage.
Although the farmers were instructed not to use fertilizers or fungicide, we cannot be sure that certain organic fertilizers, such as manure, were not used during cultivation in adjacent locations. The use of compost to fertilize urban soils, a common process in urban gardens, can enhance metal solubility under certain conditions, like organic matter and clay content, aeration, moisture, soil texture, loading rate, soil pH, redox potential, cation exchange capacity (CEC), and metereological conditions (e.g., precipitation). Crops grown in uncontaminated soils can thereby accumulate hazardous levels of trace metals if the soils have been amended with contaminated products (Murray et al, 2011). Fungicide, chemical, and organic fertilizers had also been used before the study and in adjacent locations and this may have enriched the soil concentration of trace elements. The difference between washed and unwashed plant element concentration allows an estimated quantification of the metal reduction achieved by the act of washing these vegetables with tap water prior to consumption. In our study, the Pb content of spinach was reduced by more than four-fold by the act of washing with tap water. Tap water was used in our study as in standard household preparation, to remove the impurities from the soil and atmosphere. Iron was the most efficiently removed from the spinach leaves by washing. Iron is a common component of dust and adheres to the leaf surface and we showed that tap water is effective in washing off part of the deposition fraction; mobility and water solubility of contaminants are factors strictly related to the washing effect (Zwolinski et al., 1998). The results obtained in this study suggest that washing efficacy depends from the type and of contaminant considered and from its chemical status depending from its pathway in the vegetable.
6. CONCLUSION 470 475 480 485 490 495
Our study suggests that spinach urban crops situated in areas of historic or current ferroalloy industrial activities are contaminated with higher concentrations of metals than recommended by the European standards, and thus may poses a threat to human health. The high levels of soil metal-oxides, inferred by the relatively high percentage of metals in the F2 fraction, likely reflect the typical composition of ferroalloy emissions. The generally poor correlation between the metal concentrations in soils and vegetables suggests that metal concentrations in different fractions of soils extracted using the modified BCR procedure were poor predictors of phytoavailability.
Lead and Cd concentrations in washed spinach leaves were two to four times higher than the international food standard set by the Commission of the European Communities and the Codex Alimentarius Commission. Since prevention is the most effective way to protect against potential health risks, measure to reduce the TDI of these metals are necessary. The trend of higher metal concentrations in unwashed versus washed samples demonstrates that washing vegetables with tap water was able to remove metallic elements deposited on spinach leaf surface. However, washing with fresh tap water may not be sufficient for reducing the TDI of Pb in children, since even washed spinach produced in some home gardens did not conform to both international food standard guidelines for Pb concentrations.
ACKNOWLEDGEMENTS
This study was supported by funding from the European Union through its Sixth Framework Program for RTD (contract no FOOD-CT-2006- 016253). It reflects only the authors' views, and the European Commission is not liable for any use that may be made of the information contained therein. The project was supported also by award number R01ES019222 from the National Institute of Environmental Health Sciences (NIEHS). The content is solely the responsibility of the authors and does not necessarily represent the official views of the NIEHS or the National Institutes of Health. 500 505 510 515 520
REFERENCES:
Agbenin J.O., Danko M., Welp G., 2009. Soil and vegetable compositional relationships of eight potentially toxic metals in urban garden fields from northern Nigeria. Journal of the Science of Food and Agriculture 89 (1), pp. 49-54.
Agnieszka M., Witold W., 2004. Three-step extraction procedure for determination of heavy metals availability to vegetables.Anal Bioanal 380, pp. 813–817.
Anawar H.M., Garcia-Sanchez A., Regina S.I., 2008. Evaluation of various chemical extraction methods to stimate plant-available arsenic in mine soils. Chemosphere 70, pp. 1459-1467.
Bargagli, R., 1998. Piante vascolari come bioaccumulatori di Metalli in traccia: Stato dell’Arte in Italia. Biologia Ambientale In Atti del Workshop Biomonitoraggio Della Qualità dell’aria Sul Territorio Nazionale, Roma, Novembre 26-27, 1998; Sped: Roma, pp. 55-75.
BDA (Banca Dati di Composizione degli Alimenti per Studi Epidemiologici in Italia) Food Composition Database for Epidemiological Studies in Italy, European Institute of Oncology, 2008 http://www.ieo.it/bda2008/homepage.aspx.
Borgese L., Federici S., Zacco A., Gianoncelli A., Rizzo L., Smith D.R., Donna F., Lucchini R., Depero L.E., Bontempi E., 2013. Metal speciation fractionation in soils and assessment of environmental contamination in Valle Camonica, Italy. Environmental Science and Pollution Research. 20, pp. 5067-5075.
Calabrese E.J., Stanek E.J., Pekow P., Barnes R.M., 1997. Soil ingestion estimates for children residing on a superfund site. Ecotox Environ Safe 36, pp. 258-268.
Cambra K., Martínez T., Urzelai A., Alonso E., 1999. Risk analysis of a farm area near a lead and cadmium contaminated industrial site. J Soil Contam 8, pp. 527-540.
Carrizales L., Razo I., Tellez-Hernandez J.I., Torres-Nerio, R. Torres, A., Batres L.E., Cubillas A.C., Dıaz-Barriga F., 2006. Exposure to arsenic and lead of children living near a Cu-smelter in San Luis Potosi, Mexico: importance of soil contamination for exposure of children. Environmental Research 101, pp. 1-10.
Chen C., Yongzhong Q., Qiong C., Chuanyong L., 2011 Assessment of Daily Intake of Toxic Elements Due to Consumption of Vegetables, Fruits, Meat, and Seafood by Inhabitants of Xiamen, China. Vol. 76, Nr. 8, 2011 Journal of Food Science
Codex Alimentarius Commission: 2001a, Lead: Maximum Levels, Vol. 1, Codex Stan 230.
Codex Alimentarius Commission: 2004b, Report of the 36th Session of the Codex Alimentarius Committee on food Additives and Contaminants, Rotterdam, The Netherlands 2004, 22–26 March. 525 530 535 540 545 550 555
Commission of the European Communities. 2006. Commission Regulation (EC) No 1881/2006 of 19 December 2006 setting maximum levels for certain contaminants in foodstuffs. Official Journal of the European Union, L 364, pp 5-24.
De Temmerman L., Hoenig M., 2004. Vegetable Crops for Biomonitoring Lead and Cadmium Deposition. Journal of Atmospheric Chemistry 49, pp. 121-135.
Diaz-de Alba M., Galindo-Riàno M.D., Casanueva-Marenco M.J., Garcia-Vargas M., Kosore C.M., 2011. Assessment of the metal pollution, potential toxicity and speciation of sediment from Algeciras Bay (South of Spain) using chemometric tools. Journal of Hazardous Materials 190, pp. 177-187.
Dilek B.,Yasemin Bakircioglu K., Hilmi I., 2011. Investigation of trace elements in agricultural soils by BCR sequential extraction method and its transfer to wheat plants. Environ Monit Assess 175, pp. 303–314
Douay F., Roussel H., Fourrier H., Heyman C., Chateau G., 2007. Investigation of heavy metal cncentrations on urban soils, dust and vegetables nearby a former smelter site in Mortagne du Nord, northern France. J Soils Sediments 7 (3), pp. 143–146.
EFSA 2006. Opinion of the scientific panel on contaminants in the food chain on a request from the commission related to ochratoxinA in food. The EFSA Journal. 365, pp. 1–56.
EFSA 2007. Cadmium in food. Scientific Opinion of the Panel on Contaminants in the Food Chain. Question n° EFSA-Q-2007-138. Adopted on 30 January 2009
EFSA 2010. Scientific Opinion on Lead in Food. EFSA Panel on Contaminants in the Food Chain, European Food Safety Authority (EFSA), Parma, Italy. EFSA Journal, 8(4), pp. 1570-1574. EFSA. 2011. Panel on Contaminants in the Food Chain (CONTAM) Scientific Opinion on tolerable
weekly intake for cadmium. EFSA Journal, 9(2), pp. 1975-1994.
EFSA. 2012. Lead dietary exposure in the European population. EFSA Journal, 10, (7), 2831-2833. FAO/WHO. 1997. Food consumption and exposure assessment of chemicals. Report of a
WHO/FAO consultation; Geneva, Switzerland.
Favas PJC, Pratas J, Gomes MEP, Cala V., 2011. Selective chemical extraction of heavy metals in tailings and soils contaminated by mining activity: Environmental implications. Journal of Geochemical Exploration 111:160–171. doi: 10.1016/j.gexplo.2011.04.009
Ferri R., Donna F., Smith D.R., Guazzetti S., Zacco A., Rizzo L., Bontempi E., Zimmerman N.J., Lucchini R.G., 2012. Heavy metals in soil and salad in the proximity of historical ferroalloy emission. Journal of Environmental Protection 3, pp. 374-385.
560 565 570 575 580 585
Gupta A.K., Sinha S., 2006. Chemical fractionation and heavy metal accumulation in the plant of Sesamum indicum (L.) var. T55 grown on soil amended with tannery sludge: Selection of single extractants. Chemosphere 64, pp. 161-173.
Harris A.R., Davidson C.I., 2005. The role of resuspended soil in lead flows in the California South Coast Air Basin. Environmental science & technology 39(19), pp. 7410-7415.
Hinwood A.L., Sim M.R., Jolley D., de Klerk N., Bastone E.B., Gerostamoulos J., Drummer O.H., 2004. Exposure to inorganic arsenic in soil increases urinary inorganic arsenic concentrations of residents living in old mining areas. Environmental Geochemistry and Health 26, pp. 27-36. Hollander M., Wolfe D.A., 1999. Nonparametrics Statistical Methods, 2nd edition.
Wiley-Blackwell, 816 pp.
Hough R.L., Breward N., Young S.D., Crout N.M.J., Tye A.M., Moir A.M., Thornton I. 2004. Assessing potential risk of heavy metal exposure from consumption of home-produced vegetables by urban populations. Environ Health Perspect 112 (2), pp. 215-221.
Kennedy V.H., Sanchez A.L., Oughton D.H., Rowland A.P., 1997. Use of single and sequential chemical extractants to assess radionuclide and heavy metal availability from soils for roots uptake. Analyst 122, pp. 89-100.
Leclercq C., Arcella D., Piccinelli R., Sette S., Le Donne C., Turrini A. 2009. The Italian National food consumption survey INRAN-SCAI 2005-06: main results in terms of food consumption. Public Health Nutrition, 12, 12: 2504-2532.
Lucchini R.G., Albini E., Benedetti L., Borghesi S., Coccaglio R., Malara E.C., Parrinello G., Garattini S., Resola S., Alessio L. 2007. High prevalence of Parkinsonian disorders associated to manganese exposure in the vicinities of ferroalloy industries. Am J Ind Med 50 (11), pp. 788-800.
Lucchini R.G., Guazzetti S., Zoni S., Donna .F, Peter S., Zacco A., Salmistraro M., Bontempi E., Zimmerman N.J., Smith D.R., 2012. Tremor‚ olfactory and motor changes in Italian adolescents exposed to historical ferro-manganese emission. Neurotoxicology2012. 33(4):687-96
Lucchini RG, et al. Neurofunctional Dopaminergic impairment in elderly after lifetime exposure to manganese. Neurotoxicology (2014), http://dx.doi.org/10.1016/j.neuro.2014.05.006
Marin B., Giresse P., 2001. Particulate manganese and iron in recent sediments of the Gulf of Lions continental margin (north-western Mediterranean Sea): deposition and diagenetic process. Marine geology 172, pp. 147-165.
Menzies NW, Donn MJ, Kopittke PM, 2007. Evaluation of extractants for the estimation of the phytoavailable trace metals in soils. Environ. Pollut., 145, pp. 121-130.
590 595 600 605 610 615 620
Ministerial Decree. Official methods for soil chemical analysis. D.M. n. 185; Rome, Italy. September 13, 1999.
Mossop K.F., Davidson C.M., 2003. Comparison of original and modified BCR sequential extraction procedures for the fractionation of copper, iron, lead, manganese and zinc in soils and sediments. Analytica Chimica Acta 478, pp. 111-118.
Murray H., Pinchin T.A., Macfie S.M., 2011. Compost application affects metal uptake in plants grown in urban garden soils and potential human health risk. J Soils Sediments 11, pp. 815-829. Olayinka K.O., Oyeyiola A.O., Odujebe F.O., Oboh B., 2011. Uptake of potentially toxic metals by
vegetable plants grown on contaminated soil and their potential bioavailability using sequential extraction. Journal of Soil Science and Environmental Management 2(8), pp. 220-227.
Oyeyiola A.O., Olayinka K.O., Alo B.I., 2011. Comparison of three sequential extraction protocols for the fractionation of potentially toxic metals in coastal sediments. Environmental Monitoring and Assessment 172, pp. 319-327
Pruvot C., Douay F., Herve F., Waterlot C., 2006. Heavy metals in soil, crops and grass as a source of human exposure in the former mining areas. Journal of Soils and Sediments 6, pp. 215-220. Pueyo M., Mateu J., Rigol A., Vidal M., Lòpez-Sànchez J.F., Rauret G., 2008. Use of the modified
BCR three-step sequential extraction procedure for the study of trace element dynamics in contaminated soils. Environmental Pollution 152, pp. 330-341.
R Core Team, 2012. R: A Language and Environment for Statistical Computing. R Foundation for Statistical Computing, Vienna, Austria. http://www.Rproject. org/>, ISBN 3-900051-07-0. Rauret G., Lopez-Sanchez J.F., Sahuquillo A., Barahona E., Lachica M., Ure A.M., Davidson C.M.,
Gomez A., Luck D.,Bacon J., Yli-Halla M., Muntaub H., Quevauvilleri Ph., 2000. Application of a modified BCR sequential extraction (three-step) procedure for the determination of extractable trace metal contents in a sewage sludge amended soil reference material (CRM 483) complemented by a three-year stability study of acetic acid and EDTA extractable metal content. J. Environ. Monit. 2, pp. 228-233.
Rauret G., López-Sánchez J.F., Sahuquillo A., Rubio R., Davidson C., Ure A., Quevauviller Ph., 1999. Improvement of the BCR three step sequential extraction procedure prior to the certification of new sediment and soil reference materials. J. Environ. Monit. 1, pp. 57-61. Rossini Oliva S., Valdès B., 2004. Influence of Washing on Metal Concentrations in Leaf Tissue.
Communications in soil science and plant analysis 35, pp. 1543-1552.
Sacchi E., Brenna S., Fornelli Genot S.; Sale VM; Azzolina L.;Leoni M. A., 2007. Sperimentazione condotta nell’ambito del progetto di ricerca RAMET “Realizzazione di analisi del contenuto di metalli pesanti nei suoli agricoli lombardi” (dgr n. 20733 del 16/02/2005).
625 630 635 640 645 650
Sahuquillo A., Rigol A., Rauret G., 2003. Overview of the use of leaching/extraction tests for risk assessmentof trace metals in contaminated soils and sediments. Trends in Analytical Chemistry 22 (3), pp. 152-159.
Säumel I., Kotsyuk I., Hölscher M., Lenkereit C., Weber F., Kowarik I., 2012. How healthy is urban horticulture in high traffic areas? Trace metal concentrations in vegetable crops from plantings within inner city neighbourhoods in Berlin, Germany. Environmental Pollution 165, pp. 124-132.
Souci S.W., Fachmann W., Kraut H., 2008. Food Composition and Nutrition Tables, 7th revised and completed edition 7th Edition.
Tokalıoglu S., Yılmaz V. ¸ Kartal S., 2010. An Assessment on metal sources by multivariate analysis and speciation of metals in soil samples using the BCR sequential extraction procedure. Clean – Soil, Air, Water 38 (8), pp. 713-718.
Udom B.E., Mbagwu J.S.C., Adesodun J.K., Agbim N.N., 2004. Distribution of Zinc, copper, cadmium and lead in a tropical ultisol after long term disposal of sewage sludge. Environ. Int. 30, pp. 467-470.
USDA, United States Department of Agriculture, National Nutrient Database for Standard Reference, Release 24, 2011 http://www.ars.usda.gov/Services/docs.htm?docid=8964.
WHO. 2010. Food additives and contaminants (flavours; cadmium and lead). Geneva, Switzerland: Seventy-third meeting of the Joint FAO/WHO Expert Committee on Food Additives. Available online. http://www.who.int/entity/foodsafety/ publications/chem/summary73.pdf.
Yujing C., Yong-Guan Z., Rihong Z., Yizhong H., Yi Q., Jianzhong L., 2005. Exposure to metal mixtures and human health impacts in a contaminated area in Nanning, China. Environ Intern 31, pp. 784-790.
Zheng N., Wang Q., Zheng D., 2007. Health risk of Hg, Pb, Cd, Zn, and Cu to the inhabitants around Huludao Zinc Plant in China via consumption of vegetables. Science of the Total Environment 383, pp. 81-89.
Zimmerman A.J., Weindorf D.C., 2010. Heavy Metal and Trace Metal Analysis in Soil by Sequential Extraction: A Review of Procedures. International Journal of Analytical Chemistry, vol. 2010, Article ID 387803, 7 pages, 2010. doi:10.1155/2010/387803.
Zoni S, Bonetti G, Lucchini R. Olfactory functions at the intersection between environmental exposure to manganese and Parkinsonism. Trace Elem Med Biol. 2012; 26(2-3):179-82.
Zwolinski J., Matuszezyk I., Zwolinska B., 1998. Accumulation of sulphur and metals in and on pine (Pinus Sylvestris L.) and spruce (Picea Abies (L.) Karst.) needles in industrial regions in southern Poland. Folia For Plo. 40 (Ser A), pp. 47-57.
655 660 665 670 675 680 685
TABLES AND FIGURES
Table 1. Total median (and range) metal concentrations (expressed in mg kg-1 of dry mater) on surface soil determined
by BCR modified, aqua regia procedure and XRF; § (comparison between Valcamonica, Bagnolo Mella and Garda Lake);
Study sites
Heavy metals (mg/Kg) Method Valcamonica Bagnolo Mella Garda Lake
median
(IQR) median (IQR) median(IQR) p values §
Al BCR modified (4493-19169)10514 (8030-11803)10280 (3334-11201)6948 <0.0001 Cd BCR modified (1.29-4.16)2.54 (2.05-2.70)2.38 (1.00-2.60)2.04 0.00024 aqua regia procedure (0.00-3.00)1 (1.00-3.00)2 (1.00-4.00)3 2* Cr BCR modified (6.96-34.4)15.63 (13.3-30.5)18.11 (7.21-277)17.85 0.28 aqua regia procedure (47.0-120)93 (43.00-64.0050 49.00-690.0077 150* Cu XRF (25.1-416)69.93 (24.2-65.5)29.02 (36.1-237)84.21 0.0002 BCR modified (24.8-373)64.65 (23.8-58.7)31.24 (23.4-162)66.69 0.005 aqua regia procedure 74 (28.0-410) 43 (30.0-84.0) 87 (36.0-237) 120* Fe XRF (16414-37502)29037 (17547-24508)21854 (7952-23660)15813 <0.0001 BCR modified (7648-19629)14173 (8568-13654)11768 (3431-12570)9268 <0.0001 aqua regia procedure 17160 (15920-18040) 17400 (16880-17680) 15680 (13040-17320) <0.0001 Mn XRF (690-2570)1337 (552-1440)806 (442-893)577 <0.0001 BCR modified (473-2113)982 (466-1357)623 (288-747)393 <0.0001 aqua regia procedure (493-1612)1025 (555-1254)712 (315-658)437 <0.0001 Pb XRF (34.0-127)62.1 (21.4-59.3)45.6 19.0-21239.9 0.005 BCR modified (24.2-109)47.1 (27.0-50.0)43.08 (16.9-128)37.3 0.07 aqua regia procedure (36.0-125)65 (47.0-147)90 (50.0-207)64 100* Zn XRF (90.7-643)225.1 (89.7-216)178 (65.8-458)145 0.01 BCR modified (70.4-426)172 (70.3-192)128 (32.4-305)113 0.01 aqua regia procedure (92.0-845)258 (114-275)220 (58.0-474)153 150*
* Maximum allowable concentration. 690
Table 2. Median (and range) metal concentrations (mg kg-1) in different modified BCR fractions of extracted soils from
the Valcamonica (VC), Bagnolo Mella (BM) and Garda Lake (GL). P-value reflect effect of study site, using Kruskall-wallis Test; § (comparison between Valcamonica, Bagnolo Mella and Garda Lake);
Element Fraction Study site p value §
VC BM GL Al F1 32.2 (0.11-65.8) 10.1 (3.59-17.4) 0.11 (0.11-7.49) < 0.0001 F2 2120 (871-8890) 1280 (33.0-3110) 24.1 (0.90-3430) < 0.0001 F3 881 (335-1360) 820 (486-1270) 768 (342-1250) 0.15 R 7780 (3270-13900) 8620 (5980-9980) 5220 (2980-9030) 0.002 Total (BCR + R) 10500 (4490-19200) 10300 (8030-11800) 6950 (3330-11200) < 0.0001 Cd F1 0.26 (0.09-0.62) 0.44 (0.27-0.55) 0.37 (0.15-0.50) 0.01 F2 0.63 (0.40-1.69) 0.62 (0.41-0.98) 0.56 (0.30-1.08) 0.2 F3 0.09 (0.03-0.39) 0.1 (0.04-0.15) 0.15 (0.03-0.61) 0.1 R 1.43 (0.44-2.33) 1.3 (0.94-1.50) 0.86 (0.03-1.41) 0.0001 Total (BCR + R) 2.54 (1.30-4.16) 2.38 (2.05-2.71) 2.04 (1.00-2.60) 0.0002 Cr F1 0.52 (0.20-0.93) 1.58 (1.05-1.99) 0.74 (0.46-5.71) < 0.0001 F2 3.3 (1.20-13.4) 2.24 (1.45-8.04) 1.61 (0.22-253) 0.1 F3 2.82 (0.02-17.3) 2.16 (1.42-12.6) 3.74 (0.67-49.6) 0.05 R 9.04 (3.66-16.9) 9.25 (7.48-14.8) 10.3 (4.81-15.8) 0.6 Total (BCR + R) 15.63 (6.96-34.5) 18.1 (13.3-30.5) 17.8 (7.21-277) 0.3 Cu F1 1.09 (0.08-8.19) 0.079 (0.07-0.08) 0.08 (0.07-7.18) 0.0001 F2 18.1 (2.95-323) 7.07 (0.09-25.0) 0.1 (0.10-93.0) 0.0004 F3 12.6 (1.24-87.6) 6.85 (0.70-32.9) 21.9 (0.58-130) 0.02 R 24.6 (3.42-45.6) 19 (5.16-31.7) 26.3 (4.07-49.0) 0.1 Total (BCR + R) 64.6 (24.8-373) 31.2 (23.8-58.7) 66.7 (23.4-163) 0.005 Fe F1 4.37 (0.04-7.85) 0.44 (0.04-1.06) 0.71 (0.04-4.76) 0.0001 F2 2710 (1670-7850) 1290 (350-3840) 372 (6.63-5420) 0.0001 F3 571 (373-1350) 512 (240-814) 468 (147-1140) 0.07 R 10300 (3600-16400) 9710 (7700-10800) 6660 (3230-11400) 0.0003 Total (BCR + R) 14200 (7650-19600) 11800 (8570-13700) 9270.00 < 0.0001 Mn F1 165 (108-280) 124 (97.2-179) 134 (94.2-198) 0.005 F2 681 (264-1650) 419 (280-996) 205 (116-477) < 0.0001 F3 19.1 (10.7-98.6) 17 (11.0-84.5) 13.2 (5.73-80.3) 0.04 R 127 (35.2-308) 75.1 (50.7-120) 49.4 (21.7-68.0) < 0.0001 Total (BCR + R) 983 (473-2110) 623 (466-1360) 393 (288-747) < 0.0001 Pb F1 2.19 (0.74-4.46) 2.31 (0.78-4.06) 3.49 (2.24-4.84) < 0.0001 F2 35.9 (19.8-84.7) 22.1 (6.30-36.1) 7.53 (1.12-53.10) < 0.0001 F3 3.53 (0.56-25.1) 3.09 (0.56-30.9) 11.7 (0.57-88.9) 0.01 R 4.33 (0.60-16.5) 3.67 (2.23-12.7) 5.3 (0.62-31.2) 0.4 Total (BCR + R) 47.1 (24.2-109) 43.1 (27.0-50.0) 37.3 (16.9-128) 0.07 Zn F1 34.5 (10.1-117) 28.7 (5.76-37.7) 11.5 (1.29-40.6) < 0.0001 F2 58.2 (22.6-247) 47.8 (33.1-70.1) 35.4 (4.63-108) 0.03 F3 7.52 (2.16-24.7) 6.86 (4.50-23.8) 8.62 (1.49-156) 0.5 R 50.8 (16.3-149) 45.3 (26.7-70.6) 37.4 (13.8-102) 0.1 Total (BCR + R) 172 (70.4-426) 128 (70.3-192) 113 (32.4-305) 0.01 700
Table 3. Median metal concentrations (and range, in mg Kg-1 of fresh vegetable) in unwashed and washed spinach “S”
(Spinacea Oleracea) and turnip “B” (Brassica Rapa) from home gardens from the Valcamonica (VC), Bagnolo Mella (BM) and Garda Lake (GL) study sites. P-value reflect effect of study site, using Kruskall-wallis Test; § (comparison between Valcamonica, Bagnolo Mella and Garda Lake); The N per study site and vegetable type is given in
parentheses.
Element Plant Study site p value §
VC (S=21; B=9) BM (S=6; B=9) GL (S=20; B=22) Cd Unwashed spinach 0.05 (0.02-0.14) 0.06 (0.02-0.13) 0.06 (0.01-0.36) 0.63 Washed spinach (0.01-0.10)0.04 (0.01-0.06)0.02 (0.01-0.31)0.05 0.07 Turnip (0.01-0.02)0.01 (0.01-0.04)0.02 (0.01-0.04)0.01 0.002 Cu Unwashed spinach (0.67-3.10)0.9 (0.82-3.06)2.11 (0.52-40.50)1.62 0.05 Washed spinach (0.37-1.00)0.72 (0.42-1.04)0.56 (0.40-14.50)0.85 0.15 Turnip (0.28-1.08)0.4 (0.28-0.59)0.37 (0.36-5.21)0.76 <0.0001 Fe Unwashed spinach (20.0-510)93.2 (312-820)537 (18.8-639)166 0.003 Washed spinach (9.20-96.8)37.5 (8.92-43.6)28.9 (7.28-126)30.5 0.47 Turnip (2.95-13.7)5.48 (3.70-6.90)4.14 (1.62-18.7)4.31 0.32 Mn Unwashed spinach (0.58-16.4)5.43 (1.31-32.0)7.77 (1.60-18.0)4.87 0.86 Washed spinach (0.15-4.73)1.82 (0.06-2.34)0.59 (0.95-8.50)2.12 0.05 Turnip (0.52-1.52)0.92 (0.86-1.74)1.08 (0.71-1.50)1.01 0.05 Pb Unwashed spinach (0.07-2.20)0.69 (0.21-3.69)0.95 (0.08-3.30)0.89 0.21 Washed spinach (0.04-0.43)0.15 (0.04-0.19)0.07 (0.07-1.00)0.21 0.03 Turnip (0.00-0.06)0.01 (0.01-0.03)0.02 (0.01-0.13)0.02 0.06 Zn Unwashed spinach (5.60-28.0)9.03 (3.95-13.8)9.54 (7.44-20.0)10.15 0.18 Washed spinach (2.80-18.0)6.1 (2.97-5.33)4.37 (4.10-13.1)6.99 0.006 Turnip (1.22-4.68)2.18 (2.21-4.91)2.81 (1.04-7.50)2.59 0.03
Table 4. Mean concentrations of metals in vegetables (mg kg-1) reported in the literature. 705
Water and trace elements
Reference
Italian Food Composition database (BDA, 2008)
Food Composition and Nutrition Tables (Souci et al., 2008)
USDA National Nutrient Database for Standard Reference, (USDA, 2011) Spinach Water 90.1 g 91.2 g 91.4 g Cu 1.6 mg kg-1 0.9 mg kg-1 1.3 mg kg-1 Fe 29.000 mg kg-1 34.000 mg kg-1 27.000 mg kg-1 Mn / 5.99 mg kg-1 8.97 mg kg-1 Zn 14.3 mg kg-1 6.7 mg kg-1 5.3 mg kg-1 Turnip Water 93.3 g 89.9 g 91.87 g Cu / 0.56 mg kg-1 0.85 mg kg-1 Fe 6 mg kg-1 3.83 mg kg-1 3 mg kg-1 Mn / 0.68 mg kg-1 1.34 mg kg-1 Zn 0.80 mg kg-1 2.30 mg kg-1 2.7 mg kg-1 715 720 725
Table 5: Estimate of the contribution of vegetable consumption to the daily intake of Pb and Cd for children (3-10 years
old) and ages >10 yrs from the three study sites: Garda Lake (GL), Valcamonica (VC), Bagnolo Mella (BM). Data are
expressed in µg kg-1 bw day-1 and as a percentage of the Tolerable Daily Intake of 0.36 µg kg-1 bw for Cd and the mean
lifetime dietary exposure for Pb of 1.03 µg kg-1 bw day-1 for 3-10 yrs old children and of 0.68 µg kg-1 bw day-1 for all
ages (ages >10 yrs).
Spinach Turnip
Pb Cd Pb Cd
VC BM GL VC BM GL VC BM GL VC BM GL
Children
mean daily intake (% ) 0.1 6 (15) 0.08 (8) 0.26(25) 0.04(11) 0.03(8) 0.07(19) 0.01(1) 0.01(1) 0.02(2) 0.01(2) 0.01(4) 0.01(3) 95th percentile (%) 0.3 3 (32) 0.15 (15) 0.59 (57) 0.09 (26) 0.05 (15) 0.21 (58) 0.03 (3) 0.02 (2) 0.03 (3) 0.01 (3) 0.03 (7) 0.03 (8) All ages mean daily intake (% ) 0.1 3 (18) 0.07 (10) 0.20 (30) 0.03 (9) 0.02 (6) 0.05 (15) 0.00 (0) 0.00 (1) 0.00 (1) 0.00 (1) 0.01 (2) 0.00 (1) 95th percentile (%) 0.4 0 (39) 0.19 (18) 0.70 (68) 0.08 (21) 0.04 (12) 0.16 (46) 0.00 (1) 0.00 (1) 0.00 (1) 0.00 (1) 0.01 (3) 0.01 (3) 730 735 740 745 750
Fig 1: Collection sites (arrows) and location of the ferroalloy plants (pins) 755 760 765 770 775 780 785 790 795 800
Fig 2: Bland Altman plot comparing Mn in soil measured with XRF, ICP, FAAS methods. Bland Altman plots
represent the agreement between two methods, expressed as the mean difference between the measurements as a function of their mean. The broken line represents the mean difference and the dotted lines represent the 95% confidence interval of the differences.
% F1 % F2 % F3 % F4 0 50 100 Valcamonica A l C d C r % F1 % F2 % F3 % F4 0 20 40 60 80 100 Garda lake A l C d C r C u % F1 % F2 % F3 % F4 020 40 60 80 100 Bagnolo Mella A l C d C r C u
Fig 3. Relative proportion, as a percentage of the total, of metals in each of the 4 sequential extraction fractions (F1; F2;
F3; F4 or R) for soils collected in the three study areas.
A
B 810