Global, regional, and national age-sex-specific
mortality and
life expectancy, 1950–2017: a systematic analysis for the
Global Burden of Disease Study 2017
GBD 2017 Mortality Collaborators*
Summary
Background
Assessments of age-specific mortality and life expectancy have been done by the UN Population Division,
Department of Economics and Social Affairs (UNPOP), the United States Census Bureau, WHO, and as part of
previous iterations of the Global Burden of Diseases, Injuries, and Risk Factors Study (GBD). Previous iterations of
the GBD used population estimates from UNPOP, which were not derived in a way that was internally consistent
with the estimates of the numbers of deaths in the GBD. The present iteration of the GBD, GBD 2017, improves on
previous assessments and provides timely estimates of the mortality experience of populations globally.
Methods
The GBD uses all available data to produce estimates of mortality rates between 1950 and 2017 for 23 age
groups, both sexes, and 918 locations, including 195 countries and territories and subnational locations for
16 countries. Data used include vital registration systems, sample registration systems, household surveys (complete
birth histories, summary birth histories, sibling histories), censuses (summary birth histories, household deaths),
and Demographic Surveillance Sites. In total, this analysis used 8259 data sources. Estimates of the probability of
death between birth and the age of 5 years and between ages 15 and 60 years are generated and then input into a
model life table system to produce complete life tables for all locations and years. Fatal discontinuities and mortality
due to HIV/AIDS are analysed separately and then incorporated into
the estimation. We analyse the relationship
between age-specific mortality and development status using the Socio-demographic Index, a composite measure
based on fertility under the age of 25 years, education, and income. There are four main methodological
improvements in GBD 2017 compared with GBD 2016: 622 additional data sources have been incorporated; new
estimates of population, generated by the GBD study, are used; statistical methods used in different components of
the analysis have been further standardised and improved; and the analysis has been extended backwards in time by
two decades to start in 1950.
Findings
Globally, 18·7% (95% uncertainty interval 18·4–19·0) of deaths were registered in 1950 and that proportion
has been steadily increasing since, with 58·8% (58·2–59·3) of all deaths being registered in 2015. At the global level,
between 1950 and 2017, life expectancy increased from 48·1 years (46·5–49·6) to 70·5 years (70·1–70·8) for men
and from 52·9 years (51·7–54·0) to 75·6 years (75·3–75·9) for women. Despite this overall progress, there remains
substantial variation in life expectancy at birth in 2017, which ranges from 49·1 years (46·5–51·7) for men in the
Central African Republic to 87·6 years (86·9–88·1) among women in Singapore. The greatest progress across age
groups was for children younger than 5 years; under-5 mortality dropped from 216·0 deaths (196·3–238·1) per
1000 livebirths in 1950 to 38·9 deaths (35·6–42·83) per 1000 livebirths in 2017, with huge reductions across
countries. Nevertheless, there were still 5·4 million (5·2–5·6) deaths among children younger than 5 years in the
world in 2017. Progress has been less pronounced and more variable for adults, especially for adult males, who had
stagnant or increasing mortality rates in several countries. The gap between male and female life expectancy between
1950 and 2017, while relatively stable at the global level, shows distinctive patterns across super-regions and has
consistently been the largest in central Europe, eastern Europe, and central Asia, and smallest in south Asia.
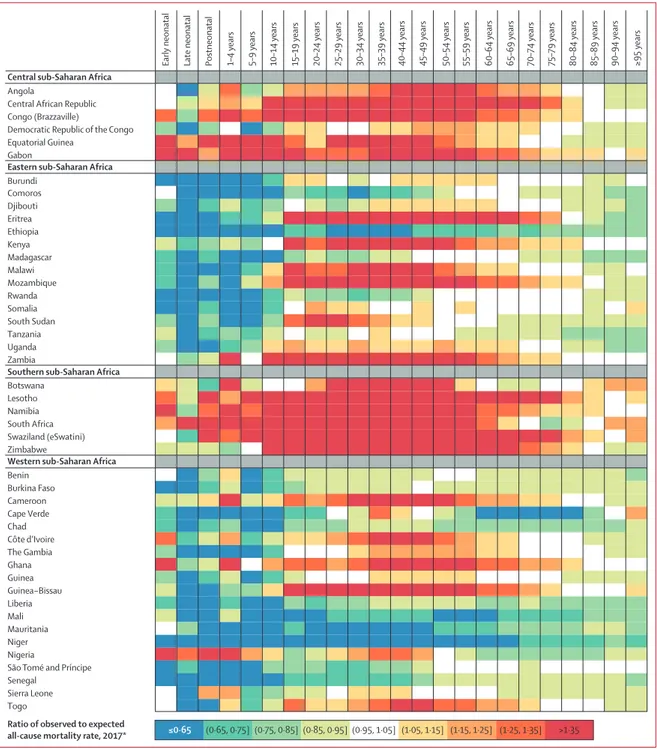
Performance was also variable across countries and time in observed mortality rates compared with those expected
on the basis of development.
Interpretation
This analysis of age-sex-specific mortality shows that there are remarkably complex patterns in
population mortality across countries. The findings of this study highlight global successes, such as the large decline
in under-5 mortality, which reflects significant local, national, and global commitment and investment over several
decades. However, they also bring attention to mortality patterns that are a cause for concern, particularly among
adult men and, to a lesser extent, women, whose mortality rates have stagnated in many countries over the time
period of this study, and in some cases are increasing.
Funding
Bill & Melinda Gates Foundation.
Copyright
© 2018 The Author(s). Published by Elsevier Ltd. This is an Open Access article under the CC BY 4.0 license.
Lancet 2018; 392: 1684–735
This online publication has been corrected. The corrected version first appeared at thelancet.com on June 20, 2019 *Collaborators listed at the end of the paper Correspondence to: Prof Christopher J L Murray, Institute for Health Metrics and Evaluation, Seattle, WA 98121, USA [email protected]
Several organisations report on aspects of all-cause mortality or
life expectancy: the UN Population Division, Department of
Economics and Social Affairs (UNPOP), the United States Census
Bureau, and WHO. Additionally, previous iterations of the Global
Burden of Disease Study (GBD) have produced these estimates
on an annual basis. UNPOP reports age-specific mortality by
5-year age groups for 162 countries and for time periods that
cover 5 calendar years; these estimates are updated every 2 years
(most recently in June, 2017). The United States Census Bureau
produces mortality assessments for 15–25 countries per year,
and WHO reports periodically on life expectancy and sometimes
on other measures of mortality and bases its estimates on
results from the UNPOP. The most recent release of estimates by
WHO was in January, 2017, based on UNPOP estimates from
2015. GBD 2016 provided comprehensive assessment of
age-sex-specific mortality for 195 countries and territories from
1970 to 2016 that were compliant with the Guidelines on
Accurate and Transparent Reporting of Health Estimates.
Added value of this study
The most important
changes in GBD 2017 are the independent
estimation of population and a comprehensive update on
fertility, which are described in a separate paper. There are several
countries with significant differences in population size between
the UNPOP estimates and the new GBD estimates. Since
population is the denominator for mortality calculations, this
leads to substantial changes in life expectancy and age-specific
mortality rates in several countries. There were four major data
additions and improvements that related to the estimation of
mortality. First, for the estimation of population size, we
systematically searched for census data and found data from
1257 censuses, which are now used in the analysis and which
enabled an extended analysis of completeness using death
distribution methods in more locations than previous iterations.
Second, in the estimation of adult mortality, we included data
from 31 Demographic Surveillance Sites (DSS) which were
adjusted based on the relationship between DSS under-5 death
rates and national under-5 death rates. Third, we used published
sources to create a database of fatal discontinuities from conflicts
and natural disasters that extends back to 1950; each fatal
discontinuity has been given a unique ID that tags the reported
deaths to a location, date, and type of discontinuity. Fourth, GBD
2017 included an additional 622 data sources that were not
available for GBD 2016 and which do not fall into the three
categories already described. The main methodological
improvements
fall into two categories: the first category is
enhancements to the modelling framework, which improved the
estimation of both child mortality, defined as the probability of
death below the age of 5 years, and adult mortality, a term we use
to refer to the probability of death between ages 15 and 60 years.
For child mortality, we standardised hyperparameter selection for
the spatiotemporal Gaussian process regression models, which
across time. For adult mortality, we also standardised
hyperparameter selection and added child mortality as a covariate
to the model. These changes had minimal effect on the mean
estimate but changed the width of the uncertainty intervals in
small populations and locations with sparse data. The second
category encompasses three substantial improvements to the
GBD model life table system: first, we revised the entire database
to reflect the change in population counts. Second, each life table
in the database was assigned a quality score using explicit criteria
related to the variance in the slope of the death rate with respect
to age, reductions in mortality at older ages compared with
younger ages (age >60 years), and other unexpected crossovers.
On the basis of these quality scores, life tables have been assigned
to three categories: high quality for universal use, acceptable
quality for use in the creation of location-specific standards,
and unacceptable quality. Third, we estimated complete
single-year life tables for each sex, location, and year instead of
abridged life tables as in previous iterations of the GBD.
In GBD 2017, for the first time, we are reporting a complete time
series of trends in age-specific mortality and life expectancy since
1950. The extension of the analysis back in time provides the
opportunity to analyse and report on longer-term trends in
age-specific mortality.
Implications of all the available evidence
By using internally consistent estimates of deaths, births, and
population over time, this analysis of trends in age-sex-specific
death rates and summary measures such as life expectancy
provides important perspectives on how mortality has been
evolving since 1950. The findings of this study highlight global
successes, such as the remarkable decline in under-5 mortality.
This great success story reflects significant local, national, and
global commitment and investment over several decades,
a commitment that has intensified since the turn of the century.
At the same time, our findings also bring attention to mortality
patterns that are cause for concern, particularly among men
aged 20–45 years and, to a lesser extent, women aged
20–45 years. In these groups, our findings show mortality rates
that have stagnated over the time period covered by this study,
and in some cases, are increasing. Comparing levels of mortality
to those expected on the basis of development status, as
measured with the Socio-demographic Index, provides insights
into which countries have achieved lower and which countries
are experiencing higher mortality rates than would be expected
based on their level of development. Our findings show
enormous variation in progress achieved across locations and
ages, with countries that are performing better than expected
in all regions of the world. Our results also highlight that greater
emphasis needs to be placed on understanding the drivers of
success for countries that have performed better than expected
and that urgent attention needs to be brought to those
countries that are lagging behind.
See Online for appendix 1 For the statistical code see https://github.com/ihmeuw/ ihme-modeling
Introduction
Measurement of mortality has always been crucial for
populations, and mortality is a quantity that societies have
attempted to track since ancient times.
1,2More recently, its
relevance and importance have been highlighted in the
global agenda in the form of the health-related Sustainable
Development Goals (SDGs), which not only include
two indicators expressly focused on all-cause mortality
(SDG indicators 3.2.1, under-5 mortality, and 3.2.2,
neonatal mortality), but also death registration (SDG
indicator 17.19.2c) and ten indicators of cause-specific or
risk-attributable mortality.
3The prominence of mortality
among the health-related SDGs intensifies the need for
comparable, robust measure ments of mortality that can be
used for monitoring progress on mortality levels and
trends across countries. National governments and
international agencies alike need reliable evidence to
identify and then prioritise addressing the largest
challenges in improving survival, particularly during the
SDG era.
Amid global gains in life expectancy and significant
reductions in child mortality over the past few decades,
concerning trends have surfaced in several countries and
demographic groups, which have been attributed to a wide
range of determinants of health.
4–8For example, although
many high-income countries, including the USA and
the UK, experienced large gains in life expectancy for
many decades, the pace of progress has stalled in recent
years, particularly in the past decade, and within-country
inequalities in life expectancy have widened.
9–14For other
countries, such as Syria and Yemen, civil war has effectively
erased—and reversed—years of steady gains.
14,15In Mexico,
studies have highlighted a combination of surging
interpersonal violence and non-communicable diseases
(NCDs) as the main factors underlying rising age-specific
mortality among adult men, while in the USA, drug use
disorders, suicide, cirrhosis, and diabetes are considered
to be among the main culprits for plateaued mortality
improvements among men.
9,10,11,16Increasing rates of
obesity are also viewed as a probable factor underlying the
slowing of progress in female life expectancy in various
countries.
17–19Changes in age-specific mortality rates and
life expectancy can be used to track the impact of
population-wide health threats, such as the HIV epidemic
in sub-Saharan Africa, and also to quantify
un-characteristically high mortality experiences, such as the
excess adult male mortality in central and eastern
European countries during 1990s.
20–23Accurate monitoring
of levels and trends of mortality on a timely basis can
provide crucial information for deploying resources and
effective interventions at the population level.
The Global Burden of Diseases, Injuries, and Risk
Factors Study (GBD) provides the only source of annually
updated age-sex-specific mortality for countries across the
world. Three other analytical efforts exist that provide
estimates of age-specific mortality for a broad set of
countries; however, we believe that these are not as
comprehensive or timely as the GBD. The United Nations
Population Division, Department of Economics and
Social Affairs (UNPOP) has reported on life expectancy
and age-specific mortality for 5-year calendar intervals by
age, sex, and country since 2005 and for 201 countries.
Their estimates are updated bian nually; however, the
estimates are not reported with uncertainty intervals
(UIs).
24The US Census Bureau analyses only
15–25 countries per year and updates demographic
estimates for them.
25WHO estimates of mortality are
largely based on UNPOP estimates that have been
interpolated to single years with some modifications for
countries with complete vital registration (VR).
26In
addition to these cross-national efforts, many countries
produce their own estimates of age-specific mortality,
which often differ from the international assessments.
27–29GBD 2017 represents the third iteration of the annual
updates of the GBD.
14,30This version of the GBD reports on
trends in age-specific mortality and summary measures
of mortality, such as life expectancy, with four main
improvements. First, new data sources that have been
released or reported since GBD 2016 have been
incor-porated. Second, for the first time, estimates of
age-sex-specific population generated in the GBD are used in the
estimation of all-cause mortality, whereas previous efforts
by the GBD used the UN Population Division estimates of
population by age and sex.
31Third, statistical methods used
in different components of the analysis have been further
standardised and improved. Lastly, we have extended the
analysis and reporting of age-specific mortality back to
1950 to further contribute to research and analyses of
long-term trends in mortality and life expectancy.
Methods
Overview
As with GBD 2016, this analysis adheres to the Guidelines
for Accurate and Transparent Health Estimates Reporting
(GATHER) standards developed by WHO and others.
32A
table detailing our adherence to GATHER is included in
appendix 1; statistical code used in the entire process
is publicly available online. Analyses were done with
Python versions 2.5.4 and 2.7.3, Stata version 13.1, and
R version 3.1.2.
The methods used to produce estimates of age-specific
mortality remain similar to those used in GBD 2016.
Here we provide a broad overview and highlight the
major changes since GBD 2016. All other details are
included in appendix 1.
Geographical units and time periods
The GBD is hierarchically organised by geographic units
or locations, with seven super-regions, 21 regions nested
within those super-regions, and 195 countries or territories
within the 21 regions.
Each year, GBD includes
sub-national analyses for a few new countries and continues to
provide subnational estimates for countries that were
added in previous cycles. Subnational estimation in GBD
See Online for appendix 2
and the UK [regional level]; GBD 2015: Brazil, India,
Japan, Kenya, South Africa, Sweden, and the USA; GBD
2016: Indonesia and the UK [local government authority
level]). All analyses are at the first level of administrative
organisation within each country except for New Zealand
(by Māori ethnicity), Sweden (by Stockholm and
non-Stockholm), and the UK (by local government authorities).
All subnational estimates for these countries were
incorporated into model development and evaluation as
part of GBD 2017. To meet data use requirements, in this
publication we present all subnational estimates excluding
those pending publication (Brazil, India, Japan, Kenya,
Mexico, Sweden, the UK, and the USA); these results are
presented in appendix tables and figures (appendix 2).
Subnational estimates for countries with populations
larger than 200 million (as measured with our most recent
year of published estimates) that have not yet been
published elsewhere are presented wherever estimates are
illustrated with maps, but are not included in data tables.
Data and data processing
In the estimation of age-specific mortality for GBD 2017,
we used five types of data. These were data from VR
systems, sample registration systems, household surveys
(complete birth histories, summary birth histories, sibling
histories), censuses (summary birth histories, household
deaths), and Demographic Surveillance Sites (DSS).
The most robust
source for estimating age-specific
mortality is a VR system that records all deaths by
age, sex, and location. Our analysis of mortality starts
with collating all publicly available VR data plus data
shared directly by governments or GBD collaborators
from VR systems. We evaluate the completeness of VR
data separately for deaths under the age of 5 years and
deaths over the age of 15 years. For under-5 deaths, we
statistically compare VR-based death rates with those
recorded in censuses or surveys. For deaths over the
age of 15 years, we apply three methods for detecting
under-registration: generalised growth balance, synthetic
extinct generations, and a hybrid method that uses both
methods.
33–38These methods are col lect ively described
as death distribution methods because they use the
demographic balance equation to infer completeness
of registration. Age misreporting and migration affect
these methods.
33,38We used the spatiotemporal regression
framework with the results of these methods for all
intercensal intervals to produce a coherent time series of
completeness for each location. For this step, the first
stage of the model uses completeness of child death
registration as a covariate and then applies time and
space weights on the residuals to produce a smoothed
result. In some countries, sample registration systems
are operated wherein events are recorded in detail for
a representative sample of communities within those
distribution methods analysis to the national level. This
study considers a country to have complete VR when it
used a civil registration system, vital statistics, or sample
registration system that captures at least 95% of all
deaths within the country. When calculating death rates
for under-5 mortality, adult mortality, or empirical life
tables, we used the GBD population estimates by age,
sex, location, and year as the denominator.
31In addition to VR data, for the estimation of under-5
death rates, we use data from complete birth histories
collected through household survey programmes,
including the World Fertility Survey, Demographic and
Health Surveys, some Multiple Indicator Cluster Surveys,
and various other national surveys. A wider set of surveys
and many censuses also collect data on the number of
livebirths for a woman and the number of these children
who are still surviving. This information is called a
summary birth history and can yield an unbiased
assessment of the trend in the under-5 death rate.
39Assessments of adult mortality, in addition to VR
and sample registration data, use survey data collected
on sibling histories. A sibling history means that a
respondent is asked to report on the survival or death of
each of their siblings; in other words, the respondent
provides a complete birth history for their mother. Sibling
histories are subject to survivor bias and recall bias.
Sibling history data are processed for GBD using methods
that address these limitations.
40Some surveys and some
censuses also use information on deaths in a
house-hold over some recent time interval—for example, the
past 12 months. Studies suggest that respondents
can over-report or under-report deaths of household
members.
41We apply death distribution methods to
assess completeness, which can be greater than 100% due
to tele scoping of event reporting, which happens when a
respondent reports an event that happened before the
recall period as if it happened during the recall period.
For GBD 2017, we also included DSS data on adult
mortality for the first time, specifically on the probability
of death between the ages of 15 and 60 years (45q15),
from local communities that are under direct
surveil-lance. Because these DSS communities are not
nation-ally representative, we adjusted the level of 45q15 based
on the ratio of the probability of death from birth to age
5 years (5q0) from the DSS to the national 5q0, taking
into account that the relationship between 5q0 and
45q15 changes as the level of 5q0 declines because, on
average, there are larger declines in 5q0 than in 45q15
over time.
New data for GBD 2017 compared to GBD 2016
In GBD 2017, we have added 458 location-years of VR data
at the national level and 9 location-years of VR data at the
subnational level compared with GBD 2016. We also
included an additional 62 complete birth history sources at
the national level, 12 complete birth history sources at the
subnational level, 72 national summary birth history
sources, and 16 subnational summary birth history data
sources. 11 national and seven subnational sibling history
surveys were also added. We included 1529 datapoints
from DSSs in 15 countries. The total numbers of datapoints
used were 181 625 for under-5 mortality estimation and
63
234 for adult mortality estimation. We also used
35 177 empirical life tables in the all-cause mortality
database for GBD 2017. Appendix 1 provides complete lists
of data availability and data sources by location; these are
also available using our online source tool, the Global
Health Data Exchange. The addition of these data has
provided increasingly accurate mortality metrics in many
countries over all years estimated in GBD.
Estimating under-5 mortality and more detailed age
intervals below 5 years
Using all the VR, complete birth history, and summary
birth history data available for each country, we estimate
the time trends from 1950 to 2017 for each location. We use
spatiotemporal Gaussian process regression (ST-GPR) to
estimate time trends. This model has four components.
First, it includes three covariates: lag-distributed income
(LDI) per capita, average years of schooling for women
aged 15–49 years, and the crude rate of death from
HIV/AIDS.
42–44Second, it includes random effects for each
source of data in each country, where a source refers to a
particular survey or census. Using the random effects, data
are adjusted to the reference source for each country. The
reference source is VR in countries with complete VR and
complete birth histories in countries without complete VR.
In some locations, reference sources are selected on the
basis of expert knowledge of a country and its data sources
provided by GBD collaborators. The third component of
the model borrows strength over space and time by
smoothing the residuals; the degree of smoothing is
controlled by three hyperparameters. These
hyper-parameters are a time weight (lambda), a space weight
(zeta), and a temporal correlation weight (scale). Additional
details on the selection of the hyper
parameters are
included in appendix 1 section 2.2. The fourth component
of the model uses the output after the first three
components have been run as the mean prior in a
Gaussian process regression. Gaussian process regression
also includes four hyperparameters, lambda, zeta, scale,
and an additional hyperparameter, amplitude. Details on
these hyperparameters are included in appendix 1. In GBD
2017, to standardise our analysis further, we have opted to
use the same amplitude for all locations. The value for
amplitude is based on the analysis of variation over time in
countries with complete VR that is not explained by the
covariates.
We use a multiphase approach to generate age-specific
and age-sex-specific under-5 mortality. We first model the
ratio of male to female 5q0. Next, we run separate models
to estimate the probability of death for each sex and age
group, specifically early neonatal (0–6 days), late neonatal
(7–27 days), postneonatal (28–364 days), infant mortality
(<1 year), and childhood mortality (between 1 and 5 years).
These are run to take advantage of greater data density
for both the ratio of male to female mortality and the
split between infant mortality and childhood mortality
as compared with the split of infant mortality into
the components of early neonatal, late neonatal, and
postneonatal. Each is modelled using ST-GPR. Results of
the sex-ratio model are first applied to derive sex-specific
under-5 death rates (U5MR). Next, the probability of death
from birth to the exact age of 1 year and from age 1 year to
the exact age of 5 years are transformed to conditional
probabilities and scaled to the sex-specific U5MR
estimates. This is done to ensure that the value of 1 minus
the probabilities from birth to the exact age of 1 year and
from age 1 year to the exact age of 5 years equals the
probability of death between birth and the exact age
of 5 years. Lastly, early neonatal, late neonatal, and
postneonatal model results are transformed to conditional
probabilities and scaled in the same manner to equal the
sex-specific probability of death from birth to the exact
age of 1 year. More information on the models, model
hyperparameters, and scaling can be found in appendix 1
section 2.2.
Estimating the probability of death between ages
15 and 60 years
Data on the probability of death between the ages
of 15 and 60 years are also modelled using ST-GPR.
In the first stage model, we use LDI per capita, average
years of schooling for the population aged 15–59 years,
the crude rate of death from HIV/AIDS, and the under-5
mortality rate as covariates.
42–44Under-5 mortality rate was
not used as a covariate in GBD 2016, but we found that
the model, which is now estimating for a longer time
period going back to 1950, performs better when this
covariate is included. We model the data for males and
females together and include a dummy variable for sex in
the model. In GBD 2016, we had run separate models for
males and females, but this had yielded implausible sex
ratios of adult mortality rates in specific location-years.
More details, including hyperparameters for the ST-GPR
model, are described in appendix 1 section 2.3.
GBD model life table system and the database of
empirical life tables
To produce a complete set of age-specific mortality rates
(an abridged life table) for each location, we used the
GBD model life table system, which identifies a reference
life table for each location, year, and sex, on the basis of
the nearest matches found in our empirical life table
database.
14As we have revised the population
denomi-nators used to create the empirical life tables in GBD 2017,
we have substantially updated and revised the database of
empirical life tables as well. In previous GBD iterations,
For the Global Health DataExchange see http://ghdx. healthdata.org/
of life tables that meet inclusion criteria: a universal set
that is used for all locations to identify matches and a
location-specific set that is used for each location along
with the universal set. We have formalised the inclusion
criteria for life tables for both the location-specific and the
universal set, and those are listed in section 2.4 of
appendix 1. Life tables that meet all of the general
inclusion criteria but not all of the universal life table
inclusion criteria are categor ised as location-specific life
tables. For each life table, within each location, we sort
life tables by year and generate smoothed life tables using
moving averages of widths 3, 5, and 7 adjacent years
within each location. This smooth ing helps to address
jumps or drops in age-specific mortality in locations
where small numbers of deaths resulted in high variability
of mortality patterns across age. After separately
categor-ising each life table, we keep the least-smoothed of the
candidate life tables within each life table set. The
smoothing process and inclusion criteria help to address
implausible age patterns from countries with small
populations, unstable death rates, or poor data quality.
We have also set the number of matches searched for in
the databases to be 100 for all locations; to ensure that
locations with high-quality data primarily rely on their
own age patterns of mortality, we have modified the
space-time weighting scheme through a 25-fold increase
in the country-specific weights compared with GBD 2016,
with an additional 15-fold increase in 0-year and 1-year lag
country-specific weights and a three-fold increase in the
2-year, 3-year, and 4-year lag country-specific weights.
We also generated a new geographical strata of life table
weights for subnational locations that are within the same
country, which were assigned the same value as the
original GBD 2016 country-specific weights.
For both all-cause mortality and cause-specific mortality
analyses in GBD, we amassed a comprehensive database
on human mortality from full VR systems and sample
VR systems such as the Sample Registration System
(SRS)
from India and the Disease Surveillance Point
system from China. These data sources provided a total
of 42 138 empirical life tables, which also include
sub-national locations. After applying inclusion criteria, we
use 35 177 life tables, of which 10 885 are universal and
24 292 location-specific. The GBD model life tables varied
in quality in accordance with the coverage of a location’s
VR: for locations where VR coverage was high, the
stan-dard was overwhelmingly derived from observed mortality
patterns, whereas in locations where VR coverage was low,
the standard was based on locations with similar under-5
and adult mortality rates, with more weight given to life
tables that were closer geographically and temporally.
The selection of geographically and temporally similar
locations helped to capture differences in mortality
patterns by age due to specific causes of death.
single-year life tables for all locations from the abridged
life tables after the HIV/AIDS mortality reconcilliation
process
and the addition of fatal discontinuities. Our
method for generating single-year probabilities of
death that are consistent with the abridged life table
probabilities of death and known data on single-year
patterns is described in the GBD 2017 population and
fertility publication.
31Fatal discontinuities
Fatal discontinuities are idiosyncratic increases in mortality
that would affect long-term mortality trends if modelled
using the all-cause mortality estimation process, and as a
result, are estimated separately. Events categorised as fatal
discontinuities are epidemics (such as Ebola virus disease
or cholera); natural disasters, major technological or
transport accidents, and war and terrorism. The specific
data sources used to compile fatal discontinuities can be
explored using the online source tool, the Global Health
Data Exchange,
and are described in detail in appendix 1
1950 1955 1960 1965 1970 1975 1980 1985 1990 1995 2000 2005 2010 2016 0 25 50 75 100 Completeness of death registration (%) Year GBD super-region
Global Central Europe, eastern Europe, and central Asia High income
Latin America and Caribbean North Africa and Middle East South Asia
Southeast Asia, east Asia, and Oceania Sub−Saharan Africa
95% completeness threshold
Figure 1: Estimated proportion of deaths that are registered and reported globally and by GBD super-region,
for both sexes combined, 1950–2016
Each line represents the proportion of deaths that are registered and reported for a given GBD super-region or globally from 1950 to 2016. The reason for the dips in the most recent years is that lags in reporting mean that estimated deaths are higher than what is reported, resulting in a huge drop in completeness from 2015, where the reported deaths are more complete. GBD=Global Burden of Diseases, Injuries, and Risk Factors Study.
section 4. Estimates from high-quality VR systems were
included instead of esti mates from other sources in the
event that conflicting sources were identified for a fatal
discontinuity, with few exceptions when there was evidence
to suggest that the VR system was compromised by the
event. Regional, cause-specific UIs were used to estimate
uncertainty for events where only point-estimate mortality
data were available.
For GBD 2017, we have recoded the locations of all
events using a new suite of software developed in-house
to match differently coded locations in the fatal
discon-tinuities database to GBD locations, taking advantage of
detailed location information that was presented in
non-standardised ways—eg, sources that included the name
of a city or village instead of latitude and longitude.
We first overlaid the portions of the database with
latitude-longitude coordinates to the most detailed GBD
location. When coordinates were not available, we used
three web-based geocoding services—the Google Maps,
OpenStreetMap, and Geonames geocoding application
programming interfaces—to get a set of possible latitude
and longitude coordinates from the location, overlaid
those coordinates on to GBD locations, and then used
the most common result from the three services to
assign a GBD location.
Since discontinuities for recent years
are not well
tracked in the available databases, we have supplemented
these data bases with online searches. For GBD 2017, we
syste matised the identification of events missing from
our database by mining Twitter accounts of major news
providers for common terms associated with such
events, like “earthquake” and “casualties.” This provided
62 events. Once events were identified, news reports of
death totals, location, and date were used.
The age pattern of deaths is rarely identified in
data-bases of fatal discontinuities. In order to estimate an age
and sex distribution, events were first assigned to a GBD
cause. Events were then split based on both the global
age and sex distribution of that cause of death and the
age and sex distribution of the population in the GBD
location of the event, following the GBD causes of death
age-sex-splitting algorithm. The main effect of this effort
is that we are much less likely to miss shocks or allocate
them to the wrong subnational location.
HIV/AIDS in countries with large epidemics and
incomplete VR
We produced estimates of adult HIV/AIDS incidence
and prevalence using the estimation and projection
package (EPP), a Bayesian model developed by
UNAIDS.
45Our implementation of EPP made use of
GBD-estimated demographic parameters, mortality rates
for people on and off antiretroviral therapy, and CD4
progression rates to fit a model to HIV/AIDS prevalence
data from surveillance sites and representative surveys.
EPP-generated inci
dence and prevalence time series
were used as inputs into Spectrum, a compartmental
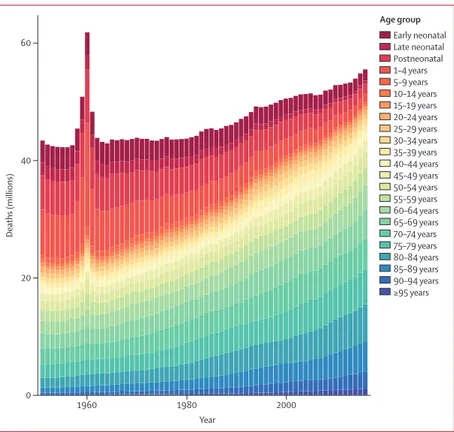
Early neonatal Late neonatal Postneonatal 1–4 years 5–9 years 10–14 years 15–19 years 20–24 years 25–29 years 30–34 years 35–39 years 40–44 years 45–49 years 50–54 years 55–59 years 60–64 years 65–69 years 70–74 years 75–79 years 80–84 years 85–89 years 90–94 years ≥95 years 1960 1980 2000 0 20 40 60 Deaths (millions) Year Age groupFigure 2: Total number of deaths by age, globally, for both sexes combined, 1950–2017
Each stacked bar represents the total number of deaths in the given year attributable to each age group, from 1950 to 2017, for both sexes combined. The early neonatal age group is 0–6 days, late neonatal is 7–27 days, and postneonatal 28–364 days. Early neonatal Late neonatal Postneonatal 1–4 years 5–9 years 10–14 years 15–19 years 20–24 years 25–29 years 30–34 years 35–39 years 40–44 years 45–49 years 50–54 years 55–59 years 60–64 years 65–69 years 70–74 years 75–79 years 80–84 years 85–89 years 90–94 years ≥95 years Age group 1950 1960 1970 1980 1990 2000 2010 2017 –8 –6 –4 –2 0 2
Log (death rate)
Year
Figure 3: Natural logarithm of age-specific mortality rates, globally, for both sexes combined, 1950–2017
Each line represents the natural logarithm of the global death rate for a single year by age group, from 1950 to 2017, for both sexes combined. The early neonatal age group is 0–6 days, late neonatal is 7–27 days, and postneonatal 28–364 days.
HIV/AIDS progression model originally developed by
UNAIDS. Spectrum generated a full set of
age-sex-specific
HIV/AIDS mortality rates using detailed
demographic parameters that align with those used for
EPP. In countries with VR data, we adjusted age-specific
and sex-specific incidence rates to produce mortality
estimates that better fit observed deaths. In parallel,
the GBD model life table process produced a separate
set of HIV/AIDS death estimates, which were reconciled
with Spectrum outputs to produce final mortality
estimates. For countries with high-quality VR systems,
mortality estimates were generated using ST-GPR on VR
data.
Analysing the relationship between age-specific
mortality rates and development status
To characterise development status, we used the
Socio-demographic Index (SDI), a composite measure based on
the total fertility under the age of 25 years (TFU25), average
edu cational attainment in those aged 15 years or older, and
LDI. Compared with GBD 2016, the SDI calculation in
GBD 2017 has been refined to use TFU25 instead of
the total fertility rate because TFU25 does not show a
U-shaped pattern with development at higher levels of
development status and is a better proxy for the status of
women in society.
31Aggregate SDI groupings were
generated by applying quintile cutoffs
from the distribution
of national-level SDI for countries with populations greater
than 1 million in 2017 to estimates of SDI for all GBD
locations in 2017. The SDI analysis is described in further
detail in appendix 1 (section 3); additional detail on
correlation for the weighted scores is also provided.
To evaluate the average relationship between SDI and
all-cause mortality, we fit a generalised additive model
with a Loess smoother on SDI by age and sex group
using GBD 2017 estimates from 1950 to 2017. The
expected value is based solely on SDI status and does not
vary over time. Examination of how the ratio of observed
death rates to expected death rates changes over time
allows us to explore the impact of how the relationships
are changing over time. The expected age-sex-specific
mortality rates were subsequently used to generate a
complete life table expected on the basis of SDI alone.
Uncertainty analysis
We estimate uncertainty systematically throughout
the all-cause mortality estimation process. We generated
1000 draws for each all-cause mortality metric, and
95% UIs are calculated using the 2·5th and
97·5th percentiles of the draw-level values. Analytical
steps are connected at the draw level, and the uncertainty
of key mortality metrics is propagated throughout the
all-cause mortality estimation process. Uncertainty in
under-5 mortality and adult mortality rate estimation
Figure 4: Global log (death rate) age-pattern for both sexes combined, by year, 1950–2017Each line represents the logarithm of global age-specific mortality rates for a given year between 1950 and 2017 and for both sexes combined. The inset shows a closer view of age groups from 20 to 39years.
1953 1970 1987 2004 1954 1971 1988 2005 1955 1972 1989 2006 1956 1973 1990 2007 1957 1974 1991 2008 1958 1975 1992 2009 1959 1976 1993 2010 1960 1977 1994 2011 1961 1978 1995 2012 1962 1979 1996 2013 1963 1980 1997 2014 1964 1981 1998 2015 1965 1982 1999 2016 1966 1983 2000 2017 –6 –8 –4 –2
Log (death rate)
Age (years) Age (years)
<1 1–4 5–9 10–14 15–19 20–24 25–29 30–34 35–39 40–44 45–49 50–54 55–59 60–64 65–69 70–7 20–24 25–29 30–34 35–39 4 75–79 80–84 85–89 90–94 ≥95 –6·4 –6·8 –6·0 –5·6 –5·2
and completeness synthesis are estimated using
non-sampling error and sampling error by data source.
For the model life table step and HIV/AIDS-specific
mortality calculations, uncertainty was estimated from
uncertainty in the life table standard and from the
regression parameters and sampling error in the EPP,
respectively.
Role of the funding source
The funders of the study had no role in study design,
data collection, data analysis, data interpretation, or
writing of the report. All authors had full access to the
data in the study and had final responsibility for the
decision to submit for publication.
Results
Levels and trends in death registration
The proportion of deaths that are registered and reported
through VR and civil registration systems globally and by
super-region are shown in figure 1, with detailed
information on each location shown in appendix 1. The
updated results of the application of all three death
distribution methods and the synthesised time series
of completeness are available online. Globally, 18·7%
(95% UI 18·4–19·0) of deaths were registered in 1950 and
that number has been steadily increasing, with 58·8%
(58·2–59·3) of all deaths registered in 2015, the most
recent year with the highest reported rate. 2015 is the peak
year of completeness of death registration and reporting
GBD super-regionGlobal Central Europe, eastern Europe, and central Asia High income
Latin America and Caribbean North Africa and Middle East South Asia
Southeast Asia, east Asia, and Oceania Sub-Saharan Africa
1950 1960 1970 1980 1990 2000 2010 20 30 40 50 60 70 80 90
Life expectancy (years)
Year
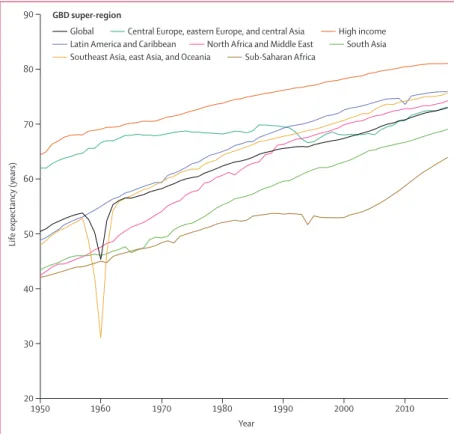
Figure 5: Life expectancy at birth and by GBD super-region for both sexes combined, 1950–2017
GBD=Global Burden of Diseases, Injuries, and Risk Factors Study.
1950 1960 1970 1980 1990 2000 2010 20 30 40 50 60 70 80 90
Life expectancy (years)
Year
1950 1960 1970 1980 1990 2000 2010
Year
A
FemalesB
MalesCountry
Bangladesh Brazil China Ethiopia India Indonesia Japan Mexico Nigeria Pakistan
Philippines Russia USA
Figure 6: Life expectancy at birth for the countries with population greater than 100 million, 2017
Each line represents life expectancy at birth from 1950 to 2017 for females (A) and males (B).
For more on the application of death distribution methods and synthesised time series of completeness see https://vizhub.healthdata.org/ mortality/
B
Persian Gulf Caribbean LCA Dominica ATG TTO Grenada VCT TLS Maldives Barbados Seychelles Mauritius ComorosWest Africa Eastern
Mediterranean
Malta
Singapore Balkan Peninsula Tonga
Samoa FSM Fiji Solomon Isl Marshall Isl Vanuatu Kiribati Persian Gulf Caribbean LCA Dominica ATG TTO Grenada VCT TLS Maldives Barbados Seychelles Mauritius Comoros
West Africa Eastern
Mediterranean
Malta
Singapore Balkan Peninsula Tonga
Samoa FSM Fiji Solomon Isl Marshall Isl Vanuatu Kiribati
Life expectancy (years)
40 to <50 50 to <60 60 to <65 65 to <70 70 to <75 75 to <80 80 to <85 ≥85
Life expectancy (years)
40 to <50 50 to <60 60 to <65 65 to <70 70 to <75 75 to <80 80 to <85 ≥85
C
D
Persian Gulf Caribbean LCA Dominica ATG TTO Grenada VCT TLS Maldives Barbados Seychelles Mauritius ComorosWest Africa Eastern
Mediterranean
Malta
Singapore Balkan Peninsula Tonga
Samoa FSM Fiji Solomon Isl Marshall Isl Vanuatu Kiribati Persian Gulf Caribbean LCA Dominica ATG TTO Grenada VCT TLS Maldives Barbados Seychelles Mauritius Comoros
West Africa Eastern
Mediterranean
Malta
Singapore Balkan Peninsula Tonga
Samoa FSM Fiji Solomon Isl Marshall Isl Vanuatu Kiribati
Difference in life expectancy (years)
<10 10 to <15 15 to <20 20 to <25 25 to <30 30 to <35 ≥35
Difference in life expectancy (years)
<10 10 to <15 15 to <20 20 to <25 25 to <30 30 to <35 ≥35
countries and central Europe, eastern Europe, and central
Asia have had complete registration since 1985, with
completeness considered to be above 95%. The Latin
America and the Caribbean region has also had high
registration since the late 1970s, which has been increasing
and reached a high of 88·5% (88·0–89·0) in 2011 and
staying around that level since. Substantial progress was
seen in southeast Asia, east Asia, and Oceania in the past
decade, with registration having increased from less
than 10% as recently as 2006, to 49·6% (48·7–50·6) in
2015. South Asia and north Africa and the Middle East had
improvements throughout this time period; south Asia
reached a maximum complete ness of 69·4% (68·4–70·5)
in 2007 and was at 51·1% in both 2013 and 2014, and north
Africa and the Middle East attained a 57·7% (56·5–58·9)
complete ness in 2015. Globally, 134 of 195 countries and
territories had increases in completeness since the first
year for which we have reported VR. Notable increases
were for Iran, which increased from 13·4% (13·1–13·8)
in
1974 to 89·8% (89·4–90·1)
in 2016, Turkey, which
increased from 28·9% (27·5–30·5)
in 1978 to 100%
(100–100)
in 2016, and South Korea, which was 39·0%
(35·0–43·2) in 1957 and increased to 97·9% (94·5–100·0)
in 2016. Despite the increases over time, figure 1 also
shows that 62·2% of all deaths did not get reported or
registered as recently as 2016. Sub-Saharan Africa stands
out as the region with the lowest rate of death registration
and reporting. While substantial progress has been made
in all other super-regions, sub-Saharan Africa remains
at very low levels of death reporting and registration.
56 countries had registration that was complete or at
its highest level in 2016. In other countries, the lag
between registration and reporting is even longer; only
81 countries were regarded as having complete
regi-stration (>95%) for at least 1 year in the past 5 years,
which were mainly in western Europe, central Europe,
and the Caribbean.
Trends in number of age-specific deaths and death rates
at the global level since 1950
Figure 2 shows the total number of deaths over time by
age and for both sexes combined (sex-specific results are
available in appendix 2). There were 43·7 million (95% UI
43·0–44·3) deaths in the world in 1950, and that number
had increased to 55·9 million (55·4–56·5) by 2017. This
relatively small increase of 28·1% (25·9–30·4) in the
2·57 billion (2·52–2·62) in 1950 to 7·64 billion
(7·39–7·87) in 2017—increase of 297·2% (293·6–299·9)—
the number of deaths has remained comparatively
constant. The highest number of deaths, 61·8 million
(61·4–62·3), occurred in 1960. The excess number of
deaths in 1960 compared with adjacent years was due to
the Great Leap Forward in China. Overall, for both men
and women (figures by sex shown in appendix 2), there
has been a huge decrease in childhood deaths across all
of the four age groups that refer to under-5 mortality
(figure 2). As a propor tion of total deaths, deaths before
the age of 5 years have decreased from 44·9% (44·2–45·7)
in 1950 to 9·6% (9·3–10·0) in 2017. Conversely, deaths at
ages older than 75 years have increased substantially,
going from 11·9% (11·8–11·9) of total deaths in 1950 to
39·2% (39·1–39·4) of total deaths in 2017.
The trends in age-specific deaths during this time
period are shown in more detail in appendix 2. Broadly,
the trends over time in the number of deaths fall into
three categories, aside from the large spike in deaths in
1960 due to the Great Leap Forward in China. First, the
age groups younger than 5 years have had consistent
declines in the numbers of deaths since 1950. The largest
declines were in the four age groups pertaining to ages
younger than 5 years for both boys and girls. Globally, for
both sexes combined between 1950 and 2017, the number
of deaths declined in the early neonatal period from
3·7 million (95% UI 3·6–4·0) to 1·9 million (1·8–1·9); in
the late neonatal period from 2·2 million (2·1–2·3) to
0·5 million (0·5–0·5); in the postneonatal period from
5·8 million (5·6–6·1) to 1·6 million (1·6–1·7); and at
ages 1–4 years from 7·8 million (7·6–8·1) to 1·4 million
(1·3–1·5). This substantial decline in the total number
of under-5 deaths, from 19·6 million (19·1–20·2) to
5·4 million (5·2–5·6), also needs to be considered in the
context of the number of births, which has increased
by 49·9% (43·5–56·5) from 92·6 million (88·9–96·4) to
138·8 million (130·0–149·1) during the same period.
Second are the age groups starting at age 5 years and up
to age 49 years, for which the numbers of deaths have
remained relatively constant between 1950 and 2017. For
example, for the 20–24 years age group there were
892 000 (879 000–909 000) deaths in 1950 and 710 000
(697 000–725 000) in 2017. Third, in the older age groups
(ie, those older than 50 years), the number of deaths has
steadily increased since 1950; these increases are most
notable in the age groups older than 80 years.
Figure 3 shows depicts the trends in age-specific death
rates since 1950 on a natural log scale. Death rates in
the younger age groups, especially those younger than
5 years, have declined faster than those in adult age
groups for both men and women. For some age groups,
particularly those older than 80 years, death rates have
not changed much over the past 68 years, suggesting that
Figure 7: Life expectancy at birth, by location, for females (A) and males (B),2017, and difference in life expectancy at birth, by location, for females (C) and males (D) between 2017 and 1950
ATG=Antigua and Barbuda. FSM=Federated States of Micronesia. LCA=Saint Lucia. TLS=Timor-Leste. TTO=Trinidad and Tobago. VCT=Saint Vincent and the Grenadines.
the large increase in the absolute number of deaths
shown in figure 2 is driven by increases in the populations
of those age groups over time, and not by increases in
age-specific death rates.
Figure 4 shows the age-specific mortality rate curves
for all years since 1950. On a natural log scale, the same
difference on the y-axis represents the same percentage
decline. This representation highlights the remarkable
progress in age-specific mortality rates over time. The
exception here is the period between 1958 and 1961,
which reflects the impact of the Great Leap Forward in
China, seen as higher mortality rates for all age groups
under the age of 15 years and higher mortality rates than
other years for ages 50–64 years. Outside of that period,
the younger age groups that compose under-5 mortality
have steady progress over time, with the mortality rate
for 1–4 year olds dropping from 2554·7 deaths (95% UI
2330·7–2788·5) per 100 000 to 264·7 (239·6–293·3)
between 1950 and 2017. What is less visible in the
previous figures is the steady progress in the age groups
5–9 years and 10–14 years, for which mortality rates have
drop ped from 330·4 (325·9–335·4) per 100 000 to 62·3
(61·2–63·5) per 100 000 and 183·4 (181·3–186·0) per
100 000 to 50·3 (49·5–51·1) per 100 000, respectively.
Progress in age-specific mortality rates occurred across
all ages, but become less pronounced for the older age
groups. Despite overall progress, in the younger adult
age groups (ages 20–45 years) the curves from the
early 2000s cross over those for the 1990s, indicating a
reversal in decades of progress on young adult mortality
(see insert in figure 4). Other than this period of reversal
at the global level, progress has been remarkably
consistent in global death rates, albeit with very different
relative changes by age group.
Global, regional, and national trends in life expectancy
since 1950
Taking into account trends in age-specific mortality rates
over time, figure 5 shows global and regional trends for
both sexes combined in life expectancy at birth since 1950
(sex-specific figures are available in appendix 2). Globally,
life expectancy at birth has increased from 48·1 years
(95% UI 46·5–49·6) in 1950 to 70·5 years (70·1–70·8)
in 2017 for men and from 52·9 years (51·7–54·0) in 1950
to 75·6 years (75·3–75·9) in 2017 for women. The huge
impact of the Great Leap Forward in China in 1960 is
shown clearly at both the global and regional level.
Globally, life expectancy dropped by 5·1 years (3·9–6·2)
as a result of the famine. Other than this massive fatal
discontinuity, the trend in life expectancy at the global
level has been one of steady increases. The smallest
gain at the global level was during the 1990s and is
partly explained by the fact that two super-regions,
central Europe, eastern Europe, and central Asia, and
sub-Saharan Africa, experienced declines during this
decade. At the super-region level, the largest gains in
life expectancy since 1950 were in north Africa and
the Middle East, where life expectancy increased from
42·4 years (40·6–44·1) to 74·2 years (73·9–74·6). At the
other end of the scale, the smallest net gains in life
expectancy were in central Europe, eastern Europe, and
central Asia, where life expectancy has increased by a total
of only 11·1 years (10·3–11·9) since 1950, including
periods where life expectancy decreased. Progress has
been made in this super-region since 2000, with increases
of 5·6 years (5·4–5·8) for men and 4·2 years (4·1–4·4) for
women in life expectancy up to 2017.
Sub-Saharan Africa had the lowest levels of life
expectancy in 2017, at 63·9 years (95% UI 63·1–64·6) for
both sexes combined, which is where the global average
was in the mid-1980s. Although the net increase during
the 68-year period since 1950 has been the smallest for
sub-Saharan Africa, with declines occurring during
the 1990s for both men and women, the region has also
shown the greatest gains in life expectancy since 2000.
Life expectancy has increased by 10·9 years (10·1–11·7)
since 2000, a much faster rate of increase than in
previous decades. High-income regions had the highest
life expectancy in 2017; however, the gains since 2010
have been very small at 0·6 years (0·5–0·7).
Figure 6 shows changes in life expectancy at birth
for women (figure 6A) and men (figure 6B) for the
13 countries with a population greater than 100 million
in 2017, which jointly represent 62·5% (95% UI
61·5–63·4) of the global population. Among these
13 countries, Russia stands out for having the smallest
net gain over the 68-year period of the study at only
5·7 years (4·8–6·7) for men and 7·7 years (7·0—8·6) for
women. Men in Ethiopia and Pakistan have similar life
expectancies to men in Russia in 2017 at 66·7 years
(65·6–67·7) and 66·4 years (63·8–69·1), respectively;
however, men in both Ethiopia and Pakistan have had
significant increases in life expectancy since 1950,
adding up to a total gain of 31·1 years (28·0–34·3) in
Ethiopia and 20·1 years (16·1–23·9) in Pakistan, with
particularly pronounced increases since 2000 for
Ethiopia. While not as noticeable as for men, gains in
life expectancy have also been small for women in
Russia, with the most pronounced declines seen in the
early 1990s. Furthermore, whereas Russia was ranked
second among this group of countries in both men and
women in 1950, following the USA, by 2017, it had fallen
to tenth place for men and sixth place for women.
The largest gains in life expectancy among the
13 most populous countries were in Bangladesh
(32·1 years [95% UI 29·3 to 35·2] for men and
31·7 years [28·4 to 35·0] for women) and Ethiopia
(31·1 years [28·0 to 34·3] for men and 30·6 years
[28·3 to 32·9] for women). The Philippines stands out
as the country in this group in which the gap between
female and male life expectancy has grown the most
since 1950. The gap was only 1·6 years (–0·1 to 3·3) in
1950 and has grown to 6·5 years (3·6 to 9·1) in 2017. In
1950, life expectancy in the Philippines was only
Male Female Male Female Male Female Male Female Male Female Global 0·04 (0·04 to 0·05) (0·03 to 0·04 0·04) 0·17 (0·17 to 0·17) (0·10 to 0·10 0·11) 70·48 (70·12 to 70·82) (75·31 to 75·59 75·86) 19·39 (19·28 to 19·51) 22·61 (22·5 to 22·73) 30 387 (29 986 to 30 775) 25 558 (25 224 to 25 885) Low SDI 0·07 (0·06 to 0·08) (0·06 to 0·07)0·06 (0·23 to 0·25)0·24 (0·18 to 0·19)0·18 (63·8 to 65·13)64·48 (66·75 to 67·95)67·34 (16·5 to 17·04)16·77 (17·84 to 18·45)18·15 (4685 to 4806 4939) 4131 (4023 to 4240) Low-middle SDI (0·05 to 0·06)0·06 (0·05 to 0·05)0·05 (0·21 to 0·23)0·22 (0·15 to 0·17)0·16 (65·67 to 66·86)66·27 (69·5 to 70·65)70·08 (17·02 to 17·53)17·28 (19·11 to 19·69)19·4 (6363 to 6579 6813) 5656 (5465 to 5866) Middle SDI 0·02 (0·02 to 0·02) (0·02 to 0·02)0·02 (0·16 to 0·17)0·17 (0·09 to 0·09)0·09 (71·37 to 72·09)71·71 (77·09 to 77·7)77·42 (18·69 to 19·18)18·92 (21·96 to 22·46)22·22 (5911 to 6067 6217) 4536 (4418 to 4662) High-middle SDI (0·01 to 0·01)0·01 (0·01 to 0·01)0·01 (0·14 to 0·15)0·15 (0·07 to 0·07)0·07 (72·98 to 73·69)73·33 (79·13 to 79·7)79·42 (18·85 to 19·37)19·1 (22·44 to 22·91)22·68 (7607 to 7831 8059) 6259 (6088 to 6439) High SDI 0·01 (<0·01 to 0·01) (<0·01 to <0·01 <0·01) 0·10 (0·10 to 0·10) (0·05 to 0·06)0·05 (78·3 to 78·65)78·47 (83·53 to 83·86)83·7 (22·33 to 22·58)22·46 (26·05 to 26·32)26·19 (4922 to 4997 5071) 4875 (4797 to 4953) Central Europe, eastern Europe, and central Asia 0·02 (0·01 to 0·02) (0·01 to 0·01)0·01 (0·24 to 0·25)0·24 (0·10 to 0·10)0·10 (68·3 to 68·68)68·5 (77·41 to 77·74)77·57 (16·92 to 17·12)17·02 (21·89 to 22·1)21·99 (2398 to 2427 2457) 2303 (2273 to 2332) Central Asia 0·03 (0·03 to 0·03) (0·02 to 0·03)0·02 (0·21 to 0·23)0·22 (0·10 to 0·12)0·11 (66·76 to 67·92)67·37 (74·26 to 75·4)74·83 (15·46 to 16·14)15·82 (19·94 to 20·67)20·30 (339 to 369)353 (266 to 290)277 Armenia 0·01 (0·01 to 0·01) (0·01 to 0·01)0·01 (0·16 to 0·17)0·16 (0·06 to 0·07)0·07 (71·97 to 72·81)72·38 (78·23 to 79·06)78·65 (17·64 to 18·22)17·93 (21·16 to 21·84)21·51 (14 to 15)14 (13 to 14)14 Azerbaijan 0·04 (0·03 to 0·05) (0·03 to 0·04)0·03 (0·17 to 0·21)0·19 (0·08 to 0·10)0·09 (66·2 to 68·22)67·23 (73·74 to 75·66)74·66 (14·51 to 15·71)15·1 (19·56 to 21)20·27 (41 to 48)45 (28 to 33)31 Georgia 0·01 (0·01 to 0·01) (0·01 to 0·01)0·01 (0·23 to 0·25)0·24 (0·08 to 0·09)0·08 (67·96 to 68·81)68·39 (76·89 to 77·73)77·31 (15·99 to 16·45)16·21 (20·53 to 21·13)20·83 (25 to 26)25 (24 to 26)25 Kazakhstan 0·02 (0·01 to 0·02) (0·01 to 0·02)0·01 (0·24 to 0·27)0·26 (0·10 to 0·11)0·10 (66·76 to 68·16)67·46 (75·75 to 77·06)76·38 (15·84 to 16·65)16·24 (20·50 to 21·42)20·93 (71 to 78)74 (57 to 64)61 Kyrgyzstan 0·02 (0·02 to 0·02) (0·02 to 0·02)0·02 (0·20 to 0·21)0·21 (0·09 to 0·10)0·10 (68·7 to 69·44)69·07 (75·88 to 76·65)76·27 (16·6 to 17·06)16·83 (20·64 to 21·21)20·92 (18 to 19)19 (15 to 16)15 Mongolia 0·03 (0·02 to 0·04) (0·02 to 0·03)0·02 (0·27 to 0·33)0·30 (0·12 to 0·15)0·14 (63·18 to 65·94)64·48 (72·47 to 74·84)73·66 (14·16 to 15·68)14·9 (18·85 to 20·52)19·68 (12 to 14)13 (8 to 9)8 Tajikistan 0·05 (0·04 to 0·06) (0·04 to 0·05)0·04 (0·16 to 0·20)0·18 (0·11 to 0·14)0·12 (66·33 to 68·92)67·67 (72·06 to 74·54)73·3 (16·34 to 17·94)17·19 (19·9 to 21·67)20·75 (26 to 30)28 (18 to 22)20 Turkmenistan 0·03 (0·03 to 0·04) (0·02 to 0·03)0·03 (0·23 to 0·27)0·25 (0·12 to 0·14)0·13 (65·42 to 67·68)66·54 (72·72 to 74·94)73·87 (15·66 to 16·93)16·27 (19·26 to 20·76)20·05 (17 to 20)19 (13 to 16)14 Uzbekistan 0·03 (0·02 to 0·03) (0·02 to 0·02)0·02 (0·19 to 0·24)0·21 (0·11 to 0·14)0·12 (65·55 to 68·6)67·12 (72·18 to 75·35)73·75 (14·07 to 15·95)15 (18·24 to 20·57)19·38 (103 to 130)116 (78 to 102)89 Central Europe 0·01 (0·01 to 0·01) (<0·01 to 0·01)0·01 (0·15 to 0·16)0·15 (0·06 to 0·07)0·07 (73·34 to 73·92)73·62 (80·19 to 80·70)80·44 (18·49 to 18·88)18·69 (22·94 to 23·34)23·13 (663 to 695)678 (633 to 665)649 Albania 0·01 (0·01 to 0·02) (0·01 to 0·01)0·01 (0·08 to 0·13)0·10 (0·04 to 0·06)0·05 (72·83 to 77·11)74·93 (79·9 to 84·32)82·1 (18·12 to 21·14)19·57 (23·18 to 26·9)25 (11 to 16)13 (7 to 11)8 Bosnia and Herzegovina (0·01 to 0·01)0·01 (0·01 to 0·01)0·01 (0·12 to 0·14)0·13 (0·06 to 0·07)0·06 (73·62 to 75·04)74·34 (78·39 to 79·74)79·06 (18·1 to 19·12)18·62 (21·03 to 22·11)21·57 (18 to 20)19 (17 to 19)18 Bulgaria 0·01 (0·01 to 0·01) (0·01 to 0·01)0·01 (0·18 to 0·20)0·19 (0·08 to 0·09)0·09 (70·60 to 72·11)71·33 (77·88 to 79·24)78·58 (16·83 to 17·82)17·3 (21·49 to 22·52)22·01 (53 to 60)56 (48 to 55)51 Croatia <0·01 (<0·01 to 0·01) (<0·01 to <0·01 <0·01) 0·12 (0·11 to 0·13) (0·04 to 0·05)0·05 (74·71 to 76·08)75·39 (80·95 to 82·28)81·61 (18·81 to 19·8)19·28 (23·03 to 24·15)23·57 (24 to 27)25 (24 to 28)26 Czech Republic (<0·01 to <0·01 <0·01) <0·01 (<0·01 to <0·01) 0·11 (0·10 to 0·12) (0·05 to 0·06)0·05 (75·6 to 77)76·31 (81·29 to 82·6)81·96 (19·42 to 20·46)19·95 (23·52 to 24·57)24·06 (52 to 59)56 (51 to 59)55 Hungary 0·01 (<0·01 to 0·01) (<0·01 to <0·01 <0·01) 0·17 (0·15 to 0·18) (0·07 to 0·08)0·08 (72·42 to 73·89)73·19 (79·5 to 80·86)80·20 (17·59 to 18·63)18·13 (22·47 to 23·55)23·02 (57 to 64)60 (58 to 66)62 (Table continues on next page)