Radi
ophotol
umi
nescence dosi
metry usi
ng vi
si
bl
e emi
tti
ng
col
our centres i
n pure Li
F crystal
s:
the cl
i
ni
cal
dose chal
l
enge i
n radi
otherapy
R. M. MONTEREALI, F. BONFIGLI,M. PICCININI, M.A. VINCENTI
Fusion and Technologies for Nuclear Safety and Security Dep., PhysicalTechnologies for Safety and Health Division, Photonics Micro and Nanostructures Laboratory
FrascatiResearch Centre
J. E. VILLARREAL-BARAJAS J. E. VILLARREAL-BARAJAS
ENEA guest,current address: RoyalDevon and Exeter Hospital- NHS Foundation Trust, MedicalPhysics Department,Exeter (UK) Fusion and Technologies for Nuclear Safety and Security Dep., PhysicalTechnologies for Safety and Health Division, Photonics Micro and Nanostructures Laboratory
FrascatiResea
FrascatiResearch Centre Department of Physics and Astronomy, University of Calgary,Calgary AB,Canada
V. DE COSTE, M. PIMPINELLA
Fusion and Technologies for Nuclear Safety and Security Dep., NationalInstitute of Ionizing Radiation Metrology (INMRI) Casaccia Research Centre
R. F. KHAN
Washington University,Schoolof Medicine in St.Louis, 4921 Parkview Pl,St.Louis,MO 63110,USA
4921 Parkview Pl,St.Louis,MO 63110,USA
IS SN /2 49 9-53 47 RT/2020/5/ENEA
ITALIAN NATIONAL AGENCY FOR NEW TECHNOLOGIES, ENERGY AND SUSTAINABLE ECONOMIC DEVELOPMENT
R. M. MONTEREALI, F. BONFIGLI, M. PICCININI, M.A. VINCENTI
Fusion and Technologies for Nuclear Safety and Security Dep., Physical Technologies for Safety and Health Division, Photonics Micro and Nanostructures Laboratory Frascati Research Centre
J. E. VILLARREAL-BARAJAS
ENEA guest, current address: Royal Devon and Exeter Hospital - NHS Foundation Trust, Medical Physics Department, Exeter (UK) Fusion and Technologies for Nuclear Safety and Security Dep., Physical Technologies for Safety and Health Division, Photonics Micro and Nanostructures Laboratory Frascati Research Centre Department of Physics and Astronomy, University of Calgary, Calgary AB, Canada
Radiophotoluminescence dosimetry using visible emitting
colour centres in pure LiF crystals:
the clinical dose challenge in radiotherapy
V. DE COSTE, M. PIMPINELLAFusion and Technologies for Nuclear Safety and Security Dep., National Institute of Ionizing Radiation Metrology (INMRI) Casaccia Research Centre
R. F. KHAN
Washington University, School of Medicine in St. Louis, 4921 Parkview Pl, St. Louis, MO 63110, USA
RT/2020/5/ENEA
ITALIAN NATIONAL AGENCY FOR NEW TECHNOLOGIES, ENERGY AND SUSTAINABLE ECONOMIC DEVELOPMENT
I rapporti tecnici sono scaricabili in formato pdf dal sito web ENEA alla pagina www.enea.it I contenuti tecnico-scientifici dei rapporti tecnici dell’ENEA rispecchiano
l’opinione degli autori e non necessariamente quella dell’Agenzia
The technical and scientific contents of these reports express the opinion of the authors but not necessarily the opinion of ENEA.
RADIOPHOTOLUMINESCENCE DOSIMETRY USING VISIBLE EMITTING COLOUR CENTRES IN PURE LIF CRYSTALS:
THE CLINICAL DOSE CHALLENGE IN RADIOTHERAPY
R. M. Montereali, F. Bonfigli, V. De Coste, R. F. Khan, M. Piccinini, M. Pimpinella, M. A. Vincenti, J. E. Villarreal-Barajas
Abstract
The visible photoluminescence (PL) response of radiation-induced stable aggregate colour centres in nominally pure lithium fluoride crystals irradiated with high energy photons (6 MV X-rays clinical beams and 60Co gamma rays from a calibrated source for comparison purposes) in the 1-100 Gy dose range was investigated to assess its application in clinical dosimetry. Optical transmittance and laser-excited PL spectra of the irradiated LiF crystals were measured in a period that spanned from six weeks to six months after their irradiation. The net PL intensity of the integrated F2 and F3+ emission spectra as a function of absorbed dose exhibited a linear behaviour (R2=0.99) in the 1 to 100 Gy dose range. This work was mainly performed during the sabbatical year (Sept. 2013-Aug. 2014) of Prof. Jose Eduardo Villarreal-Barajas, from University of Calgary (Canada), in the Photonics Micro and Nanostruc-tures Laboratory at ENEA C.R. Frascati (Italy). This preliminary investigation provided experimental evidence of the potential application of nominally pure LiF crystals as passive solid-state clinical dosi-meters for radiotherapy based on radiophotoluminescence (RPL).
Key words: lithium fluoride, photoluminescence, clinical dosimetry, colour centres, MV X-rays
Riassunto
La fotoluminescenza (PL, photoluminescence) visibile di centri di colore aggregati stabili, indotti da radiazione in cristalli di LiF irraggiati con fotoni di alta energia (raggi-X da 6 MV prodotti da un acce-leratore lineare clinico presso il Tom Baker Cancer Centre, a Calgary, Canada e, per confronto, con raggi gamma da una sorgente calibrata di 60Co presso INMRI, Centro Ricerche ENEA Casaccia (RM), Italia) è stata proposta e studiata per applicazioni dosimetriche in radioterapia oncologica. Gli spettri di trasmittanza ottica e quelli di fotoluminescenza eccitati da un laser operante a 458 nm sono stati misurati in un periodo che va da 6 settimane a 6 mesi dopo l’irraggiamento. L’intensità del segnale netto di PL, integrato spettralmente come somma delle bande di emissione dei centri F2 and F3+, in funzione della dose assorbita mostra un andamento lineare (R2=0.99) nell’intervallo tra 1 e 100 Gy, di interesse per la dosimetria clinica in radioterapia. Questo lavoro è stato svolto principalmente durante l’anno sabbatico (settembre 2013-agosto 2014) che il Prof. Jose Eduardo Villarreal-Barajas, dell’Uni-versity of Calgary, ha trascorso presso il Lab. Micro e Nanostrutture per Fotonica del Centro Ricerche ENEA di Frascati (RM), Italia. Questi risultati preliminari forniscono la prima evidenza sperimentale dell’applicabilità di cristalli di LiF nominalmente puri come dosimetri passivi a stato solido basati sulla radiofotoluminescenza (RPL, Radiophtoluminescence) in radioterapia.
1. INTRODUCTION
1.1 RPL and OSL in doped LiF for dosimetric applications 1.2 Visible RPL of pure LiF crystals
2. MATERIALS AND METHODS
2.1 LiF crystals irradiation set-up
2.2 Transmittance and laser-induced PL measurements 3. RESULTS AND DISCUSSION
4. CONCLUSIONS AND FUTURE PERSPECTIVES BIBLIOGRAPHY
1. INTRODUCTION
Lithium fluoride (LiF) crystals and pellets, in pure and doped form, have been successfully used as a thermoluminescent (TL) dosimeter for over 60 years1. Thermoluminescence dosimetry (TLD) with LiF is currently used in clinical applications because of its tissue equivalence response and its physical characteristics, e.g. small size, non-sensitivity to humidity, flexibility in geometrical form, etc. On the other hand, the use of pure LiF as an effective dosimeter based on radiophotoluminescence (RPL) at the low doses used in radiotherapy proved to be elusive2.
Due to the peculiar optical properties of stable radiation-induced aggregate colour centres (CCs) in LiF3, there are significant advantages that an all optically-based RPL LiF dosimetry system may offer:
fast evaluation time (seconds);
perennial PL signal (allowing multiple evaluation without signal loss);
excellent signal stability at room temperature and in standard laboratory illumination conditions; dose mapping capability;
fast erasing (minutes) thermal-based annealing.
These advantages have motivated novel research aimed to investigate the light-emission properties of traditional LiF based TL dosimeters. Before shortly reviewing the most recent work on the PL-based dosimetric applications of doped LiF, and in order to highlight the most relevant features of the PL phenomena of CCs in irradiated crystals, a brief description of the luminescence processes is presented. PL refers to the light-emission phenomenon excited through the light absorption by an electron localized in a point defect in crystals or glasses4. This process usually results in the excitation of the electron from the defect ground state to an excited one. Relaxation back to the ground state results in the emission of luminescence, whose intensity is proportional to the concentration of excited defects5 in the optically pumped volume. In alkali halides, due to the strong electron-phonon coupling between the defect and the lattice, the emitted luminescence is at longer wavelengths respect to the corresponding excitation ones (Stokes shift) and its intensity is generally constant in time for a given excitation. The term radiophotoluminescence (RPL) is used when the fluorescent localized point defect in the material was previously induced by ionizing radiation. An apparent similar light-emission phenomenon, known as optically stimulated luminescence (OSL), occurs when some kinds of irradiated semiconductors or insulators are exposed to light5. In this case, depending on the material, the irradiation causes the ionization of valence electrons and the creation of electron-hole pairs. These electrons and holes can be localized via pre-existing defects in the material through non-radiative trapping transitions. Subsequent illumination of the irradiated sample with light leads to the absorption of energy by the trapped electrons and transitions from the localized trap into the delocalized conduction band. Recombination of free electrons with the localized holes results in radiative recombination and luminescence. This luminescence is typically of shorter wavelengths with respect to the excitation ones (anti-Stokes shift) and its intensity continuously decays under the excitation light exposure.
TL, OSL and RPL passive dosimeters provide stand-alone measurement techniques (i.e. they do not need cables or other physical connectors). OSL and RPL reading techniques have the advantage of being fully optical (light excitation at specific wavelengths combined with light emission detection). It is still not clear whether the same defect centres are involved in TL, OSL and RPL processes in any material and phenomenological and mathematical descriptions are necessary for a quantitative analysis of the observed phenomena. It should be noticed that the term radioluminescence (RL) is referred to luminescence emitted during the irradiation, under the ionizing radiation excitation, for online monitoring by active detectors.
1.1 RPL and OSL in doped LiF for dosimetric applications
Different groups investigated RPL and OSL signals of doped LiF for dosimetric applications. The use of doped LiF as an OSL/RPL dosimeter was the subject of recent investigations by L. Oster et al.6-8, B. Marczewska et al.9 and A. Piaskowska et al.10. These studies focused their attention on the two most commonly used TL materials based on intentionally doped LiF (LiF:Mg,Ti and LiF:Mg,Cu,P). Olster et al.6-8 focused their investigations on the application of combined OSL/TL responses as a tool to discriminate irradiations performed with high-ionization density radiation (alpha particles from 241Am) vs. low-ionization density ones (beta particles from a 90Sr/90Ysource and 60Co gamma rays). It is important to note that Olster’s studies should be better referred as RPL rather than OSL. The studies from the Polish Institute of Nuclear Physics team9,10 showed that the RPL of doped LiF irradiated with high ionization particles presents an appreciably higher RPL signal than its equivalent for low ionizing particles (137Cs gamma rays). The opposite behaviour was observed for the corresponding TL signals. In all these RPL/OSL-based studies6-10, the emission intensity was distinguishable from the background only when the low ionization density irradiation doses were higher than 50 Gy.
L.C. Matsushima et al.11 investigated the OSL of LiF:Mg,Ti exposed to 60Co gamma rays and 90Sr/90Y beta particles irradiations in the range from 0.5 to 15 Gy. In this study the measured OSL signal is almost double for the beta irradiations respect to 60Co gamma rays. Bilsky et al.12 performed a similar investigation but used both LiF:Mg,Ti and LiF:Mg,Cu,P TL detectors (commercially known as MTS-N and MCP-N, respectively). Their results showed that the MCP-N OSL sensitivity was very high, substantially exceeding that of BeO (about three times) and MTS-N (about 60 times). However, MCP-N exhibited a considerable fading reaching nearly 80% loss of the OSL signal within 60 hours after irradiation.
The novel use of the visible RPL signal of radiation-induced CCs in pure LiF crystals and thin films as an advanced diagnostic tool for low energy proton beams dose-mapping was recently proposed13 and demonstrated14. The versatile utilization of the RPL of CCs induced by soft X-ray irradiation on pure LiF crystals and thin films for high spatial resolution imaging15,16 suggests the potential use of the visible emitting CCs in pure LiF for high spatial resolution ionizing radiation dosimetric applications.
The present study provides experimental evidence of the dosimetric potential of the visible RPL response of nominally pure LiF crystals irradiated with high energy photons (6 MV X-rays and 60Co gamma rays) in the 1-100 Gy dose range. The selection of low ionizing density photons is expected to provide the lowest sensitivity of the RPL-LiF system. Higher density irradiations are expected to produce an enhanced RPL response in pure LiF and they are the subject of more complex additional investigations.
1.2 Visible RPL of pure LiF crystals
Primary and aggregate CCs produced in LiF by ionizing radiations are stable at room temperature and give rise to several broad absorption bands extending from the ultraviolet through the visible up to near-infrared region of the electromagnetic spectrum. The primary F centre, consisting of an ion vacancy occupied by an electron, possesses the main absorption band peaked at approximately 248 nm. The aggregate F2 and F3+ electronic defects (two electrons bound to two and three anion vacancies, respectively) have overlapping absorption bands centred around 450 nm, generally called M band. The PL spectrum, associated with optical excitation in the M band, exhibits two distinct broad emission bands peaked at about 678 nm and 541 nm, corresponding to the F2 and F3+ CCs, respectively17,18. The dosimetric application of the visible PL signal emitted from the radiation-induced F2 and F3+ in 6 MV X-ray irradiated pure LiF crystals, excited by an Argon laser tuned at 458 nm, is the main focus of this investigation. This study represented the first step in a systematic study on the use of pure LiF crystals as a RPL based passive clinical dosimeter.
2. MATERIALS AND METHODS
2.1 LiF crystals irradiation set-up
A set of five nominally pure, commercially available polished LiF crystals (Optics-M Ltd. Moscow, Russia), (550.5) mm3, were used for this investigation. The X-ray irradiations were performed at the Tom Baker Cancer Centre, Calgary, Canada, using a 6 MV X-ray clinical beam. The beam was calibrated in terms of absorbed dose to water using the AAPM Task Group 51 clinical dosimetry protocol14. The LiF crystals were irradiated at doses of 1, 10, 20, 50 and 100 Gy. A (1010) cm2 field size was set for all the irradiations. The LiF crystals were positioned at the centre of the square radiation field. The irradiations were performed using a Solid Water (Gammex, Middleton, WI, USA) slab phantom measuring (303020) cm3. The LiF crystals were set at a depth of 10 cm, therefore allowing for a 10 cm backscattering support ensuring full electronic equilibrium conditions. For all the irradiations the dose-rate (at the LiF crystals) was set to 4.66 Gy/min. The irradiations were performed at room temperature (19-21oC).
It is worth mentioning that the term dose in this study refers to the absorbed dose to water.
Another set of five LiF crystals, from the same batch, was irradiated at the Italian National Institute of Ionizing Radiation Metrology (ENEA-INMRI), Casaccia Research Centre (Rome, Italy), using a reference 60Co gamma source. LiF crystals were irradiated in an acrylic phantom at doses of 1, 10, 20, 50, and 70 Gy. The dose-rate at the LiF crystals position within the acrylic phantom was 0.26 Gy/min. Dose measurements were traceable to the Italian National Standard of absorbed dose to water 25.
2.2 Transmittance and laser-induced PL measurements
All optical transmittance and laser-induced PL spectral measurements were performed at the FSN-TECFIS-MNF Laboratory of ENEA. Frascati Research Centre (Rome, Italy) in a period that spanned from six weeks to six months after their irradiation. All the measurements were performed at room temperature. The irradiated LiF crystals were guarded from light exposure after their irradiation and between transmittance and PL spectra measurements. However, the LiF crystals were exposed to ambient light during their manipulation. Their optical transmittance spectra were measured at normal incidence using a Perkin-Elmer Lambda 950 spectrophotometer (Waltham, MA, USA). The spectral range was set to 190–800 nm with a 1 nm resolution. For the laser-induced PL spectra measurements, an Argon laser tuned at 458 nm was used in continuous wave (CW) mode to simultaneously excite the F2 and F3+ CC emission. The custom laboratory set-up, sketched in Figure 1, was used to spectrally analyse the photoemission of the irradiated LiF crystals. The visible emission in the 480-800 nm range was analysed by a monochromator (Horiba Jobin Yvon Triax 320) equipped with a grating blazed at 500 nm, 2 nm resolution and detected by a photomultiplier (Hamamatsu H7422-50) using the lock-in technique. All the PL spectra were collected under 25 mW laser power, measured using a power meter placed at the LiF crystal position, where the estimated diameter of the illuminated spot was 6 mm. All the PL spectra were corrected for the instrumental response, which is relevant for an accurate physical interpretation of the results.
Figure 1. Laser-induced emission spectra measurement set-up: CH (Chopper), S1 and S2 plane mirrors, L (focusing lens), F (optical
filter), MN (monochromator) and PMT (photomultiplier tube). The Argon laser is tuned at 458 nm.
3. RESULTS AND DISCUSSION
Figure 2 shows the optical transmittance spectra of the LiF crystals irradiated at 10, 50 and 100 Gy with 6 MV X-rays and of an unirradiated (blank) LiF crystal. Only the F absorption band peaked around 248 nm is clearly observed for the 50 and 100 Gy dose levels. The broad M band, centred at about 450 nm, is not detectable even for the highest investigated dose. An estimation of the CC volume concentrations deduced from the transmittance spectra provided values of 1.251016 and 1.951016 cm-3 for the primary F defect in LiF crystals irradiated at 50 and 100 Gy, respectively. For the M band, the absorption values are comparable with measurement noise and only a rough estimation of the maximum concentration of F2 CCs induced by the irradiation, below 61014 cm-3, can be given20. Due to the low intensity of the M absorption band in the optical transmittance measurements, no attempt was made to pursue this strategy as a useful dosimetric signal at low doses21.
Figure 2. Room temperature optical transmittance spectra of pure LiF crystals of thickness 0.5 mm irradiated with 6 MV X-rays at 10, 50 and 100 Gy. The optical transmittance spectrum of an unirradiated (blank) LiF crystal of equal thickness is also reported for comparison.
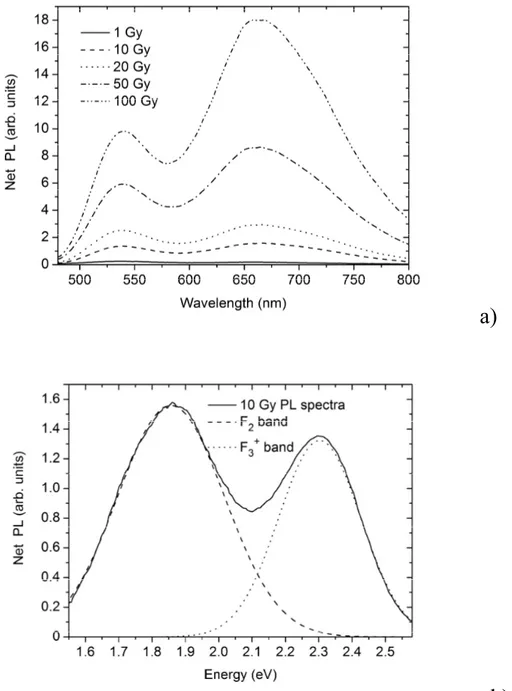
The PL spectra of all the five LiF crystals are reported in Figure 3a. These spectra show the net PL intensity, derived by subtracting a blank spectrum (the spectrum of an unirradiated LiF crystal, used as “zero dose” reference) from all the measured photoemission spectra. These net PL spectra clearly show the two characteristic broad emission bands of the aggregate F2 and F3+ defects, centred around 678 and 541 nm, respectively. After converting the wavelength to photon energy (nm to eV), the rescaled emission spectra were best-fitted as the sum of two Gaussian bands, as shown in Figure 3b. The areas under the Gaussian bands are associated with the contributions to the integrated PL intensities of the F2 and F3+ CCs.
The F2 band has a full-width half-maximum (FWHM) which varies from 0.42 eV for the 1 Gy-irradiated LiF crystal to 0.38 eV for the 100 Gy-irradiated one. The F3+ band FWHM is tighter, spanning from 0.30 to 0.27 eV in the same dose interval. The integrated PL intensity, defined as the sum of the PL intensities from the two Gaussian bands, was calculated for each spectrum. The integrated PL intensities as well as the separate F2 and F3+ band contributions to the integrated PL were used to derive their corresponding net PL responses.
a)
b)
Figure 3. (a) Laser-induced (458 nm) PL spectra for the five LiF crystals irradiated with 6 MV X-rays. The Net PL intensity is obtained by subtracting the background signal (given by an unirradiated “zero dose” LiF crystal) from the corresponding PL signal. (b) Net PL spectrum of the 10 Gy-irradiated LiF crystal showing the Gaussians bands used for the best fit of the F2 and F3+ band
contributions.
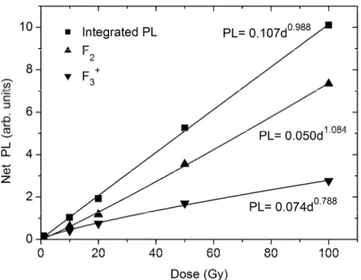
Each one of the net integrated PL intensities vs. dose, shown in Figure 4, was obtained from the average of three independent PL spectra measured at different times (1.5, 3 and 6 months) after the irradiations. The three independent PL measurements demonstrated an excellent reproducibility (within ±3%). The best fit of the net PL intensity vs. dose, shown as solid lines in Figure 4, was obtained by using the functional form PL=aDb, where D is the absorbed dose in Gy and a and b are fitting parameters. The total RPL intensity increases approximately linearly with absorbed dose (b = 0.988) in the 1-100 Gy interval (R2 = 0.99). This linear response is a very desirable feature of a radiation detector intended to be used for dosimetric applications. The F2 band red PL intensity shows a slightly supra-linear trend with dose while the F3+ band trend is clearly sub-linear. The relative contribution of the F2 band to the integrated RPL intensity consistently increases from 45 to 73 % in the 1-100 Gy absorbed dose range. This behaviour could be ascribed to the presence of a triplet state in the optical cycle of the F3+ centre22 and systematic RPL measurements as function of the laser exciting powers at several wavelengths in the spectral range of M absorption are necessary to verify its effects.
Figure 4. Net PL intensity of the integrated signal and F2 and F3+ Gaussian band contributions derived from the laser-excited spectra
vs. absorbed dose of the five LiF crystals irradiated with 6 MV X-rays of Figure 3a. The markers size is larger than the observed variation of the three measurements used to obtain the net PL. The best fit (solid lines) was performed using the formula PL=aDb,
where a and b are the fitting parameters and D is the absorbed dose (Gy).
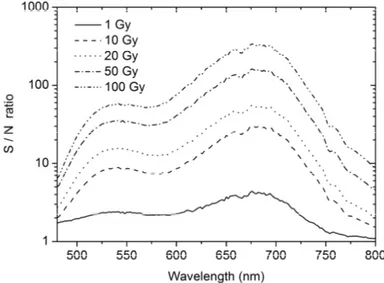
The signal-to-noise ratio (S/N), defined as the ratio of the spectral integrated PL signal of an irradiated LiF crystal to the one of the unirradiated crystal, increases from 2 to 67 in the 1 – 100 Gy range. Figure 5 shows the S/N values as functions of wavelength for the five irradiated LiF crystals. It can be seen that the S/N value is maximum around 675 nm, where the F2 emissionband is peaked. At this wavelength, the S/N ratio reaches a value of 4 for 1 Gy and 330 for 100 Gy. It is expected that by increasing the excitation power of the Ar laser, the intensity of the PL signal will increase. However, an increase in the background signal is also expected at increased laser power thus keeping the S/N almost unchanged, and further effects on the F3+ PL intensity22 and F
2 photobleaching should be carefully investigated.
A crucial way to increase the S/N ratio would be use of an excitation light source centred at 450 nm, which is closer to the absorption-peak wavelength of the M band, in particular of the F2 defects. Use of a more suitable optical filter to reduce the intensity of stray light scattered and/or induced by the laser excitation source in the PL spectral measurement system could also increase the S/N value and consequently decrease the value of the minimum detectable dose. One of the main challenges to effectively use the RPL of nominally pure LiF crystals as clinical dosimetric tool is to find ways for reducing the fluorescence background, which is associated with the crystal preparation and with the PL emission reading set-up.
Figure 5. Signal-to-noise ratio (S/N) values, for 25 mW laser power excitation at 458 nm, of the 6 MV X-ray irradiated LiF crystals. The noise is assumed to correspond to the emission spectrum of an unirradiated (blank) LiF crystal.
Similar results were obtained for LiF crystals irradiated by clinical 5 MV X-rays at the lowest doses, up to 20 Gy23. The PL spectra of the 60Co gamma-irradiated LiF crystals were also measured, and they were practically identical to those obtained for the 6 MV X-ray irradiated LiF crystals. In Figure 6 the integrated PL intensities vs. dose of the F2 and F3+ summed contributions of those gamma-irradiated crystals, derived from the laser-excited spectra and measured with the set-up of Figure 1 in the same experimental conditions, are compared with those of the 6 MV X-ray irradiated LiF crystals (reported in Figure 4).
It is worth mentioning that the rationale to perform the 60Co gamma-ray irradiation was not only to experimentally verify the expected similarity of the PL intensity between the 6 MV X-ray and 1.25 MeV (average) gamma emission from the 60Co source, but also to test a potential higher CC formation efficiency (detectable with a higher PL signal) per unit dose for the linac based pulsed source (6 MV X-ray) compared with the continuous 60Co gamma radiation source. The PL signal consistency between the 6 MV X-ray delivered at a dose-rate of 4.66 Gy/min and at the lower dose-rate of 0.26 Gy/min for the corresponding 60Co gamma irradiations suggests that no significant dose-rate dependence of pure LiF crystal RPL is expected to be observed for dose rates typically used for clinical applications in radiotherapy.
Figure 6. Net PL intensity of the integrated PL of F2 and F3+ contributions derived from the laser-excited spectra vs. absorbed dose
of the five 6 MV X-ray irradiated LiF crystals, as in Figure 4, compared with the ones obtained from gamma irradiated LiF crystals from the same batch, measured with the experimental set-up of Figure 1 in the same conditions.
Preliminary results indicate good reproducibility of the RPL signal after erasing the CCs by thermal annealing for 20 min at 500oC followed by fast cooling to room temperature24. More extensive thermal annealing-irradiation experiments are needed to properly assess the reproducibility and therefore the re-usability of LiF crystals that were previously exposed to clinically relevant doses for radiotherapy (<100 Gy).
4. CONCLUSIONS AND FURTHER WORK
The integrated intensities of laser-induced (excitation wavelength at 458 nm in continuous mode) visible PL spectra of nominally pure LiF crystals irradiated with a 6 MV X-ray clinical beam increases approximately linearly with absorbed dose in the 1-100 Gy range. The visible RPL emission spectra show the superposition of two broad emission bands, due to the F2 and F3+ aggregate CCs. The PL signals of theseradiation-induced defects are stable at room temperature under the applied measurement conditions. Such a stability allows for multiple readings of the irradiated LiF crystals with no appreciable detected change in the emitted visible RPL over the course of our investigation up to 6 months after irradiation. The F2 band contribution to the integrated PL intensity dominates for all the absorbed doses with the exception of the lowest dose (1Gy). The signal-to-noise ratio for the integrated PL increases from 2 to 67 in the 1–100 Gy dose range. This ratio is enhanced (from 4 to ~300) in the same dose range when the F2 peak signal (centred at ~ 678 nm) is used. Irradiations using 60Co gamma rays in the 1-70 Gy dose range at a dose rate of 0.26 Gy/min show the same visible PL emission spectra as those obtained from 6 MV X-ray beam irradiations at a dose rate of 4.66 Gy/min, suggesting that no significant dose-rate dependence on the pure LiF crystal RPL is expected to be observed for dose-rates that are typically used for clinical applications in radiotherapy.
An increase in the PL reading sensitivity (higher S/N) would be required to effectively evaluate absorbed doses below 1 Gy. This may be accomplished by using a LED based excitation source peaked at 450 nm and a suitable emission optical filtering. Re-usability of the LiF crystals and laser induced RPL reproducibility after thermal annealing require further investigation. The RPL of irradiated pure LiF crystals has the potential to become an effective clinical dosimeter; further research is under way to explore the role of the physical and chemical properties of the selected material and the most effective strategies to enhance the sensitivity of the proposed dosimetric platform.
BIBLIOGRAPHY
1 D. Farrington, C.A. Boyd, D.F. Saunders, “Thermoluminescence as a research tool”, Science Vol. 117, 343-349 (1953).
2 S.D. Miller and G.W.R. Endres, “Laser-induced optically stimulated M centre luminescence in LiF”, Radiat. Meas. 33, No. 1/4, 59-62 (1990).
3.T.T. Basiev, S.B. Mirov, and V.V. Osiko, “Room-temperature color center lasers”, IEEE J. Quantum Electron. 24,6, 1052-1069 (1988).
4.F. Agullo-Lopez, C.R.A. Catlow and P.D. Townsend, Point Defects in Materials, Academic, London, 1988. 5 L. Boetter-Jensen, S.W.S. McKeever, A.W. Wintle, Optically Stimulated Luminescence Dosimetry, Elsevier, 2003, ISBN: 978-0-444-50684-9.
6 L. Oster, S. Druzhyna, I. Orion, Y.S. Horowitz, “Study of combinations of TL/OSL single dosimeters for mixed high/low ionization density radiation fields”, Radiat. Meas. 56, 320-323 (2013).
7 L. Oster, S. Druzhyna, Y.S. Horowitz, “Optically stimulated luminescence in LiF:Mg,Ti: application to solid state radiation dosimetry”, Nucl. Instr. Meth. A 648, 261-265 (2011).
8 L. Oster, Y.S. Horowitz, L. Podpalov, “OSL and TL in LiF:Mg,Ti following alpha particle beta ray irradiation: Application to mix field radiation dosimetry”, Radiat. Prot. Dosim. 128 (3), 261-265 (2008). 9 B. Marczewska, P. Bilski, E. Mandowska, A. Mandowski, “Photoluminescence of gamma, proton and alpha-irradiated LiF detectors”, Cent. Eur. J. Phys. 10(4), 1009-1012 (2012).
10 A. Piaskowska, B. Marczewska, P. Bilski, A. Mandowski, E. Mandowska, "Photoluminescence measurements of LiF TL detectors”, Radiat. Meas. 56, 209-212 (2013).
11 L.C. Matsushima, R.G. Veneziani, L.L. Campos, “Study of optically stimulated luminescence of LiF:Mg,Ti for beta and gamma dosimetry”, Radiat. Meas. 56, 365-368 (2013).
12 P. Bilski, B. Marczewska, A. Twardak, E. Mandowska, A. Mandowski, “OSL signal of lithium fluoride and its relationship with TL glow-curves”, Radiat. Meas. 71, 61-64 (2014).
13 M. Piccinini, F. Ambrosini, A. Ampollini, M. Carpanese, L. Picardi, C. Ronsivalle, F. Bonfigli, S. Libera, M.A. Vincenti, R.M. Montereali, “Optical spectroscopy and imaging of colour centres in lithium fluoride crystals and thin films irradiated by 3 MeV proton beams”, Nucl. Instr. Meth. B 326, 72-75 (2014).
14 M. Piccinini, E. Nichelatti, A. Ampollini, L. Picardi, C. Ronsivalle, F. Bonfigli, S. Libera, M.A. Vincenti and R.M. Montereali, “Proton beam dose-mapping via color centers in LiF thin film detectors by fluorescence microscopy”, Europhysics Letters 117, 37004-1-5 (2017).
15 G. Baldacchini, F. Bonfigli, A. Faenov, F. Flora, R.M. Montereali, A. Pace, T. Pikuz, L. Reale, “Lithium Fluoride as a Novel X-Ray Image Detector for Biological -World Capture”, J. Nanoscience and Nanotechnology 3,6, 483-486 (2003).
16 F. Bonfigli, S. Almaviva, A. Cedola, I. Franzini, S. Lagomarsino, D. Pelliccia, R.M. Montereali, “Visible emitting color centers in lithium fluoride for X-ray imaging applications”, Radiat. Meas. 45, 599-601 (2010). 17 G. Baldacchini, E. De Nicola, R.M. Montereali, A. Scacco, V. Kalinov, Optical Bands of F
2 and F3+ centers in LiF, J. Phys. Chem. Solids 61, 21-26 (2000).
18 M.A. Vincenti, T. Marolo, R.M. Montereali, “Advanced optical spectroscopy of luminescent color centers in lithium fluoride thin films”, Radiat. Meas. 45, 359-361 (2010).
19 P.R. Almond, P J. Biggs, B.M. Coursey, W.F. Hanson, M. Saiful Huq, D.W.O. Rogers, “AAPM’s TG-51 protocol for clinical reference dosimetry of high-energy photon and electron beams”, Med Phys. 26, 1847– 1870 (1999).
20 J.E. Villarreal-Barajas, M. Piccinini, M.A. Vincenti, F. Bonfigli, R. Khan, R.M. Montereali, “Visible photoluminescence of colour centres in LiF crystals for absorbed dose evaluation in clinical dosimetry”, IOP Conf. Series: Materials Science and Engineering 80, 12020, 1-5 (2015).
21 W.L. McLaughin, “Colour centres in LiF for measurement of absorbed doses up to 100 MGy”, Rad. Prot. Dosimetry 66, 1-4, 197-200 (1996).
22 G. Baldacchini, M. Cremona, G. d’Auria, R.M. Montereali and V. Kalinov, “Radiative and nonradiative processes in the optical cycle of the F3+ center in LiF”, Physical Review B 54,24, 17508-17514 (1996). 23 R.M. Montereali, F.Bonfigli, M.Piccinini, M.A. Vincenti, R. Khan, J.E. Villarreal-Barajas, “Visible photoluminescence of color centers in LiF crystals exposed to 6 MV x ray clinical beams”, Biophysics & Bioeng. Letters 8(1), 19-22 (2015).
24 G. Baldacchini, R.M. Montereali, E. Nichelatti, V.S. Kalinov, A.P. Voitovich, A.T. Davidson, A.G. Kozakiewicz, “Thermoluminescence in pure LiF crystals: Glow peaks and their connection with color centers”, J. Appl. Phys. 104, 063712 1-10 (2008).
25 A.S. Guerra, R.F. Laitano, M. Pimpinella, “Characteristics of the absorbed dose to water standard at ENEA”, Phys. Med. Biol. 41, 657-674 (1996).
ENEA
Servizio Promozione e Comunicazione
www.enea.it
Stampa: Laboratorio Tecnografico ENEA - C.R. Frascati maggio 2020