Dipartimento di Medicina e Chirurgia
Corso di Dottorato in Medicina Traslazionale e Clinica
XIV Ciclo
T
ESI DI
D
OTTORATO
Translational pharmacogenomics:
a study of warfarin dosing
Coordinatore
Candidata
Ch.ma Prof. Amelia Filippelli
Giusy Russomanno
Tutor
Ch.ma Prof. Viviana Izzo
Tutor Esterno
Ch.mo Prof. Sir Munir Pirmohamed
ABSTRACT ... i
SOMMARIO ... ii
ACKNOWLEDGEMENTS ... iii
ABBREVIATIONS ... iv
CHAPTER 1: General Introduction ... 1
CHAPTER 2: Pharmacogenetic-based warfarin dosing algorithm in Southern Italians ... 45
CHAPTER 3: Circulating miRNAs as novel biomarkers of response to warfarin ... 90
CHAPTER 4: Warfarin Extreme Phenotypes: A Genome-Wide Association Study ... 141
CHAPTER 5: Final Discussion ... 188
BIBLIOGRAPHY ... 204
ABSTRACT
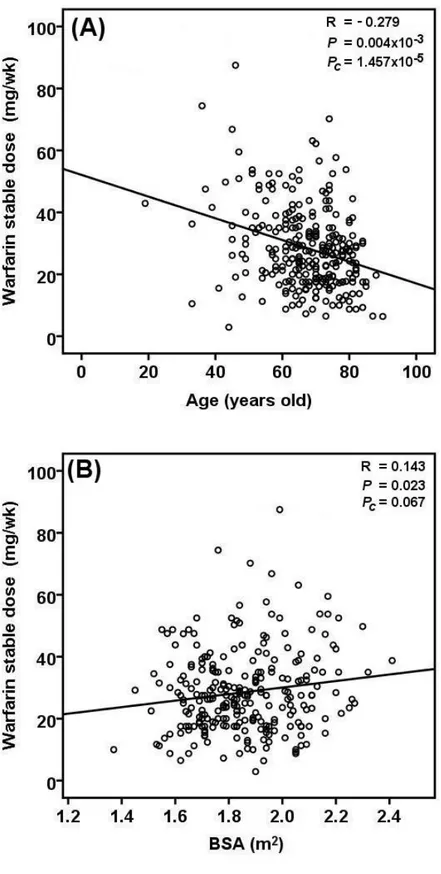
Warfarin is one of the most commonly used oral anticoagulants worldwide and is highly efficacious for the treatment and prevention of thromboembolic disorders. However, due to its narrow therapeutic index, large inter-individual variability in dose requirements, and extensive drug and food interactions, warfarin remains a challenging drug to prescribe. Genetic factors (CYP2C9 and VKORC1), together with clinical factors (age and body weight), account for up to 60% of warfarin dose variance, whereas ~40% variability remains poorly understood.
Several warfarin dosing algorithms, comprising genetic and non-genetic covariates have been published over the years. However, none of the published algorithms included patients from Southern Italy. We therefore conducted a candidate-gene study to develop an algorithm for predicting warfarin maintenance dose in patients from the Campania Region (n=266) in Southern Italy. Our pharmacogenetic dosing algorithm consisted of six variables (age, body surface area, amiodarone intake, CYP2C9*2, CYP2C9*3, and VKORC1 -1639G>A). It led to the accurate prediction of warfarin maintenance dose in 44% of patients (mean absolute error 7.41 mg/week). The prediction accuracy of the pharmacogenetic algorithm was superior to three previously published pharmacogenetic algorithms derived from patients in Northern and Central Italy.
Given that previous studies suggested a role for miR-133a in warfarin response, we conducted a pilot study comparing baseline serum levels of miRNA in patients who achieved warfarin stable dose (n=10) to those who did not achieve warfarin stability (n=10), using the Affymetrix miRNA array. No association was found between miRNA-133a and warfarin response. Interestingly, circulating levels of miR-548a-3p were observed to be higher in patients who did not achieve warfarin stability (P=0.0053, fold change =1.66) compared to patients who achieved stable dose. In silico analyses showed that several target genes of miR-548a-3p are involved in the coagulation pathway. Work is currently underway to validate and replicate these findings in a larger cohort of prospectively recruited patients initiated onto warfarin therapy (n=980) using TaqMan miRNA real-time quantitative PCR.
Pharmacogenetic algorithms have shown that common variants in CYP2C9 and VKORC1 genes cannot fully explain the extreme dose requirements in individuals sensitive and resistant to warfarin. To investigate the role of other genetic variants in these patients with extreme phenotypes, we performed a genome-wide association study (GWAS) comprising of warfarin sensitive patients (≤1.5 mg/day, n=55), warfarin resistant patients (≥10 mg/day, n=51), and healthy controls from the National Blood Service (NBS, n=2,501). Our results suggested that an intergenic variant on chromosome 10, rs4918797, could be involved in warfarin sensitivity. Intronic SNPs in MIR6873 on chromosome 6 (rs114213056) and PIGN on chromosome 18 (rs10163900, rs76455916, rs77118150, and rs79434376) showed suggestive association with warfarin resistance.
The findings of this thesis showed that a multitude of factors affect warfarin dosing, some of which still need further investigations. Insights of the roles of other factors such as non-coding RNA and rare genetic variants will hopefully improve dose prediction and drug efficacy and ultimately patient outcomes. The work being undertaken with warfarin acts as a pathfinder project, the concepts from which could
Il warfarin è un farmaco anticoagulante orale largamente utilizzato per la prevenzione e il trattamento di eventi tromboembolici. Il trattamento con warfarin, tuttavia, risulta poco maneggevole a causa della sua stretta finestra terapeutica, dell’elevata variabilità inter-individuale nella dose richiesta e delle numerose interazioni con farmaci e alimenti. Fattori genetici (CYP2C9 e VKORC1) e variabili cliniche (età e peso) spiegano circa il 60% della variabilità nella dose che si osserva nei pazienti in trattamento, mentre il 40% circa è legato a fattori non ancora noti.
Diversi algoritmi per determinare la dose individuale di warfarin sulla base di variabili cliniche e genetiche sono stati sviluppati nel corso degli anni, ma nessuno degli studi italiani pubblicati finora ha incluso pazienti del Sud Italia. Per tale ragione, abbiamo condotto uno studio gene-candidato al fine di sviluppare un algoritmo farmacogenetico per calcolare la dose di mantenimento di warfarin in 266 pazienti Campani. Un algoritmo a sei variabili (età, superficie corporea, uso di amiodarone, CYP2C9*2, CYP2C9*3 e VKORC1 -1639G>A) è stato derivato, permettendo l’accurata determinazione della dose nel 44% dei pazienti considerati (errore medio assoluto di 7.41 mg settimanali). Il potere predittivo di tale algoritmo farmacogenetico si è dimostrato superiore a quello di tre algoritmi farmacogenetici pubblicati includendo pazienti del Centro e Nord Italia.
Sulla base di studi che suggerivano un possibile ruolo di miR-133a nel meccanismo di risposta al warfarin, abbiamo condotto uno studio pilota per comparare i livelli basali di espressione dei microRNA (miRNA) (Affymetrix miRNA array) in pazienti in trattamento con warfarin che raggiungevano (n=10) o meno (n=10) la dose stabile. Mentre per miR-133a non è stata trovata nessuna differenza significativa, i livelli sierici di miR-548a-3p erano più elevati nei pazienti che non raggiungevano la dose stabile (P=0.0053). Analisi in silico hanno dimostrato che diversi geni target di miR-548a-3p sono coinvolti nella cascata della coagulazione. I risultati ottenuti sono al momento in fase di validazione e replicazione in una coorte prospettica di pazienti in trattamento con warfarin (n=980) mediante TaqMan miRNA real-time quantitative PCR.
Considerato che polimorfismi genetici in VKORC1 e CYP2C9 non sono i soli determinanti di dosi estremamente basse o elevate in pazienti sensibili o resistenti al warfarin, per l’individuazione di nuove varianti genetiche coinvolte nei fenotipi estremi di risposta al farmaco, abbiamo condotto uno studio di associazione genome-wide includendo pazienti sensibili al warfarin (≤1,5 mg/die, n=55), pazienti resistenti (≥10 mg/die, n=51) e controlli sani (n=2501). Una variante intergenica nel cromosoma 10, rs4918797, è stata significativamente associata alla sensibilità al warfarin, mentre varianti introniche nei geni MIR6873 nel cromosoma 6 (rs114213056) e PIGN nel cromosoma 18 (rs10163900, rs76455916, rs77118150, e rs79434376) erano indicativi di resistenza.
I risultati di questo lavoro di tesi dimostrano che una serie di fattori influenzano la dose di warfarin. Ulteriori studi sul ruolo dei miRNA e di varianti genetiche rare potrebbero dimostrarsi utili per migliorare l’accuratezza degli algoritmi per il calcolo della dose di warfarin e, di conseguenza, aumentare la sicurezza e l’efficacia del trattamento. Infine, l’approccio utilizzato in questo studio potrebbe essere applicato anche ad altri farmaci per i quali il dosaggio dovrebbe essere individualizzato.
ACKNOWLEDGEMENTS
First and foremost, I would like to express my sincere gratitude to Professor Amelia Filippelli for her support throughout the years. Her kindness, encouragement, guidance, unsurpassed knowledge and inspiring ideas have made my study immensely enjoyable and rewarding. I would not have come this far without her help. Thanks go out to my supervisor Professor Viviana Izzo, for being such a fabulous mentor, guide and great friend.
A big thank to Professor Sir Munir Pirmohamed for giving me this invaluable opportunity to study and research at the Wolfson Centre for Personalised Medicine in Liverpool. It has been an honour to work with you. Thanks for all the inspiring and motivating discussions, you have taught me many lessons in life that I will never forget.
This PhD thesis would have been not possible without the enormous help and kind guidance of Dr Eunice Zhang, enthusiastic researcher and lovely friend. You made me fell home since my first day in Liverpool. Thanks for sharing with me much more than just knowledge. I owe you sincere gratitude, and words will never be enough.
Thanks to Professor Lucia Sacchetti and Dr Cristina Mazzaccara for their help with the pharmacogenetic-based warfarin dosing algorithm in Southern Italians. Thanks to Dr Ana Alfirevic for her encouraging words and advices, and to Sam and Angela for their kindness and patience with all my paper-work. Thanks for being such lovely people!
Thanks to my colleagues and friends, Valentina, Vittorio, Federica, Francesca, Ilaria, and Daniela for all the years we spent together, and to Michela, you will always be with us.
To the members of The Wolfson Centre for Personalised Medicine. You have all made my stay in Liverpool unforgettable. My special thanks to Alex, Ana, Andrea, Athina, Benedicta, Carmen, Christine, Dan, Fabio, George, Gospel, Gurpreed, James, Joe, John, Kate, Lorna, Nathalia, Philippe, Reyad, Sarah, Sam, Sammy, Stephanie, Sudeep, and to my favourite technicians, Laurence and Terry.
Words of thanks will never be enough for my best friend Giusy who has been always there for me. “We were but stones, your light made us stars”. Thanks to Mario for being such a lovely (and jealous) brother. To Ale and Carmen, because home is where a hug is (and maybe very close to Eric’s).
I owe deep gratitude towards my family especially my beloved mum and dad for their constant support, patience, encouragement and endless love. My love and thanks also goes to Myry and Francesco, who make me proud every day and give me strength and courage to go on.
ABBREVIATIONS
ABCB1 ATP binding cassette, subfamily B, member 1
ADRs adverse drug reactions
AF atrial fibrillation
AIFA Italian Medication Agency
AMI acute myocardial infarction
ANOVA analysis of variance
APC activated protein C
APOE apolipoprotein E
B.C. before Christ
BMI body mass index
bp base pairs
BSA body surface area
Ca2+ calcium
CALU calumenin
cDNA complementary DNA
CEU Utah residents with ancestry from northern and western Europe
CHB Han Chinese in Beijing, China
Chr chromosome
CM concomitant medications
CO2 carbon dioxide
COAG Clarification of Optimal Anticoagulation through Genetics
CPB2 carboxypeptidase B2
CPIC Clinical Pharmacogenetics Implementation Consortium
Ct cycle threshold
CV coefficient of variation
CVA cardiovascular accident
CYP cytochrome P450
CYP1A1 cytochrome P450, family 1, subfamily A, polypeptide 1
CYP1A2 cytochrome P450, family 1, subfamily A, polypeptide 2
CYP1A6 cytochrome P450, family 1, subfamily A, polypeptide 6
CYP2A6 cytochrome P450, family 2, subfamily A, polypeptide 6
CYP2C115P cytochrome P450, family 2, subfamily C, polypeptide 115, pseudogene
CYP2C18 cytochrome P450, family 2, subfamily C, polypeptide 18
CYP2C19 cytochrome P450, family 2, subfamily C, polypeptide 19
CYP2C59P cytochrome P450, family 2, subfamily C, polypeptide 59, pseudogene
CYP2C8 cytochrome P450, family 2, subfamily C, polypeptide 8
CYP2C9 cytochrome P450, family 2, subfamily C, polypeptide 9
CYP2D6 cytochrome P450, family 2, subfamily D, polypeptide 6
CYP3A4 cytochrome P450, family 3, subfamily A, polypeptide 4
CYP3A5 cytochrome P450, family 3, subfamily A, polypeptide 5
DAVID Database for Annotation, Visualization and Integrated Discovery
DHPLC denaturing high performance liquid chromatography
dNTP deoxynucleotide triphosphate
E efficiency
EDTA ethylenediaminetetraacetic acid
ENCODE Encyclopedia of DNA Elements
EPHX1 epoxide hydrolase 1
EU-PACT European Pharmacogenetics of Anticoagulant Therapy
F2 coagulation factor II
F5 coagulation factor V
F7 coagulation factor VII
F9 coagulation factor IX
F10 coagulation factor X
FDA Food and Drug Administration
FDR false discovery rate
FG fibrinogen
GAS6 growth-arrest-specific protein 6
GGCX -glutamyl carboxylase
Gla -carboxyglutamic acid
Glu glutamic acid
GWAS genome-wide association study
H2O water
HDL high-density lipoprotein
HGP Human Genome Project
HMG-CoA 3-hydroxy-3-methylglutaryl-coenzyme A
HMGIC high-mobility group protein Isoform I-C
HMWK high molecular weight kininogen
HSD3B7 hydroxy-5-steroid dehydrogenase, 3 beta- and steroid delta-isomerase 7
HWE Hardy-Weinberg Equilibrium
IBD identity by descent
INR international normalized ratio
ISI international sensitivity index
IWPC International Warfarin Pharmacogenetics Consortium
JPT Japanese in Tokyo, Japan
LD linkage disequilibrium
LHFPL3 lipoma high-mobility group protein Isoform I-C fusion partner-like 3 LOC101928762 RNA gene, affiliated with the ncRNA class
LRT likelihood ratio test
MAF minor allele frequency
MASP1/2 mannan-binding lectin serine peptidase 1 and 2
MDR1 multidrug resistance protein 1
MeV MultiExperiment Viewer
MGB minor groove binder
MgCl2 magnesium chloride
MI myocardial infarction
miRNA microRNA
mRNA messenger RNA
NAD(P)H nicotinamide adenine dinucleotide phosphate
NBS National Blood Service
NCBI National Centre for Biotechnology Information
ncRNA non-coding RNA
NFQ non-fluorescent quencher
(NH4)2SO4 ammonium sulphate
NOAC novel oral anticoagulant
NQO1 NAD(P)H dehydrogenase, quinone 1
NR1I2 nuclear receptor subfamily 1, group I, member 2
NR1I3 nuclear receptor subfamily 1, group I, member 3
NSAIDs nonsteroidal anti-inflammatory drugs
O2 oxygen
ORM1 orosomucoid 1
ORM2 orosomucoid 2
PCA principal-component analysis
PCR polymerase chain reaction
PE pulmonary embolism
PIGN phosphatidylinositol glycan anchor biosynthesis, class N
PK prekallikrein PLG plasminogen PROC protein C PROS1 protein S PROZ protein Z PT prothrombin time Q quencher QC quality control qPCR quantitative PCR
RCT randomised controlled trial
RT reverse transcription
SD standard deviation
SE standard error
SETD1A SET domain containing 1A
SNORA small nucleolar RNA, H/ACA box
SNORD small nucleolar RNA, C/D box
SNP single nucleotide polymorphism
SPSS Statistical Package for the Social Sciences
Std standard
STX1B syntaxin 1B
TAC Transcriptome Analysis Console
TBE tris borate EDTA
TE Tris-EDTA buffer
TEAA triethylammonium acetate
TF tissue factor
TFPI tissue factor pathway inhibitor
TIA transient ischaemic attack
Tris-HCl 2-amino-2-hydroxymethyl-1,3-propanediol hydrochloride
TTR time in the therapeutic INR range
UTR 3’ untranslated region
UV ultraviolet
VDR vitamin D receptor
VKOR vitamin K 2,3-epoxide reductase
VKORC1 vitamin K epoxide reductase complex, subunit 1
VTE venous thromboembolism
vWF von Willebrand factor
WEP warfarin extreme phenotype study samples
CHAPTER 1
CONTENTS
1.1 Variability in drug response... 3
1.2 Single nucleotide polymorphism and personalised medicine ... 7
1.3 Pharmacogenetics and pharmacogenomics ... 9
1.4. The blood coagulation system ... 11
1.4.1 Extrinsic pathway ... 14
1.4.2 Intrinsic pathway ... 14
1.4.3 Common pathway... 15
1.4.4 Coagulation pathway regulators ... 16
1.5 Warfarin ... 16
1.5.1 Clinical use of warfarin ... 17
1.5.2 Pharmacokinetics of warfarin ... 20
1.5.3 Pharmacodynamics of warfarin ... 21
1.6 Clinical and environmental factors affecting warfarin response ... 24
1.7 Genetic contributions to warfarin response... 27
1.7.1 CYP2C9 ... 27
1.7.2 VKORC1 ... 29
1.7.3 CYP4F2 ... 31
1.7.4 Other genetic factors ... 32
1.8 Warfarin dosing algorithms ... 38
1.9 miRNAs as potential biomarkers of therapy response ... 41
1.1 Variability in drug response
“Every individual is different from another and hence should be considered as a different entity. As many variations are there in the universe, all are seen in human beings”.
Charaka Samhita
Patients vary widely in their responses to drugs. A treatment with the “one-size-fits-all” approach that inherently ignores the marked inter-individual variation which exists in response to medications has nowadays been replaced by the idea that therapy should be personalised. Personalised
medicine is defined as medical care for each patient’s unique condition, and
its ultimate goal is to administer “the right dose of the right drug to the right person at the right time”.
The significance of personalised medicine has long been understood by clinicians since 1500 B.C. (Chatterjee and Pancholi, 2011). Ayurveda, the ancient Indian, traditional Chinese and Korean science of medicine, has long considered and practiced individualized treatment schedules (Joshi et al., 2010). Hippocrates, the father of western medicine, advocated personalized medicine. He considered factors like age, physique and patient's constitution while prescribing drugs to his patients (Sykiotis et al., 2005)since they did not respond to drug therapies in a uniform and predictable manner (Roden et al., 2011).
It is well known that drug response is a gene-by-environment phenotype. There are multiple contributory factors in drug response variation such as gender, age, body mass, diet, the presence of other drugs or of
particular disease states and exposure to certain chemicals or toxins, such as cigarette smoke (Figure 1.1) (Vesell, 1991). The individual’s response to a drug depends on the complex interplay between environmental and genetic factors.
Individual variations can influence the rate of absorption, distribution, metabolism, and elimination of the medication leading to varied plasma concentrations or excretion profiles, resulting in lack of efficacy or induced toxicity (Evans and Relling, 1999).
The inter-patient heterogeneity in drug efficacy and toxicity has a potential impact on the quality and cost of healthcare. This variability is seen, not only in beneficial responses, but also in adverse drug reactions (ADRs), an increasingly recognized problem that extracts a huge toll on lives and in healthcare costs (Brewer and Colditz, 1999; Spear et al., 2001).
Understanding the role of genetics in drug responses could thus ensure better therapeutic efficiency and reduce the incidence of ADRs (Figure 1.2). A combinatory approach evaluating clinical, environmental and genetic factors is crucial to succeed in personalising and stratifying drug therapy.
Figure 1.1. Exogenous and endogenous factors contribute to variation in drug response. The circular design shows the multiplicity of either well-established or suspected host factors that may influence drug response. The outer circular line indicates the close inter-relationship between all such factors. Arrow from each factor indicates the effect of each host factor on drug response. Adapted from Vesell, 1991.
Figure 1.2. Personalised medicine. Personalised medicine promises to transform the delivery of healthcare to patients. Its aim is to evolve from a reactive “one-size-fits-all” system towards a system of predictive, preventive, and precision care. This picture depicts how personalised medicine could classify people into smaller subsets on the basis of the therapy response from one large disease group. Genetic tests can help stratify patients to those who would respond effectively to a specific drug and those who would experience an ADR.
1.2 Single nucleotide polymorphism and personalised
medicine
Each individual inherits their genome from the parents and the inherited differences in DNA sequence contribute to phenotypic variation influencing individual’s anthropometric characteristics, risk of diseases and response to environment (Ye, 2005). The recognition of these inter-individual differentiations that brings variation in drug response is an essential step towards personalized medicine.
Following the conclusion of the Human Genome Project (HGP) in 2003 (International Human Genome Sequencing Consortium, 2004), substantial progress has been made in human genetics and genomics research over the past decade (Lander et al., 2001; Venter et al., 2001). Several large-scale international projects have been launched, such as the International HapMap Project, the Encyclopedia of DNA Elements (ENCODE) Project, the 1000 Genomes Project, and the 10K Genome Project (1000 Genomes Project Consortium et al., 2010, 2012, 2015; ENCODE Project Consortium, 2004; International HapMap 3 Consortium et al., 2010; International HapMap Consortium, 2003, 2005; International HapMap Consortium et al., 2007; Koepfli et al., 2015), contributing to our understanding and knowledge of human genetics and genomics.
There are over 3 billion base pairs across the human genome, encoding over 22,000 genes. Although humans are 99% identical, the 1% difference between two individuals’ genome includes more than 12 million potential variations (1000 Genomes Project Consortium et al., 2010; International HapMap Consortium et al., 2007). Genetic variants that occur
infrequently at less than 1% in the population are called “mutations”, whereas variants that occur more frequently at 1% or greater are called “polymorphisms”, and they include insertions or deletions, copy-number variations, variable number of tandem repeats and single nucleotide polymorphisms (SNPs).
Single nucleotide polymorphisms are the major source of heterogeneity, accounting for nearly 90% of all sequence variations (Collins et
al., 1998). SNPs occur on average about every 100 to 300 bases along the
human genome, and are present in both coding and noncoding regions. SNPs located in the coding regions are classified into (i) synonymous, and (ii) nonsynonymous. Synonymous SNPs do not affect the protein sequence, while nonsynonymous SNPs cause a change in the amino acid sequence of the protein (Hunt et al., 2009). These polymorphisms in any one gene, including those coding for drug receptors, drug transporters and cell signalling pathways can be an important determinant of clinical response and susceptibility to diseases (Nebert et al., 2013).
SNPs are evolutionarily stable, not changing much from generation to generation. The natural process of non-random association of two or more alleles at two or more physically proximate loci is known as “linkage disequilibrium” (LD). Alleles occurring together on the same chromosome and which tend to be inherited together are known as a "haplotype" (Daly et al., 2001; Gabriel et al., 2002; Reich et al., 2001). The regions of DNA that are in LD remain unchanged during recombination and thus "travel together" in transmitting the genomic material from parent to offspring. This efficiently permits the investigation of only one representative SNP that can serve as a
"tag" for nearby SNPs and haplotype blocks by decreasing the number of total SNPs that need testing directly. This has been utilised in the design of genome-wide association studies (GWAS) (Barrett and Cardon, 2006; Eberle
et al., 2007; International HapMap Consortium et al., 2007; Li et al., 2008).
1.3 Pharmacogenetics and pharmacogenomics
The history of pharmacogenetics dates back to 510 B.C. when Pythagoras noted that ingestion of fava beans resulted in a potentially fatal reaction in some, but not all, individuals (Nebert, 1999). The notion that genetic variants might modulate variability in drug action was first proposed by the English physiologist Archibald Garrod (1923). He suggested that enzymatic defects not only lead to aggregation of endogenous substrates in “inborn errors of metabolism”, but also to aggregation of exogenously administered substrates, such as food, toxins and drugs, with clinical concerns (Garrod, 1923).
The concept of familial clustering of unusual drug responses was strengthened during the 1940s with the observation of a high incidence of haemolysis on exposure to antimalarial drugs among individuals with glucose-6-phosphate dehydrogenase deficiency (Beutler et al., 1955). In the 1950s, Price-Evans and colleagues identified N-acetylation as a major route of isoniazid elimination (Evans et al., 1960). Although individuals varied substantially in the extent to which a single dose of the drug was acetylated, variability between monozygotic twins was found to be small when compared with dizygotic twins (Bönicke and Lisboa, 1957), laying the groundwork for
studies that defined the clinical consequences and genetic basis of the fast and slow acetylator phenotypes (Evans, 1984; Wolkenstein et al., 1995). The past half century has seen developments in the understanding of the molecular basis of drug disposition and drug action, and of the mechanisms that determine the observed variability in drug action. Hence, the concept of a familial component in drug action initiated the field of pharmacogenetics, even before the discovery of DNA as the repository of genetic information.
The word pharmacogenetics was first used in 1959 by the German Pharmacologist Friedrich Vogel, and two years before, Arno Motulsky wrote a paper on how “drug reactions may be considered pertinent models for demonstrating the interaction of heredity and environment in the pathogenesis of disease” (Motulsky, 1957; Vogel, 1959).
Pharmacogenetics can thus be defined as the study of variability in drug response due to heredity (Nebert, 1999). Pharmacogenetics is aimed to determine the genetic differences in metabolic pathways which can affect individual responses to drugs, both therapeutically and adversely (Motulsky and Qi, 2006). The term has been coined together from the words pharmacology (the study of action of drugs in the human body) and genetics (the study of inheritance of traits). In pharmacogenetics, the analysis of a specific gene, or group of genes, may be used to predict responses to a specific drug or class of drugs. Phenotypes are scrutinized by low or exaggerated pharmacological effects, frequency of side effects, and difference in the rate of metabolism.
With the increased understanding of the molecular, cellular and genetic determinants of drug action, the emergence of the Human Genome
project, and the development of the genome sciences in the 1990s (1000 Genomes Project Consortium et al., 2010), has come the appreciation that variants in many genes might contribute to variability in drug action. Thus, the concept of using whole-genome information to predict drug action is one definition of the more recent term, pharmacogenomics (Evans and Relling, 1999; Meyer, 2000; Roses, 2000), introduced for the first time in 1997 by Marshall (Marshall, 1997). While the term pharmacogenetics is largely used in relation to genes determining drug metabolism, the latter term, pharmacogenomics, is a broader based term that encompasses all genes in the genome that may determine drug response.
Although there are constant debates in the literature as to which term should be used, both refer to the need to personalise or stratify drug therapy in order to maximise the efficacy and minimise the toxicity of drugs. For this reason, both terms are often used interchangeably (Grant, 2001; Pirmohamed, 2001).
1.4 The blood coagulation system
Coagulation is the process by which blood changes from a liquid to a gel, forming a clot. It potentially results in haemostasis, the cessation of blood loss from a damaged vessel, followed by repair. The mechanism of coagulation involves activation, adhesion, and aggregation of platelets along with deposition and maturation of fibrin.
Coagulation begins almost instantly after an injury to the blood vessel, when the endothelium lining the vessel is damaged. Disruption of the
endothelium exposes platelets to collagen in the vessel wall and clotting factor VII (FVII) to extravascular tissue factor (TF), which ultimately leads to fibrin formation. Platelets immediately form a plug at the site of injury (primary haemostasis). Other proteins, such as von Willebrand factor (vWF), facilitate the binding of platelets to the injured vessel wall. Secondary haemostasis occurs simultaneously: additional clotting factors beyond FVII respond in a complex cascade to form fibrin strands, which strengthen the platelet plug (Furie and Furie, 2005).
The coagulation cascade of secondary haemostasis has two initial pathways that lead to fibrin formation. These are the extrinsic pathway (also known as tissue factor pathway), and the intrinsic pathway (also known as contact activation pathway). The extrinsic and the intrinsic pathways both activate the final common pathway of factor X, thrombin and fibrin (Figure 1.3) (Davie and Ratnoff, 1964; Macfarlane, 1964).
Figure 1.3. The coagulation cascade. The extrinsic pathway is initiated upon vascular injury which leads to exposure of the tissue factor (TF). The contact activation pathway begins with formation of the primary complex on collagen consisting of high-molecular-weight kininogen (HMWK), prekallikrein (PK), and factor XII. The common point in both pathways is the activation of factor X to factor Xa. Factor Xa converts prothrombin to thrombin, which activates factor VIII, protein C, and factor V. Activated protein C (APC) inactivates factors Va and VIIIa. Protein Z inhibits factor Xa. Tissue factor pathway inhibitor (TFPI) inhibits the action of TF. Warfarin inhibits biologic activation of factors II, VII, IX, and X as well as proteins C and S (Horton and Bushwick, 1999). Green arrows depict activation, while red lines depict inhibition.
1.4.1 Extrinsic pathway
The main role of the extrinsic pathway is to generate a thrombin burst. Following damage to the blood vessel, FVII leaves the circulation and comes into contact with TF expressed on tissue-factor-bearing cells (stromal fibroblasts and leukocytes), forming an activated complex (TF-FVIIa) (Figure 1.3). TF-FVIIa activates factors IX and X. FVII is itself activated by thrombin, and factors XIa, XIIa and Xa. The activation of factor X (to form factor Xa) by TF-FVIIa is almost immediately inhibited by tissue factor pathway inhibitor (TFPI). Factor Xa and its co-factor factor Va form the prothrombinase complex, which activates prothrombin (factor II) to thrombin (factor IIa). Thrombin then activates other components of the coagulation cascade, including factors V and VIII, which activates factor XI. Factor XIa, and in turn, activates factor IX, which activates factor VIII releasing factor VIII from vWF.
1.4.2 Intrinsic pathway
Initiation of the intrinsic pathway occurs when prekallikrein (PK), high-molecular-weight kininogen (HMWK), factor XI and factor XII are exposed to the negatively charged phospholipids on the damaged vessel surface (contact phase) (Figure 1.3). The conversion of prekallikrein to kallikrein activates factor XII to factor XIIa. Factor XIIa then activates factor XI to factor XIa. Factor XIIa will also hydrolyse more prekallikrein to kallikrein, establishing a reciprocal activation cascade. In the presence of calcium (Ca2+), factor XIa activates
factor IX to factor IXa. The activation of factor Xa requires assemblage of the
platelets. The role of factor VIII in this process is to act as a receptor, in the form of factor VIIIa, for factors IXa and X. Factor VIIIa is termed a cofactor in the clotting cascade. The activation of factor VIII to factor VIIIa occurs in the presence of minute quantities of thrombin. As the concentration of thrombin increases, factor VIIIa is ultimately cleaved by thrombin and inactivated. This dual action of thrombin, upon factor VIII, acts to limit the extent of tenase complex formation and thus the extent of the coagulation cascade.
1.4.3 Common pathway
The common point in both the extrinsic and intrinsic pathways is the activation of factor X to factor Xa. Factor Xa activates prothrombin to thrombin, and thrombin in turns activates factor V to factor Va. Factor Va acts as a cofactor in the formation of the prothrombinase complex by binding to specific receptors on the surfaces of activated platelets and forms a complex with prothrombin and factor Xa (Figure 1.3).
Finally, thrombin converts fibrinogen to fibrin. Thrombin also activates factor XIII to factor XIIIa, a highly specific transglutaminase that introduces cross-links between the fibrin manomers, solidifying the fibrin clot. In addition to its role in activation of fibrin clot formation, thrombin plays an important regulatory role in coagulation. Thrombin combines with thrombomodulin present on endothelial cell surfaces forming a complex that converts protein C to activated protein C (APC). The cofactor protein S and protein APC degrade factors Va and VIIIa, thereby limiting their activity in the coagulation cascade.
1.4.4 Coagulation pathway regulators
Other regulators of the coagulation pathway are protein Z, TFPI and antithrombin III. Protein Z is a cofactor which forms a calcium ion-dependent complex with factor Xa at phospholipid surfaces enhancing the inhibition of factor Xa (Broze, 2001; Macfarlane, 1964). TFPI limits the action of tissue factor, thereby inhibits excessive TF-mediated activation of factors VII and X. Antithrombin III is a serine protease inhibitor that degrades the serine proteases: thrombin and factors IXa, Xa, XIa, and XIIa.
1.5 Warfarin
Warfarin (3-α-acetylbenzyl-4-hydroxycoumadin) is a synthetic derivative of dicoumarol, a 4-hydroxycoumarin-derived mycotoxin anticoagulant originally discovered in spoiled sweet clover-based animal feed. In the 1920s, cattle in North USA and Canada were afflicted by an outbreak of an unusual disease, characterised by fatal bleeding, either spontaneously or from minor injuries. This was later linked to their diet of mouldy sweet clover hay (Melilotus alba and M. officinalis) (Roderick, 1929; Schoefield, 1924) which was found to contain a haemorrhagic factor that reduced the activity of prothrombin (Roderick, 1931). However, it was not until 1940 that Karl Link and his student Harold Campbell in Wisconsin discovered that the anticoagulant in sweet clover was 3,3′-methylenebis (4-hydroxycoumarin) (Campbell and Link, 1941). Further work by Link led to the synthesis of warfarin in 1948, which was initially approved as a rodenticide in
the USA in 1952, and then for human use in 1954 (Clatanoff et al., 1954; Link, 1959; Shapiro, 1953). The name warfarin is derived from WARF (Wisconsin Alumni Research Foundation) and –arin from coumarin.
Warfarin has significant variability in pharmacological response among individuals, with doses varying between 1 to 20 mg per day (Johnson
et al., 2011; Klein et al., 2009; Loebstein et al., 2001). In addition, warfarin has
a narrow therapeutic window (Palareti et al., 1996), and variation in clinical response to this drug is consistently one of the leading causes of hospitalization for adverse drug events such as bleeding (Budnitz et al., 2011; Pirmohamed et al., 2004).
1.5.1 Clinical use of warfarin
Warfarin is one of the most widely prescribed oral anticoagulants worldwide (Kirley et al., 2012). It is indicated for the prophylaxis and treatment of thromboembolic complications associated with atrial fibrillation (AF), venous thrombosis, pulmonary embolism (PE), myocardial infarction (MI), and cardiac valve replacement. Table 1.1 outlines the common indications for warfarin therapy.
Over 25 million warfarin prescription have been made in the United States with world’s total prescriptions reaching 0.5-1.5% of the population (Johnson et al., 2011). However, because of the large difference in the dose requirements, the anticoagulation effect must be monitored regularly. Anticoagulation status is measured as the International Normalized Ratio (INR), which is a measure of the prothrombin time (PT) consisting of vitamin
K-dependent coagulation factors II, VII and X (van den Besselaar et al., 2004). INR is calculated by the following formula: INR = (patient’s PT/mean normal PT)ISI, where mean normal PT is the geometric mean of the PTs of the healthy
adult population and ISI is the International Sensitivity Index of the thromboplastin used at the local laboratory to perform the PT measurement. A normal individual usually has an INR of 1. Warfarin is normally dosed to achieve an INR between 2.0 to 3.0 for most indications, except for patients with mechanical prosthetic heart valves and with systemic recurrent emboli (Table 1.1) (Hirsh et al., 1998; Kearon et al., 2012; Keeling et al., 2011). When a patient is started on warfarin, INR monitoring should be performed daily until the INR is within the therapeutic range for at least 2 consecutive days.
The safety and efficacy of warfarin therapy are dependent on maintaining the INR within the target range for the indication. Sub- and supra-therapeutic INR (INR<1.5 and INR>4.0, respectively) have been associated with an increased risk of thromboembolic and bleeding events, respectively (Johnson and Cavallari, 2013; Johnson et al., 2011). Vitamin K, an antagonist of warfarin, is generally used to reverse the effect of warfarin in the event of high INR or bleeding.
Table 1.1. Recommended INR therapeutic range for anticoagulant therapy*.
Indication INR
Treatment of venous thrombosis 2.0-3.0
Treatment of pulmonary embolism 2.0-3.0
Prophylaxis of venous thrombosis (high-risk surgery) 2.0-3.0
Prevention of systemic embolism 2.0-3.0
Tissue heart valves 2.0-3.0
AMI (to prevent systemic embolism)# 2.0-3.0
Valvular heart disease 2.0-3.0
Atrial fibrillation 2.0-3.0
Bileaflet mechanical valve in aortic position 2.0-3.0
Bioprosthetic valve in mitral position 2.0-3.0
Mechanical prosthetic valves (high risk) 2.5-3.5
Systemic recurrent emboli 2.5-3.5
*Recommended by the American College of Chest Physician (Ansell et al., 2008; Kearon et al., 2012).
#If anticoagulant therapy is elected to prevent recurrent myocardial infarction, an INR
of 2.5-3.5 is recommended, consistent with recommendations of the Food and Drug Administration (FDA).
AMI, acute myocardial infarction; INR, international normalized ratio. Adapted from Hirsh et al., 1998.
Therapy with warfarin is usually started empirically on a fixed dose between 5 mg and 10 mg for the first 1 or 2 days for most individuals, with subsequent dosing based on the INR response. Older patients and those with liver disease, poor nutritional status, or heart failure may require lower initiation dosages (Kearon et al., 2012). The iterative process to define the appropriate dose can take weeks to months, and during this period patients are at increased risk of over- or under-anticoagulation (Budnitz et al., 2011; Pirmohamed, 2006; Pirmohamed et al., 2004).
Numerous factors are known to affect warfarin dose requirement in individuals (see below). Therefore, strategies to individualise warfarin therapy and reduce ADRs have been sought.
1.5.2 Pharmacokinetics of warfarin
Warfarin consists of a racemic mixture of two active optical isomers, the R- and S-enantiomers, in approximately equal proportions. Their pharmacokinetic and pharmacodynamic properties differ considerably, and they are cleared by different pathways. The S-warfarin accounts for 60-70% of the overall anticoagulant activity and is estimated to be 3 to 5 times more potent than the R-enantiomer (Breckenridge et al., 1974; O’Reilly, 1974).
Warfarin is highly water soluble, is rapidly absorbed from the gastrointestinal tract, and has high bioavailability (Breckenridge, 1978; O’Reilly, 1976). Warfarin can be detected in the plasma one hour after oral administration and the peak concentration occurs in two to eight hours after oral administration (Breckenridge, 1978; Kelly and O’Malley, 1979). Racemic warfarin has a half-life of 36-42 h (R-warfarin, 45 h; S-warfarin, 29 h) and the duration of the effect lasts up to five days (O’Reilly, 1987). After oral administration, 97-98% of racemic warfarin is bound to albumin, with 1% of free drug being pharmacologically active (Otagiri et al., 1987; Wilting et al., 1980).
Warfarin is metabolized in the liver and kidneys. Inactive metabolites are secreted in urine and stool. The human cytochrome P-450 (CYP) family plays a key role in warfarin metabolism, catalysing its hydroxylation at different
sites, and producing a series of mono-hydroxylated metabolites, through regio- and stereo-selective reactions (Brian et al., 1990; Hermans and Thijssen, 1989; Kaminsky et al., 1984, 1993; Nelson et al., 1996; Wang et al., 1983). R-warfarin is metabolised by CYP1A2, CYP2C19 and CYP3A4 to 6-, 7-, and 8-hydroxywarfarin that are excreted in the urine (Brian et al., 1990; Hermans and Thijssen, 1989; Kaminsky et al., 1984, 1993; Rettie et al., 1992; Wang et al., 1983; Zhang et al., 1995). S-warfarin is metabolized almost exclusively by CYP2C9 to 7-hydroxywarfarin and to a much lesser extent, 6-hydroxywarfarin (Kaminsky et al., 1984; Rettie et al., 1992; Wang et al., 1983). S-warfarin has about a 3-fold greater systemic clearance than R-warfarin (Breckenridge et al., 1974; O’Reilly, 1974; Wittkowsky, 2003).
1.5.3 Pharmacodynamics of warfarin
The procoagulant factors II, VII, IX, X, and anticoagulant proteins C, S and Z are vitamin K-dependant proteins which require γ-carboxylation of their glutamic acid residues to become fully functional (Ansell et al., 2004; Friedman et al., 1977; Malhotra et al., 1985; Stafford, 2005). The conversion of glutamic acid (Glu) residues on the N-terminal region of vitamin K-dependent proteins to γ-carboxyglutamic acid (Gla) residues induces a calcium-dependent conformational change in coagulation proteins which promotes their binding to cofactors on phospholipid surfaces (Borowski et al., 1986; Nelsestuen, 1976; Prendergast and Mann, 1977).
Carboxylation is catalysed by the vitamin K-dependent γ-carboxylation system, a multicomponent system of proteins that is embedded in the
membrane of the endoplasmic reticulum. It consists of the vitamin K-dependent γ-glutamyl carboxylase (GGCX), which requires the reduced hydroquinone form of vitamin K1 (vitamin K1H2) as a cofactor, and the
warfarin-sensitive enzyme vitamin K1 2,3-epoxide reductase (VKOR), which produces
the cofactor. During the reaction, in the presence of molecular oxygen and carbon dioxide, the vitamin K1H2 is oxidized to vitamin K1 2,3-epoxide, which
is recycled to vitamin K by VKOR (Berkner, 2005; Wallin and Hutson, 2004). The vitamin K cycle is shown in Figure 1.4.
Warfarin exerts its anticoagulant effect by inhibiting VKOR, therefore interfering with the cyclic inter-conversion of vitamin K1 and its 2,3-epoxide
(Figure 1.3) (Choonara et al., 1988; Fasco et al., 1982; Nelsestuen et al., 1974; Stafford, 2005; Stenflo et al., 1974; Trivedi et al., 1988; Whitlon et al., 1978). This process leads to the depletion of vitamin K1H2 and limits the
γ-carboxylation of the vitamin K-dependent coagulant proteins (Wallin and Hutson, 2004). The reduction in the number of Gla residues from the normal 10–13 to less than 6 results in >95% decrease in coagulant activity (Malhotra, 1989, 1990; Malhotra et al., 1985).
When the liver concentration of vitamin K1 is elevated, vitamin K1 can
be reduced to vitamin K1H2 by an alternative enzyme, flavoprotein
DT-diaphorase, which is a nicotinamide adenine dinucleotide phosphate (NAD(P)H) dehydrogenase (Hochstein, 1983; Wallin and Martin, 1987). Warfarin does not inhibit DT-diaphorase (Wallin and Martin, 1987). Therefore, warfarin intoxication can be counteracted by administering high doses of vitamin K1 which drives cofactor vitamin K1H2 production for GGCX, restoring
Figure 1.4. Pharmacology of warfarin. Warfarin is administered as a racemic admixture of R- and S-enantiomers. The more potent S-enantiomer is metabolised principally by cytochrome P450 (CYP) 2C9. The pharmacological effect of warfarin is mediated by the inhibition of vitamin K epoxide reductase complex 1 (VKORC1). This results in decreased concentrations of activated clotting factors (II, VII, IX and X) producing therapeutic anticoagulation. GGCX, γ-glutamyl-carboxylase; CO2, carbon
1.6 Clinical and environmental factors affecting warfarin
response
Clinical and environmental factors such as age, race, weight, height, medications, diet, illness, smoking and adherence all influence warfarin dosing.
Dose requirements decrease with age, owing to reduced clearance and/or increased responsiveness, by ~8-10% per decade of life (Gage et al., 2004; Gurwitz et al., 1992; Loebstein et al., 2001; Sconce et al., 2005). Mean warfarin daily dose requirements fell by 0.5 to 0.7 mg per decade between the ages of 20 to 90 years (Caldwell et al., 2007; Gage et al., 2004; Herman et al., 2006; Klein et al., 2009; Sconce et al., 2005; Wu et al., 2008).
Owing to differences in the prevalence of both known and unknown genetic variants, warfarin dose requirements vary by race. As compared with Caucasians, African-Americans require higher doses on average (Gage et al., 2004), whereas Asians require lower doses on average (Dang et al., 2005; Voora et al., 2005). However, analyses adjusting for known genetic factors, particularly VKORC1 genotype, have found that race is only a small contributor or is not a contributor to dose requirements (Gage et al., 2008; Klein et al., 2009).
Numerous concomitant medications can affect warfarin dose requirements, including amiodarone, antibiotics, salicylates, acetaminophen, thyroxine, inducers of cytochrome P450 (e.g. carbamazepine), HMG-CoA reductase inhibitors (e.g. simvastatin), and some herbal medicines (e.g. St John’s Wort and ginkgo) (D’Andrea et al., 2008; Gage et al., 2004; Moore et
al., 2000; Perini et al., 2008; Sanoski and Bauman, 2002; Wang et al., 2001).
Table 1.2 lists some food and drugs that interact with warfarin.
Dietary factors such as alcohol consumption or vitamin K intake might influence warfarin dose requirements. Warfarin acts by inhibiting the recycling of vitamin K, and thus high intake of fat-soluble vitamin K (found in green vegetables) can theoretically diminish the action of warfarin. In addition, low or inconsistent vitamin K intake might contribute to variation in anticoagulation control (Loebstein et al., 2001; Sconce et al., 2005). Daily vitamin K supplementation for patients with previously unstable control was found to improve anticoagulation control (Sconce et al., 2007). However, there is conflicting evidence on the association between warfarin maintenance doses and vitamin K intake, where some studies did not find any association (Absher
et al., 2002; Gage et al., 2004).
Various illnesses can affect warfarin dose requirements. Patients with liver disease, malnutrition, decompensated heart failure, hypermetabolic states (e.g. febrile illnesses, hyperthyroidism) and different therapeutic indications for warfarin (e.g. prosthetic heart valve, current venous thromboembolism) may lead to altered dose requirements (D’Andrea et al., 2008; Ansell et al., 2001; Gage and Eby, 2003; Gage et al., 2008).
Cigarette smoking has been demonstrated to induce CYP1A2, responsible for R-warfarin metabolism (Faber and Fuhr, 2004). With increased smoking, the activity of CYP1A2 increases, leading to increased metabolism of R-warfarin and a consequent need for higher warfarin dose requirement. Conversely, smoking cessation can cause an increase in warfarin activity. Therefore, changes in smoking behaviour could affect dose requirement.
Indeed careful monitoring of the INR in these patients is needed (Bourgeois et
al., 2016; Bryk et al., 2015; Faber and Fuhr, 2004).
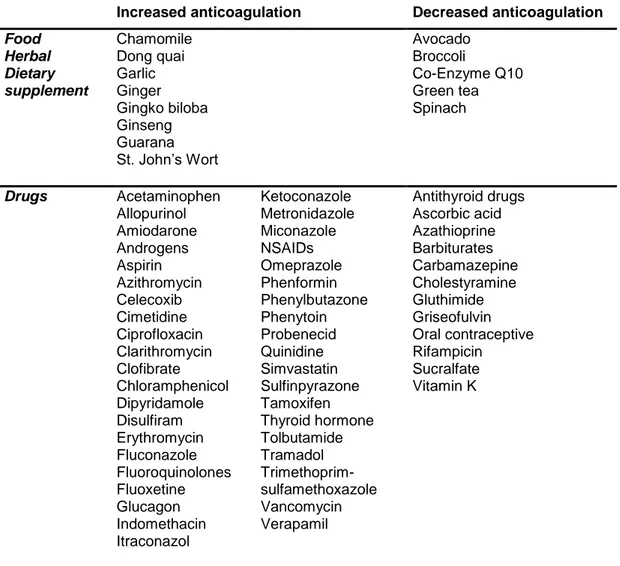
Table 1.2. Some of major food and drug interactions with warfarin.
Increased anticoagulation Decreased anticoagulation
Food Herbal Dietary supplement Chamomile Dong quai Garlic Ginger Gingko biloba Ginseng Guarana St. John’s Wort Avocado Broccoli Co-Enzyme Q10 Green tea Spinach Drugs Acetaminophen Allopurinol Amiodarone Androgens Aspirin Azithromycin Celecoxib Cimetidine Ciprofloxacin Clarithromycin Clofibrate Chloramphenicol Dipyridamole Disulfiram Erythromycin Fluconazole Fluoroquinolones Fluoxetine Glucagon Indomethacin Itraconazol Ketoconazole Metronidazole Miconazole NSAIDs Omeprazole Phenformin Phenylbutazone Phenytoin Probenecid Quinidine Simvastatin Sulfinpyrazone Tamoxifen Thyroid hormone Tolbutamide Tramadol Trimethoprim-sulfamethoxazole Vancomycin Verapamil Antithyroid drugs Ascorbic acid Azathioprine Barbiturates Carbamazepine Cholestyramine Gluthimide Griseofulvin Oral contraceptive Rifampicin Sucralfate Vitamin K
1.7 Genetic contributions to warfarin response
Both candidate gene and GWAS data over the past decade have clearly shown that genetic polymorphisms contribute to the inter-patient variability in warfarin dose requirement (Aithal et al., 1999; Aquilante et al., 2006; Cha et al., 2010; Cooper et al., 2008; Rieder et al., 2005; Scordo et al., 2002; Takeuchi et al., 2009). More than 30 genes with a putative impact on warfarin anticoagulation have been identified (Jonas and McLeod, 2009). These genes have generally been found to have minimal impact on warfarin dose requirements. However, the variants of two genes, CYP2C9, which encodes the main warfarin metabolizing enzyme cytochrome P450 2C9, and
VKORC1, which encodes for vitamin K epoxide reductase complex 1, have
been shown to be the major genetic determinants influencing warfarin dose requirements.
The CYP4F2 gene, which encodes a vitamin K oxidase, has also been shown to influence warfarin pharmacodynamics and dose requirements, but to a lesser extent.
1.7.1 CYP2C9
The cytochrome P450 superfamily are the major enzymes involved in drug metabolism, accounting for approximately 75% of the total metabolism (Ingelman-Sundberg, 2004). The CYP2C9 gene is located on chromosome 10q24.2, spans approximatively 55 kb, contains 9 exons, and encodes a 60 kDa microsomal protein (Goldstein and de Morais, 1994).
CYP2C9 was the first gene documented to affect warfarin dose
requirement (Furuya et al., 1995). Most of the variants in the CYP2C9 gene lead to reduced activity of the liver enzyme, resulting in increased sensitivity to warfarin (Niinuma et al., 2014). There are over 35 genetic variants in the
CYP2C9 gene, of which the CYP2C9*2 (rs1799853) and *3 (rs1057910) are
the most extensively studied (Table 1.3) (Crespi and Miller, 1997; Ieiri et al., 2000). CYP2C9*2 induces an Arg144Cys amino acid substitution in exon 3, whereas CYP2C9*3 encodes for Ile359Leu amino acid change in exon 7. S-warfarin clearance is reduced by approximately 40% with CYPC9*2 and 75% with CYP2C9*3 (Scordo et al., 2002; Takahashi et al., 1998). Accordingly, warfarin dose requirements are approximately 20% lower with the
CYP2C9*1/*2 genotype and 35% lower with the CYP2C9*1/*3 genotype
compared with the CYP2C9*1/*1 genotype (Lindh et al., 2009). Doses of 1 mg/day or lower may be necessary in patients with the CYP2C9*3/*3 genotype to prevent over-anticoagulation and bleeding.
CYP2C9 allele frequencies differ by ancestry, with the CYP2C9*2 and *3 alleles occurring much more commonly among those of European ancestry
versus Asian or African-American descents (Table 1.3) (Lam and Cheung, 2012; Perera et al., 2011). The CYP2C9*5 (rs28371686), *6 (rs9332131), *8 (rs7900194), and *11 (rs28371685) alleles predominate among those of African-American ancestry, with the *8 allele being the most common (Perera
et al., 2011; Scott et al., 2009). Decreased S-warfarin clearance and lower
warfarin dose requirements have been reported in patients bearing these alleles (Dickmann et al., 2001; Limdi et al., 2008a; Liu et al., 2011b; Perera et
Overall, CYP2C9 genotype explains approximately 10 to 15% of the interpatient variability in warfarin dose requirements (Anderson et al., 2007; Aquilante et al., 2006; Carlquist et al., 2006; Cavallari et al., 2010; Klein et al., 2009; Sconce et al., 2005; Wadelius et al., 2007; Wu et al., 2008). CYP2C9 variant alleles are also associated with an increased risk for over-anticoagulation and bleeding during warfarin therapy (Aithal et al., 1999; Limdi
et al., 2008b). The risk of bleeding attributable to CYP2C9 polymorphisms is
highest during the initial months of warfarin therapy. However, there is evidence that this persists during chronic therapy, suggesting a need for close monitoring for signs and symptoms of bleeding throughout warfarin therapy for carriers of the CYP2C9 variant alleles (Limdi et al., 2008b).
1.7.2 VKORC1
SNPs in the VKORC1 gene have been linked to reduced efficacy in vitamin K recycling as a result of lower VKOR activity (Rost et al., 2004a). The
VKORC1 gene, approximately 4 kb long, is located on chromosome 16p11.2
(Li et al., 2004; Rost et al., 2004a).
Genetic variants in the VKORC1 coding region have been shown to be associated with warfarin resistance, where very high doses (>20 mg/day) were required to obtain therapeutic anticoagulation (Rost et al., 2004a).
VKORC1 variants associated with warfarin resistance are rare in most
populations, with the exception of the Ashkenazi Jewish population, in whom the p.Asp36Try variant occurs at a prevalence of approximately 8% (Scott et
In the general population, SNPs in the VKORC1 promoter (-1639G>A, rs9923231) and intron 1 (1173C>T, rs9934438) have been associated with warfarin sensitivity, and they are responsible for approximately 25% of the warfarin dose variability (Rieder et al., 2005; Wang et al., 2008). However, -1639G>A and 1173C>T occur in near complete linkage disequilibrium across populations, and thus, either may be considered for warfarin dose prediction (Limdi et al., 2010). The -1639AA, AG, and GG genotypes (or 1173TT, CT, and CC genotypes) are associated with high, intermediate, and low sensitivity to warfarin, respectively. Thus, when compared with the -1639AG genotype, higher warfarin doses are needed for carriers of the GG genotype to effectively inhibit vitamin K reduction and subsequent clotting factor activation, whereas carriers of the AA genotype require lower doses.
Another common VKORC1 SNP, the 3730G>A (rs7294), located in the 3’ untranslated region of the gene, has been associated with increased warfarin dose requirements (Geisen et al., 2005; Rieder et al., 2007). Using linear regression models, this polymorphism has been shown to account for about 10% of warfarin dose requirements in the Italian population (Borgiani et
al., 2009; Cini et al., 2012).
As shown in Table 1.3, the -1639A allele frequency varies by ancestry, and largely explains the differences in warfarin dose requirements between Caucasian, African-American, and Asian populations. Specifically, the African populations have a higher frequency of the GG genotype and generally require higher warfarin doses than those of European descent. Asians have a high frequency of the AA genotype and usually require very low doses of warfarin. The VKORC1 -1639G>A variant explains approximately 20 to 35% of warfarin
dose variability in Caucasians and Asians, but only 5 to 7% in African-Americans (Aquilante et al., 2006; Cavallari et al., 2010; Limdi et al., 2010). The lesser variability explained in African-Americans is primarily attributable to the lower -1639A allele frequency in this group (Limdi et al., 2010). Nonetheless, persons of African descent derive a similar benefit from genotype-guided warfarin dosing as others.
1.7.3 CYP4F2
CYP4F2 metabolizes vitamin K to hydroxyl-vitamin K, resulting in less vitamin K available for clotting factor activation. The CYP4F2 gene is located on chromosome 19p13.12. The activity of CYP4F2 is reduced in individuals with the CYP4F2 p.Val433Met SNP (rs2108622, c.1297G>A), resulting in reduced vitamin K metabolism and greater vitamin K availability (McDonald et
al., 2009). Studies in both Caucasians and Asians have shown higher warfarin
dose requirements with the CYP4F2 AA genotype (Caldwell et al., 2008; Cha
et al., 2010; Gong et al., 2011a; Sagrieya et al., 2010; Wei et al., 2012). Due
to the lower allele frequency in African-Americans, the association of warfarin dose with the polymorphism is not observed in this population (Bress et al., 2012; Cha et al., 2010). In GWAS conducted in European and Asian populations, CYP4F2 emerges as a predictor for warfarin dose requirements after controlling for CYP2C9 and VKORC1, explaining an additional 1 to 3% of the overall variability (Cha et al., 2010; Takeuchi et al., 2009). Although this SNP has been demonstrated to be significantly associated with warfarin dose
requirements, the effect size is very small and its clinical use remains to be further studied.
1.7.4 Other genetic factors
In addition to CYP2C9, VKORC1 and CYP4F2, more than 30 genes in the warfarin interactive pathways have been studied as potential contributors to the variation of warfarin doses (see Table 1.4) (Cavallari et al., 2010; Cha et al., 2007; Chen et al., 2005; Kimura et al., 2007; Lal et al., 2008; Lee et al., 2009; Loebstein et al., 2005; Otagiri et al., 1987; Rieder et al., 2007; Shikata et al., 2004; Wadelius and Pirmohamed, 2007; Wadelius et al., 2004, 2005, 2007; Wajih et al., 2004). Figure 1.5 illustrates an overview of warfarin interactive pathways whereas Table 1.4 details protein functions.
SNPs in the gene encoding γ-glutamyl carboxylase (GGCX) have been reported to have an influence (albeit minimal) on dose requirements in some studies (Chen et al., 2005; Crawford et al., 2007; Kimura et al., 2007; Shikata et al., 2004; Wadelius et al., 2005). Cavallari et al. (2012) reported an association of the GGCX SNP rs10654848 with higher warfarin dose requirements in African-Americans. The GGCX SNP explained 2% of warfarin dose variability and occurs 10 times more frequently in African-Americans than in Caucasians (MAF 2.6% versus 0.27%) (Cavallari et al., 2012).
The SNP rs339097 in calumenin (a chaperon protein capable of inhibiting GGCX) has been demonstrated to confer 11-15% higher warfarin dose requirements in African-Americans (Voora et al., 2010). The minor allele
frequency of rs339097 is approximately 1% in Europeans as opposed to 25% in African-Americans (Cavallari et al., 2011).
The apolipoprotein E (APOE) gene has been evaluated in Caucasians, Africans and Asians (Kimmel et al., 2008; Kohnke et al., 2005; Lal et al., 2008). Plasma vitamin K levels vary by APOE genotype (Saupe et
al., 1993). There are three common variants of the APOE gene (designated ε2, ε3 and ε4) and their prevalence varies by ethnicity. The ε4 variant is more
common in African-Americans (21%) (Kimmel et al., 2008) than in Caucasians (13%) (Kohnke et al., 2005) and Asians (11%) (Lal et al., 2008). APOE genotypes were found to affect warfarin dose requirements in some studies, but not in others, suggesting that the possible effect of APOE may be population specific (Caldwell et al., 2007; Huang et al., 2011; Kimmel et al., 2008; Kohnke et al., 2005; Lal et al., 2008; de Oliveira Almeida et al., 2014).
A SNP in the CYP2C18 gene (rs12777823), was also shown to affect warfarin dose requirements in a population of African-American ancestry (Perera et al., 2013). Carriers of the minor A allele had required lower warfarin doses, suggesting reduced clearance of S-warfarin.
CHAPTER 1
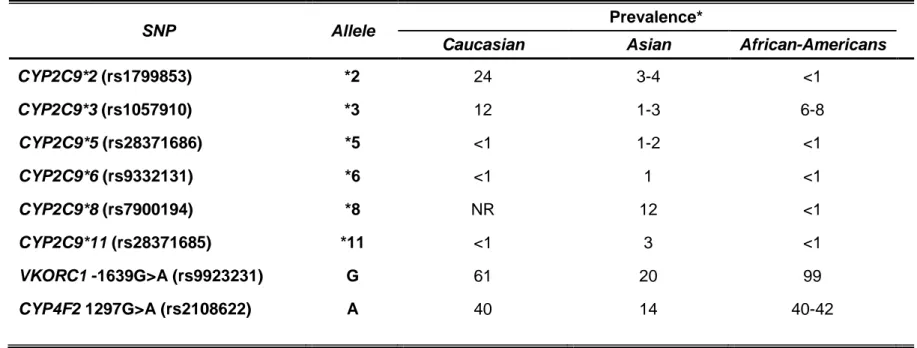
Table 1.3. Reported prevalence of CYP2C9, VKORC1, and CYP4F2 gene polymorphisms by ancestry (Bress et al., 2012;
Cavallari et al., 2010; Cha et al., 2010; Chan et al., 2012; Gage et al., 2008; Limdi et al., 2008a, 2008b, 2010; Perera et al., 2013).
SNP Allele Prevalence*
Caucasian Asian African-Americans
CYP2C9*2 (rs1799853) *2 24 3-4 <1 CYP2C9*3 (rs1057910) *3 12 1-3 6-8 CYP2C9*5 (rs28371686) *5 <1 1-2 <1 CYP2C9*6 (rs9332131) *6 <1 1 <1 CYP2C9*8 (rs7900194) *8 NR 12 <1 CYP2C9*11 (rs28371685) *11 <1 3 <1 VKORC1 -1639G>A (rs9923231) G 61 20 99 CYP4F2 1297G>A (rs2108622) A 40 14 40-42
Figure 1.5. An overview of warfarin interactive pathways. The figure illustrates genes thought to be involved in the action and biotransformation of warfarin and vitamin K. Adapted from Wadelius et al., 2007.
Table 1.4. Other genes involved in warfarin mechanism of action. Protein name Gene Function of protein
Biotransformation of warfarin
Transport
Alpha-1-acid glycoprotein 1, Orosomucoid 1
ORM1 A plasma glycoprotein that functions as a carrier of warfarin in the blood (Nakagawa et al., 2003; Otagiri et al., 1987)
Alpha-1-acid glycoprotein 2, Orosomucoid 2
ORM2 A plasma glycoprotein that functions as a carrier of warfarin in the blood (Nakagawa et al., 2003; Otagiri et al., 1987)
P-glycoprotein, Multidrug resistance protein 1
ABCB1 (MDR1)
A cellular efflux pump for xenobiotics (Kroetz et al., 2003). Warfarin is a weak inhibitor and maybe a substrate.
Metabolism
Cytocrome P450 1A1 CYP1A1 Metabolism of R-warfarin (Grossman et al., 1993;
Kaminsky and Zhang, 1997; Zhang et al., 1995)
Cytocrome P450 1A2 CYP1A2 Metabolism of R-warfarin (Kaminsky and Zhang,
1997; Zhang et al., 1995)
Cytocrome P450 1A6 CYP1A6 Metabolism of S-warfarin? (Freeman et al., 2000)
Cytocrome P450 2C8 CYP2C8 Minor pathway for R- and S-warfarin (Kaminsky
and Zhang, 1997; Rettie et al., 1992)
Cytocrome P450 2C18 CYP2C18 Minor pathway for R- and S-warfarin (Kaminsky
and Zhang, 1997; Kaminsky et al., 1993)
Cytocrome P450 2C19 CYP2C19 Minor pathway for R- and S-warfarin (Kaminsky
and Zhang, 1997; Kaminsky et al., 1993)
Cytocrome P450 3A4 CYP3A4 Metabolism of R-warfarin (Kaminsky and Zhang,
1997)
Cytocrome P450 3A5 CYP3A5 Metabolism of R-warfarin? (Huang et al., 2004)
Cytochrome P450 inducibility
Pregnane X receptor (PXP) NR1I2 Mediates induction of CYP2C9, CYP3A4, other
CYP enzymes and ABCB1 (Chen et al., 2004; Geick et al., 2001; Lehmann et al., 1998) Constitutive androstane
receptor (CAR)
NR1I3 Transcriptional regulation of genes including
CYP2C9 and CYP3A4 (Assenat et al., 2004)
Biotransformation of vitamin K
Transport
Apolipoprotein E APOE Apolipoprotein E serves as a ligand for receptors
that mediate the uptake of vitamin K (Berkner and Runge, 2004; Kohlmeier et al., 1996; Lamon-Fava
et al., 1998; Saupe et al., 1993) Vitamin K cycle
Epoxide hydrolase 1, microsomal
EPHX1 A hepatic epoxide hydrolase in the endoplasmic reticulum that may be complexed with VKOR (Cain
et al., 1997; Loebstein et al., 2005; Morisseau and
Hammock, 2005) NAD(P)H dehydrogenase,
quinone 1
NQO1 A detoxifying enzyme that has the potential to reduce the quinine form of vitamin K (Berkner and Runge, 2004; Ross and Siegel, 2004; Wallin and Hutson, 1982)
Calumenin CALU Binds to the vitamin K epoxide reductase complex
and inhibits the effect of warfarin (Wajih et al., 2004; Wallin et al., 2001)
γ-glutamyl carboxylase GGCX Carboxylates vitamin-K-dependent coagulation
factors and proteins in the vitamin K cycle
Table 1.4. Continued
Protein name Gene Function of protein Vitamin K-dependent proteins
Coagulation factor II, prothrombin
F2 Converts fibrinogen to fibrin, activates F5, FVIII,
FXI, FXIII, protein C (Berkner, 2000; Dahlbäck, 2005)
Coagulation factor VII F7 Is converted to FVIIa and then converts FIX to
FIXa and FX to FXa (Berkner, 2000; Dahlbäck, 2005)
Coagulation factor IX F9 Makes a complex with FVIIIa and then converts FX
to FXa (Berkner, 2000; Dahlbäck, 2005)
Coagulation factor X F10 Converts FII to FIIa in the presence of FVa
(Berkner, 2000; Dahlbäck, 2005)
Protein C PROC Activated protein C counteracts coagulation
together with protein S by inactivating FVa and FVIIIa (Berkner, 2000; Dahlbäck, 2005)
Protein S PROS1 Cofactor to protein C that degrades FVa and FVIIIa
(Berkner, 2000; Dahlbäck, 2005)
Protein Z PROZ Is together with protein Z-dependend protease
inhibitor, a cofactor for the inactivation of FXa (Berkner, 2000; Broze, 2001)
Growth-arrest-specific protein 6 GAS6 Participates in many processes, i.e. potentiation of
agonist-induced platelet aggregation (Berkner and Runge, 2004)
Other coagulation proteins
Anti-thrombin III SERPINC1 Inhibits FIIa, FIXa, FXa, FXia and FXIIa.
Anti-thrombin deficiency increases risk of thrombosis (Dahlbäck, 2005)
Coagulation factor V F5 A cofactor that activates FII together with FXa. An
F5 mutation leads to risk of thrombosis (Dahlbäck, 2005)