IMPACT OF AIR OXYGEN PRESENCE
ON THE STABILITY OF THE V
3+IONS
IN THE VANADIUM REDOX
FLOW BATTERIES
ALFONSO POZIO, PIER PAOLO PROSINI
Dipartimento Tecnologie Energetiche Divisione Produzione,Conversione e Uso Efficientidell’Energia Laboratorio Sviluppo ProcessiChimicie Termofluidodinamiciper l’Energia Centro Ricerche Casaccia,Roma
RT/2016/7/ENEA
ITALIAN NATIONAL AGENCY FOR NEW TECHNOLOGIES, ENERGY AND SUSTAINABLE ECONOMIC DEVELOPMENT
ALFONSO POZIO, PIER PAOLO PROSINI Dipartimento Tecnologie Energetiche Divisione Produzione, Conversione e Uso Efficienti dell’Energia Laboratorio Sviluppo Processi Chimici e Termofluidodinamici per l’Energia Centro Ricerche Casaccia, Roma
IMPACT OF AIR OXYGEN PRESENCE
ON THE STABILITY OF THE V
3+IONS
IN THE VANADIUM REDOX
FLOW BATTERIES
RT/2016/7/ENEA
ITALIAN NATIONAL AGENCY FOR NEW TECHNOLOGIES, ENERGY AND SUSTAINABLE ECONOMIC DEVELOPMENT
I rapporti tecnici sono scaricabili in formato pdf dal sito web ENEA alla pagina http://www.enea.it/it/produzione-scientifica/rapporti-tecnici
I contenuti tecnico-scientifici dei rapporti tecnici dell’ENEA rispecchiano l’opinione degli autori e non necessariamente quella dell’Agenzia
The technical and scientific contents of these reports express the opinion of the authors but not necessarily the opinion of ENEA.
IMPACT OF AIR OXYGEN PRESENCE ON THE STABILITY OF THE V3+IONS IN THE VANADIUM
REDOX FLOW BATTERIES Alfonso Pozio, Pier Paolo Prosini
Riassunto
Questo lavoro intende definire il ruolo dell'ossigeno sulla stabilità dello ione vanadio V(III) nelle bat-terie di flusso redox vanadio. La spettrofotometria UV-visibile ha evidenziato che, non solo la pre-senza di ossigeno nella soluzione anodica limita fortemente la riduzione da V(IV) a V(II) a causa della rapida ossidazione del V(II) da parte dell’ossigeno disciolto. Più importante, la presenza di ossigeno nella stessa soluzione rende anche gli ioni V(III) molto instabili e soggetti ad ossidazione in tempi brevi. Questo effetto, mai precedentemente ben quantificato, mostra che la presenza di O2 deve essere assolutamente esclusa nel serbatoio di accumulo per mantenere stabile la concentrazione di V(III).
Parole chiave: batterie a flusso, VFRBs, vanadio
Abstract
This work is intended to define the role of oxygen on the stability of vanadium ions V(III) in the vana-dium redox flow batteries. The UV-visible spectrophotometry revealed that, not only the oxygen presence in the anolyte solution strongly limits the V(IV) to V(II) reduction in the negative half-cell electrolyte, due to the rapid oxidation of the V(II) by dissolved oxygen. Most important, the oxygen presence in the same solution also makes very unstable the V(III) ions that tend to be oxidized in short time. This effect, never previously well quantified, shows that the presence of O2 must be ab-solutely excluded in the storage reservoir in order to keep stable the concentration of V(III).
1. Introduction 2. Experimental
2.1 Materials and photo-electrode preparation 3. Results and discussion
4. Conclusion References 7 8 8 10 14 16 INDEX
7
1. Introduction
The redox flow batteries (RFBs) appear for a promising large scale storage technology [1-3]. The main advantages of this technology are: good discharge capacity, long cycle life, high efficiency and flexible design [4]. Amongst all RFBs, the vanadium redox flow batteries have the benefit to exist in solution in different oxidation states (four), reducing the cross-contamination of the half-cell electrolytes thus increasing the lifetime of the cell [5]. The feature of VRFB mainly includes two external electrolyte reservoirs, containing the electrolyte solutions, VO2+/VO2+ and V3+/V2+, into the
cathode and anode compartment respectively, two pumps for the flow rate management and the battery, consisting in a single cell or a stack in which each single cell is connected in series.
Usually, in most of the articles [1,6-8], the starting solution in both reservoirs is constituted by VO2+/ H2SO4 mixture with the vanadium present in the V(IV) oxidation state. This solution can be
easily prepared starting from VOSO4×H2O salt. In the first charging step the V(IV) is oxidized at
V(V) to the anode and reduced at V(II) to the cathode. The electrochemical reaction are the following:
VO2+(IV) + H2O = VO2+(V) + 2H+ +e- E°= 0.911 V vs. NHE (1)
VO2+(IV) + 2H+ +2e- = V2+(II) +H2O E°= 0.082 V vs. NHE (2)
The numbers of electrons for the reduction reaction (2) are twice those for the oxidation (1) so that the volume of V(IV) at the catode side must be double that at the anode. Afterward, half of the positive electrolyte solution V(V) is removed from the tank. In this condition, the subsequent discharging-charging cycle are:
8
V2+(II) ↔ V3+(III) + e- E°= -0.255 V vs. NHE (4)
The testing procedures claim generically that the V2+/V3+ tank must be continuously purged by nitrogen to minimize V2+ oxidation [1,6,8]. Flox et al. [7] only have used a continuously purging by nitrogen of both reservoirs to minimize oxidation of the active species. The purging action seem to play an important role in order to obtain a good efficiency. Surprisingly very few works were devoted to analyze this aspect and the repercussions on the system complexity. In the past Sum et al [9,10] have studied both V(II)/V(III) and V(V)/V(IV) redox couples, working with solutions purged with nitrogen both before and during use. Recently, Choi et al. [11] have studied in detail, the oxidation of the V(II) by dissolved oxygen, revealing that the concentration of V(II) in the negative half-cell electrolyte decreases continuously with cycling, due to the rapid oxidation of the V(II) by dissolved oxygen. This work has clearly emphasized that there is a significant capacity loss when the electrolyte is exposed to air. Such decrease gives rise to an imbalance between the positive and negative half-cell electrolytes, which results in a significant capacity loss [11,12].
In this short communication, we analyzed the effect of the air oxidation for vanadium species in different oxidation state. We showed that not only the oxygen presence stops completely the V(IV) to V(II) (eq. 2) reduction in the first charging step, but also it makes strongly unstable the V(III) that it tends to be oxidised during the time.
2. Experimental
2.1. Materials and photo-electrode preparation
In a first experiment, a serpentine single cell comprised of a membrane, electrodes, electrolyte distributors, and current collectors was used. The electrodes used both at anode and cathode were carbon paper (240 μm uncompressed thickness TGP-H090, Toray) with a geometric surface area of
9
5 cm2. The other cell materials were POCO graphite plates 76 × 76 × 13 mm (Scribner Associates) engraved with serpentine flow fields over a 5 cm2 active area as electrolyte distributor, as well as a Nafion proton exchange membrane (Nafion 115, Ion-Power, Inc.). The graphite plates were mounted by sandwiching between current collectors. The membrane was pretreated in distilled water at 80°C and a 1 mol l−1 H2SO4 solution at 80°C for 30 minutes.
Electrolytes were prepared by dissolving 1.07 M V(IV) from VOSO4 in 1 M H2SO4 solution. The
initial electrolyte for charging used at both sides was 10 mL of the same aqueous solution. A constant current method with the current density of 50 mA cm−2 was used to charge the cell to a theoretical state of charge (SoC) of 100%, viz. the VO2+ ions were fully converted to V3+ ion and (VO2)+ ion in the anolyte and catholyte, respectively. The cutoff voltage for the constant current
charging is 1.8 V. Galvanostatic discharge was applied at the same constant current density up to reach a cut-off voltage value of 1.0 V. Three consecutive charge–discharge cycles were applied using a Solartron 1287. Two peristaltic pumps (KMS) were used to circulate the electrolytes with the flow rate of 40 mL min−1. No purging in the anolyte reservoir was used to prevent oxidation during testing.
In a second experiment, a glass cell with two reservoirs open to air of 50 mL, equipped with two carbon paper electrodes (Toray TGP-H090) (2 cm x 6.5 cm) and an ion exchange membrane Nafion 115 (3.8 cm2) was used for the electrochemical measurement. Electrolytes were prepared by dissolving 0.04 M V(IV) from VOSO4 in 1 M H2SO4 solution. In a first charging step, 20 mL of
V(IV) solution were placed in each cell compartment and the cell was galvanostatically charged with a current density of 10 mA in order to transform the initial V(IV) solution in V(III) and V(V). Subsequently, in a second charging step the V(V) solution was removed and substituted with 20 mL of V(IV) fresh solution keeping the same V(III) in the second tank. The cell was galvanostatically charged again with a current density of 10 mA in order to oxidise again the fresh initial V(IV) solution in V(V) and to reduce the V(III) to V(II). All the final solutions were analysed with spectrophotometer UV/Vis (Beckman DU530) in the range 350÷900 nm with a step of 1.0 nm s-1.
10
In addition, the produced V(V) and V(III) solutions were analysed measuring the V(IV) molar concentration during the time in order to verify their stability.
3. Results and Discussion
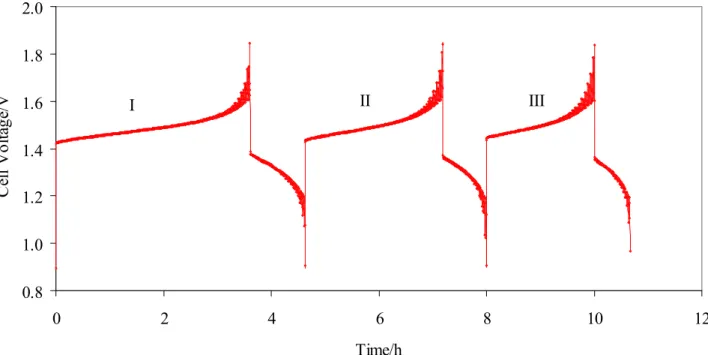
Figure 1 shows three consecutive cycles of charge/discharge to 50 mA between 1.8 and 1.0 V on the graphite cell.
0.8 1.0 1.2 1.4 1.6 1.8 2.0 0 2 4 6 8 10 12 Time/h C ell V olt ag e/ V I II III
Figure 1 – Three consecutive charge–discharge cycles at 50 mA cm-2 in 5 cm2 single cell.
Clearly, as using equal volumes of solution to the cathode and the anode, in every charge/discharge step, at one side of the cell, only the couple V(IV)/V(III) can be reduced or oxidised by according to the reaction:
VO2+(IV) + 2H+ +e- ↔ V3+(III) +H2O E°= 0.337 V vs. NHE (5)
Instead, on the other side the reaction 1 occurs without problems. Moreover, the figures 1 shows that at each cycle the amount of charge/discharge decreases. It appears that at each cycle was
11
decreased the amount of some electro active species. As we will show in the second experiment, this effect is mainly due to the oxygen dissolved in the solution that acts by oxidising the V(III) produced in the charge at V(IV).
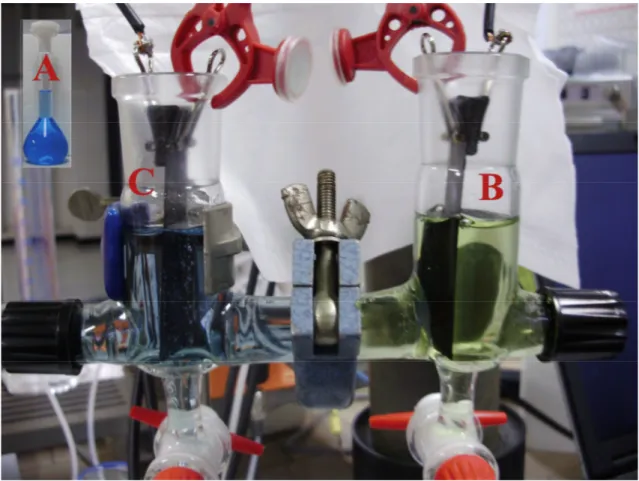
The figure 2 shows the glass cell with the two reservoirs after the first charging step. The upper insert image show the initial V(IV) solution (A) that it is characterised by a typical turquoise blue colour. The right side reservoir represents the completely oxidised V(IV) to V(V) solution (B) that appear as a light green/yellow solution.
Figure 2 - Photograph of glass cell after charging step: A) initial, B) oxidised, C) reduced solution.
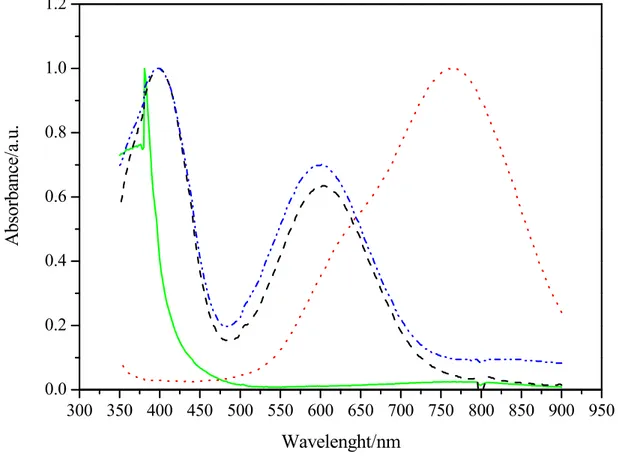
The left side reservoir show after the reduction from V(IV) to V(III) a bluish solution (C). The figure 3 shows the UV/Vis spectra of the initial V(IV) solution and the spectra for the final solutions. The starting solution (A) shows the characteristic peak of V(IV) at about 765 nm [11]. After the charging step the oxidised solution (B), evidences the complete disappearing of the V(IV)
12
and the typical shape of the V(V) with a sharp absorbance increase at about 390 nm. The reduced solution (C) show two peaks at 400 and 600 nm indicative of V(III).
300 350 400 450 500 550 600 650 700 750 800 850 900 950 0.0 0.2 0.4 0.6 0.8 1.0 1.2 A bs or bance/ a. u. Wavelenght/nm
Figure 3 – UV-Vis spectra for the (A) starting solution (⋅⋅⋅⋅) ,(B) solution (⎯), (C) solution (----) at the end of first charging step and (C) solution after the second charging step (-⋅⋅-).
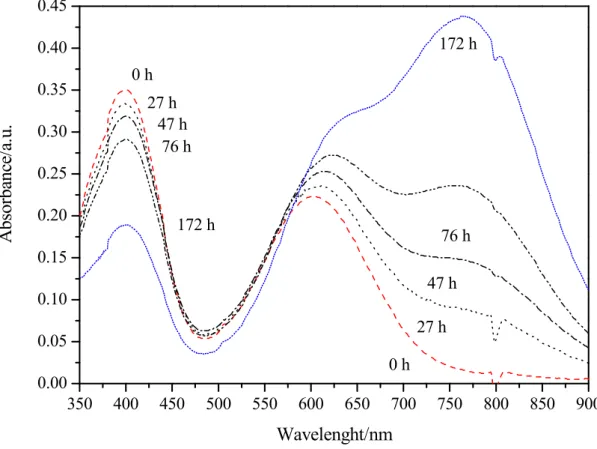
The second charging steps of the (C) solution, after the insertion of V(IV) fresh solution in the catholyte reservoir, has produced only a small reduction from V3+ to V2+ as showed by the low increase in the signal at 850 nm typical of the V(II) ion. These results confirm those obtained by Choi [11] with the electrolyte exposed to air. In addition, new B and C solutions obtained with only one charging steps, were stored exposing to air and were analysed during the time. While the V(V) (B solution) appeared stable during the time, instead the V(III) (C solution) not. Figure 4 shows the absorbance during the time of the C solution, evidencing the increase of the signal at 765 nm characteristic of V(IV) and the decrease for the peak at 400 nm indicative of V(III)
13 350 400 450 500 550 600 650 700 750 800 850 900 0.00 0.05 0.10 0.15 0.20 0.25 0.30 0.35 0.40 0.45 27 h 47 h 76 h 172 h 0 h 172 h 76 h 47 h 27 h 0 h A bs or ban ce/ a. u. Wavelenght/nm
Figure 4 – UV-Vis spectra of the (C) solution exposed to air for different time.
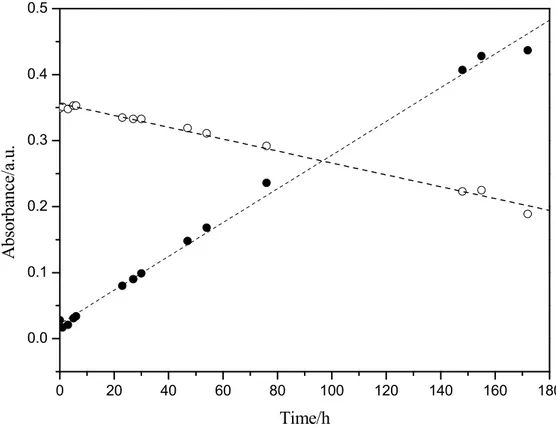
Figure 5 report the absorbance of the peak at 765 nm characteristic of V(IV) and for the peak at 400 nm indicative of V(III) during about 180 hours. With respect to the starting solution, the absorbance evidenced for a linear trend characterised by a slow but continuous oxidation from V3+ to VO2+.
14 0 20 40 60 80 100 120 140 160 180 0.0 0.1 0.2 0.3 0.4 0.5 A bs orbance/ a. u. Time/h
Figure 5 – Absorbance of the (C) solution exposed to air at 765 nm (●) and 400 nm (○) during the time.
We can conclude that the oxygen dissolved in the solution not only limit the reduction from V(III) to V(II) (eq. 4) but also it is able to oxidise the V(III) at V(IV) by means the following reactions:
½ O2 + 2H+ + 2e- = H2O E°= 1,23 V vs. NHE (5) 2V3+(III) +2H2O = 2VO2+(IV) + 4H+ + 2e- E°= 0.34 V vs. NHE (6)
½ O2 + 2V3+(III) + H2O = 2VO2+(IV) + 2H+ (7)
Finally, a second test on the same (C) solution kept in a glass vial containing but not free exposed to air, showed that the V(III) oxidation occurs always but more slowly if we limit the oxygen dissolution.
15
In this work, we have analyzed the effect of the air oxidation on vanadium species in different oxidation states. It was showed that, not only the oxygen presence restricts strongly the reduction of V(IV) to V(II) in the charging steps of a VRFB. In addition, its presence makes the V(III) solution strongly unstable, due to a constant oxidation in the time. These observations place in evidence that the VRFBs require operating conditions in which the presence of oxygen both in the phase of charge that of conservation of the anolyte solution is critical and it should be minimised.
16
References
1) Di Blasi A, Briguglio N, Di Blasi O, Antonucci V, Charge–discharge performance of carbon fiber-based electrodes in single cell and short stack for vanadium redox flow battery. Applied Energy 2014;125:114–122.
2) Landgrebe AR, Donley SW, Battery storage in residential applications of energy from photovoltaic sources. Applied Energy 1983;15:127–37.
3) Mulder G, Six D, Claessens B, Broes T, Omar N, Van Mierlo J, The dimensioning of PV-battery system depending on the incentive and selling price conditions. Applied Energy 2013;111:1126–35.
4) Lee BS, Gushee DE, Electricity storage: the achilles’ heel of renewable energy. Chem Eng Prog 2008;104:S29–32.
5) Chen H, Ngoc Cong T, Yang W, Tan C, Li Y, Ding Y, Progress in electrical energy storage system. Prog Nat Sci 2009;19:291–312.
6) Chang T, Zhang J, Fuh Y, Electrical, mechanical and morphological properties of compressed carbon felt electrodes in vanadium redox flow battery, Journal of Power Sources 2014;245:66-75.
7) Flox C, Skoumal M, Rubio-Garcia J, Andreu T, Morante JR, Strategies for enhancing electrochemical activity of carbon-based electrodes for all-vanadium redox flow batteries. Applied Energy 2013;109:344–351.
8) Liu QH, Grim GM, Papandrew AB, Turhan A, Zawodzinski TA, Mench MM, High Performance Vanadium Redox Flow Batteries with Optimized Electrode Configuration and Membrane Selection. Journal of The Electrochemical Society 2012;159(8):A1246-A1252. 9) Sum E, Skyllas-Kazacos M, A Study of the V(II)/V(III) redox couple for redox flow cell
applications. Journal of Power Sources 1985;15:179-190.
10) Sum E, Rychcik M, Skyllas-Kazacos M, Investigation of the V(V)/V(IV) System for use in the positive half-cell of a redox battery. Journal of Power Sources 1985;16:85-95.
17
11) Choi NH, Kwon S, Kim H., Analysis of the Oxidation of the V(II) by Dissolved Oxygen Using UV-Visible Spectrophotometry in a Vanadium Redox Flow Battery. Journal of Electrochem. Soc. 2013;160(6):A973-A979.
12) Corcuera S, Skyllas-Kazacos M, State-of-charge monitoring and electrolyte rebalancing methods for the Vanadium Redox Flow Battery, European Eur. Chem. Bull. 2012, 1(12), 511-519
Edito dall’ENEA
Servizio Promozione e Comunicazione Lungotevere Thaon di Revel, 76 - 00196 Roma
www.enea.it Pervenuto il 10.3.2016
Stampato presso il Laboratorio Tecnografico ENEA - C.R. Frascati Finito di stampare nel mese di marzo 2016