“Non importa la forma... n`e il vestito che indossi, n`e come, quando, dove
n`e il nome con cui ti chiamano... il mio affetto sar`a sempre con te, fino al giorno che verr`a...
quando i sogni ci riuniranno ancora. Grazie per essere sempre stato con noi.“ - Floricienta Bertotti
Acknowledgements
My supervisors, Prof. Domenico Sacc`a and Dr. Giuseppe Manco, have been very encouraging and helpful. My deepest appreciation to them for ensuring that resources are available for me, and also consistently giving me sound, valuable advices.
I wish to thank all my collegues of Institute of High Performance Comput-ing and NetworkComput-ing of the National Research Council (ICAR-CNR) for their help during the period of research at ICAR, in particular the ing. Giuseppe Papuzzo, the ing. Vincenzo Russo and the ing. Ettore Ritacco.
My parents made many personal sacrifices for me to get an overseas edu-cation. At this point in time, i hope that enough has been done in my studies to make them feel proud, not only of me, but also of themselves.
Preface
Due to the dramatic increase of fraud which results in loss of billions of dollars worldwide each year, several modern techniques in detecting fraud are con-tinually evolved and applied to many business fields. Fraud detection involves monitoring the behavior of populations of users in order to estimate, detect, or avoid undesirable behavior.
The purpose of this dissertation is to determine the most appropriate data mining methodology, methods, techniques and tools to extract knowledge or insights from enormous amounts of data to detect fraudolent behaviour. Fraud detection in VAT context is used as the application domain.
The focus is on overcoming the technical problems and alleviating the prac-tical problems of data mining in fraud detection. The technical obstacles are due to imperfect, highly skewed data, and hard-to-interpret predictions. The practical barriers are caused by the dearth in domain knowledge, many evolv-ing fraud patterns, and the weaknesses in some evaluation metrics.
Several methods and techniques are introduced to solve these problems. In particular first, it was proposed a new methodology to individuate fraudsters, called Sniper, that aims to maximize the ”quality” of those selected through the use of rule-based systems and ensemble methods. This method was gener-alized in order to identify “exceptional” fraudolent behaviours in application domains in which these behaviors are not labeled but are highlighted by a function on a continuous range of values. Finally was presented a hierarchical classification framework that works on a more general classification area i.e. imprecise enviroments featured by noise, low occurrence of some cases of in-terest and low class separability.
The preliminary results in the VAT data set confirm the effectiveness of the Sniper methodology to predict anomalous behaviours, while a massive exper-imentation shows that the use of the hierarchical framework improves
signifi-cantly the accuracy on the primary class in imprecise enviroments.
This thesis demonstrates that these techniques have the potential to signifi-cantly reduce loss from illegitimate behaviour.
Universit`a della Calabria Massimo Guarascio
Contents
1 Introduction . . . 1
2 Fraud Detection: Methods and Techniques . . . 7
2.1 Motivation . . . 7
2.2 Overview . . . 8
2.3 Supervised Approaches on Labelled Data . . . 10
2.4 Hybrid Approaches with Labelled Data . . . 13
2.4.1 Supervised Hybrids . . . 13
2.4.2 Supervised/Unsupervised Hybrids . . . 13
2.5 Semi-supervised Approaches with Only Legal Data . . . 15
2.6 Unsupervised Approaches with Unlabelled Data . . . 15
2.7 Performance Measures . . . 17
2.8 Critique of Methods and Techniques . . . 18
3 SNIPER: a methodology for Fiscal Fraud Detection . . . 21
3.1 SNIPER technique . . . 21
3.2 Application Context . . . 21
3.3 DIVA Overview . . . 22
3.4 Modeling Multi-Purpose Objectives . . . 24
3.5 Building the classifier . . . 32
3.5.1 Generating rules . . . 34
3.5.2 Merging rulesets . . . 35
3.6 Results . . . 39
3.6.1 Learning of single classifiers . . . 39
3.6.2 Sniper technique results . . . 39
4 Exceptional Fraudsters Detection . . . 43
4.1 Problem definition . . . 43
4.2 Notation . . . 45
4.3 Numeric SNIPER Technique . . . 48
4.3.2 Rule Learning . . . 50
4.4 Evaluation . . . 51
5 Improving accuracy in imprecise environments . . . 57
5.1 Rule-Learning with Probabilistic Smoothing . . . 57
5.2 Motivation . . . 57
5.3 The Hierarchical Predictive Framework . . . 60
5.3.1 Training Local Classifiers . . . 63
5.4 Evaluation . . . 66
6 Conclusion and future research . . . 73
A Appendix A . . . 77
B Appendix B . . . 79
C Appendix C . . . 81
List of Figures
2.1 Structured diagram of the possible data for analysis . . . 8
3.1 Flowchart of the SNIPER technique . . . 23
3.2 Histograms of proficiency, efficiency and equity . . . 25
3.3 Training set partitioning according to first-level functions . . . 28
3.4 Retrieved fraud within the partitioned dataset. . . 29
3.5 Cumulative gains in proficiency, equity and efficiency . . . 30
3.6 Score function results . . . 31
3.7 Selecting Best Rules Algorithm . . . 37
4.1 Example settings revealing failure of traditional approach . . . 45
4.2 Experimental results . . . 55
5.1 Roc curve for VAT dataset . . . 70
5.2 Roc curve for KDD99 dataset . . . 70
A.1 GENERIC DATA MINING PROCESS . . . 77
B.1 TAXONOMY OF FRAUD . . . 79
List of Tables
3.1 Single classifiers vs Sniper classifier . . . 40
3.2 Rules of the final classifier . . . 40
4.1 Model building time in sec. . . 54
5.1 Classification accuracy . . . 68
5.2 Area Under the Curve . . . 69
1
Introduction
The world is overwhelmed with millions of inexpensive gigabyte disks contain-ing terabytes of data. It is estimated that these data stored in all corporate and government databases worldwide double every twenty months. The types of data available, in addition to the size, are also growing at an alarming rate. Some relevant examples can put this situation into perspective:
• In the United States (US), DataBase Technologies (DBT) Online Incor-porated contains four billion records used by its law enforcement agencies. The Insurance Services Office Incorporated (ISO) claim search database contains over nine billion US claim records, with over two billion claims records added annually [32].
• In Australia, the Insurance Reference Service (IRS) industry database con-sists of over thirteen million individual insurance claims records [32]. The Law Enforcement Assistance Program (LEAP) database for the Victorian police in Australia details at least fourteen million vehicle, property, ad-dress and offender records, with at least half a million criminal offences and incidents added annually.
• In the last 15 years, eBay grew from a simple website for online auctions to a full-scale e-commerce enterprise that processes petabytes of data. A problem faced by all e-commerce companies is misuse of their systems and, in some cases, fraud. For example, sellers may deliberately list a product in the wrong category to attract user attention, or the item sold is not as the seller described it.
• Private firms sell all types of data on individuals and companies, often in the forms of demographic, real estate, utility usage, telecom usage, auto-mobile, credit, criminal, government, and Internet data (Infoglide Software
Corporation, 2002).
This results in a data rich but information poor situation where there is a widening gap between the explosive growth of data and its types, and the ability to analyse and interpret it. Hence there is a need for a new generation of automated and intelligent tools and techniques [53], to look for patterns in data. These patterns can lead to new insights, competitive advantages for business, and tangible benefits for society.
Data mining is the process of discovering, extracting and analysing of mean-ingful patterns, structure, models, and rules from large quantities of data [10]. The process (appendix A) is automatic or semi-automatic, with interactive and iterative steps such as problem and data understanding, data selection, data preprocessing and cleaning, data transformation, incorporation of appro-priate domain knowledge to select data mining task and algorithm, application of data mining algorithm(s), and knowledge interpretation and evaluation [69]. The last step is either the refinement by modifications or the consolidation of discovered knowledge [53]. Discovered patterns, or insights, should be statis-tically reliable, not known previously, and actionable [42, 128].
The data mining field spans several research areas [18] with stunning progress over the last decade. Database theories and tools provide the necessary infras-tructure to store, access and manipulate data. Artificial intelligence research such as machine learning and neural networks is concerned with inferring mod-els and extracting patterns from data. Data visualization examines methods to easily convey a summary and interpretation of the information gathered. Statistics is used to support and negate hypotheses on collected data and control the chances and risks that must be considered upon making generali-sations. Distributed data mining deals with the problem of learning useful new information from large and inherently distributed databases where multiple models have to be combined.
The most common goal of business data mining applications is to predict customer behaviour. However this can be easily tailored to meet the objective of detecting and preventing criminal activity. It is almost impossible for per-petrators to exist in this modern era without leaving behind a trail of digital transactions in databases and networks [78].
Therefore, data mining in fraud detection is about systematically examining, in detail, hundreds of possible data attributes from such diverse sources as law enforcement, industry, government, and private data provider databases. It is also about building upon the findings, results and solutions provided by the database, machine learning, neural networks, data visualisation, statistics, and distributed data mining communities, to predict and deter illegitimate
ac-1 Introduction 3 tivity.
The term fraud here refers to the abuse of a profit organisations system without necessarily leading to direct legal consequences. In a competitive en-vironment, fraud can become a business critical problem if it is very prevalent and if the prevention procedures are not fail-safe. Fraud detection, being part of the overall fraud control, automates and helps reduce the manual parts of a screening/checking process. This area has become one of the most established industry/government data mining applications.
It is impossible to be absolutely certain about the legitimacy of and intention behind an application or transaction. Given the reality, the best cost effective option is to tease out possible evidences of fraud from the available data using mathematical algorithms.
Fraud takes many diverse forms, and is extremely costly to society. It can be classified into three main types, namely, against organisations, government and individuals (see appendix B). This thesis focuses on fraud against organ-isations.
Fraud detection poses some technical and practical problems for data mining; the most significant technical problem is due to limitations, or poor quality, in the data itself. The data is usually collected as a by-product of other tasks rather than for the purpose of fraud detection. Although one form of data collection standard for fraud detection has been introduced, not all data at-tributes are relevant for producing accurate predictions and some attribute values are likely to have data errors.
Another crucial technical dilemma is due to the highly skewed data in fraud detection. Typically there are many more legitimate than fraudulent examples. This means that by predicting all examples to be legal, a very high success rate is achieved without detecting any fraud. Another negative consequence of skewed data is the higher chances of overfitting the data. Overfitting occurs when models high accuracy arises from fitting patterns in the training set that are not statistically reliable and not available in the score set [42].
Another major technical problem involves finding the best ways to make pre-dictions more understandable to data analysts.
The most important practical problem is a lack of domain knowledge, or prior knowledge, which reveals information such as the important attributes, the likely relationships and the known patterns. With some of the domain knowl-edge described in this and the following paragraph, the search time for using the data mining process can be reduced. Basically, fraud detection involves discovering three profiles of fraud offenders, each with constantly evolving
modus operandi. Average offenders can be of any gender or socio-economic group and they commit fraud when there is opportunity, sudden tempta-tion, or when suffering from financial hardship. Criminal offenders are usually males and criminal records. Organised crime offenders are career criminals who are part of organised groups which are prepared to contribute consider-able amount of time, effort and resources to perpetuate major and complex fraud.
Using learning algorithms in data mining to recognise a great variety of fraud scenarios over time is a difficult undertaking. Fraud committed by average offenders is known as soft fraud, which is the hardest to mitigate because the investigative cost for each suspected incident is usually greater than the cost of the fraud. Fraud perpetuated by the criminal and organised crime offenders is termed hard fraud and it circumvents anti-fraud measures and approximates many legal forms.
The next practical problem includes assessing the potential for significant impact of using data mining in fraud detection. Success cannot be defined in terms of predictive accuracy because of the skewed data.
Fraud detection represents a challenging issue in several application scenar-ios, and the automatic discovery of fraudulent behaviour is a very important task with great impact in many real-life situations. In this context, the Value Added Tax (VAT) fraud detection scenario is witnessing an increasing interest both for its practical and theoretical issues. Like any tax, the VAT is open to fraud and evasion. There are several ways in which it can be abused, e.g. by underdeclaring sales or overdeclaring purchases. However, opportunities and incentives to fraud are provided by the credit mechanism which characterizes VAT: tax charged by a seller is available to the buyer as a credit against their liability on their own sales and, if in excess of the output tax due, refunded to them. Thus, fraudulent claims for credit and refunds are an extensive and problematic issue in fiscal fraud detection. Under this perspective, the capa-bility to provide a mathematical modelling methodology capable of producing a predictive analysis tool is of great significance. The tool should be able to identify the tax payers with the highest probability of being VAT defrauders, in order to support the activity of planning and performing effective fiscal audits.
There are several issues that make the problem difficult to address. First of all, the auditing capability is limited in each government agency: in Italy, for example, audited data available are only 0,004% of the overall population of taxpayers who file a VAT refund request. This restriction inevitably raises a sample selection bias: while auditing is the only way to produce a training set upon which to devise models, auditors focus only upon subjects which are particularly suspicious according to some clues. As a consequence, the number
1 Introduction 5 of positive subjects (individuals which are actually defrauders) is much larger than the number of negative (i.e., non-defrauders) subjects. This implies that, despite the number of fraudulent individuals is far smaller than those of non-fraudulent individuals in the overall population, this proportion is reversed in the training set.
The limited auditing capability of a generic Revenue Agency poses severe con-straints also in the design of the scoring system: auditing is a time-consuming task, involving several investigation and legal steps, which ultimately require a full-time employ of human resources. As a consequence, the scoring system should only concentrate on a user-defined fixed number of individuals (repre-senting the auditing capability of the agency), with high fraudulent likelihood and with a minimum false positive rate. The DIVA project, that was report in section 3.2, tries to tackle the VAT Fraud Detection issue raised by the credit mechanism via the adoption of data mining techniques. The project involved computer science researchers, as well as experts from the Italian Revenue Agency and IT professional with expertise in managing the tax information system on behalf of the Italian Tax Administration.
The main objective of this study is to survey and evaluate methods and techniques to solve the common fraud detection problems previously out-lined. Exactly, we want to individuate a methodology able to overcome the main problems of fraud detection for the VAT context and then propose a technique that combines the best methods considered to be effective for envi-ronments featured by the same problems of fraud detection, called ”imprecise environments.”
The fraud detection is an extremely difficult task mainly for the nature of the data, affected by bias, which makes it difficult to extract a suitable training set. For this reason, novel approaches have been developed to improve the ac-curacy of classification in imprecise (multi-class) learning environments, which are challenging domains wherein cases and classes of primary interest for the learning task are rare. The main thesis contributions are summarized below:
• To improve the predictive accuracy of models for the context of fraud detection it was introduced a new methodology to individuate fraudsters that aims to maximize the ”quality” of those selected through the use of rule-based systems and ensemble methods. This technique is an ensem-ble method capaensem-ble of combining the best of several rule-based baseline classification tools, each of them capable of addressing a specific problem among the ones described above. The idea of the approach is to progres-sively learn a set of rules until all the above requirements are met.
• In the real world it’s difficult to choose a threshold, in a continuos range, to separate fruadsters more interesting than others. A new technique, is proposed for learning a model that deals with continuous values of excep-tionality. Specically, given some training objects associated with a contin-uous attribute F , it induces a rule-based model for the identification of those objects likely to score the maximum values for F .
• A new framework is proposed that works in a more general area of data classification: imprecise data sets (noise), low occurrence of some cases of interest and low class separability. The framework introduces a hierar-chical approach with two levels: at the top level, there is an associative classifier, which has a global view of data; at the lower level, there are a series of probabilistic models that have a local view of data, in particular one model for each rule of the associative classifier. The goal is to improve the performance, over the minority classes, of the associative classifier, combining it with the probabilistic models.
The rest of this dissertation is organized as follows:
Chapter 2 contains existing fraud detection methods and techniques, the new crime detection method and the evalution measures used in this enviro-ment.
Chapter 3 introduces a methodology, called Sniper, to predict, with high precision, fraudolent behaviours in VAT context;
Chapter 4 describes a technique to identify exceptional objects, in other words taken a set of objects ranked according to a continuos function F this method lets to identify the objects with the higher values of F ;
Chapter 5 formalizes a hierarchical classification framework for discrimi-nating rare classes in imprecise domains;
Chapter 6 concludes with the summary of the research, recommendations for the research problems, and possible directions for future research.
2
Fraud Detection: Methods and Techniques
2.1 Motivation
Studies have shown that detecting clusters of crime incidents [83] and finding possible cause/effect relations with association rule mining [43], are impor-tant to criminal analysis. Yet, the classification techniques have also proven to be highly effective in fraud detection [23, 59] and can be used to predict future crime data and to provide a better understanding of present crime data. Fraud detection involves identifying fraud as quickly as possible once it has been perpetrated. Fraud detection methods are continuously developed to defend criminals in adapting to their strategies. The development of new fraud detection methods is made more difficult due to the severe limitation of the exchange of ideas in fraud detection. Data sets are not made available and results are often not disclosed to the public. The fraud cases have to be detected from the available huge data sets such as the logged data and user behavior. Moreover, fraud detection data being highly skewed or imbalanced is the norm. Usually there are many more legitimate than fraudulent examples. This means that by predicting all instances to be legal, a very high success rate is achieved without detecting any fraud.
There can be two typical ways to proceed when faced with this problem. The first approach is to apply different algorithms (meta-learning). Each al-gorithm has its unique strengths, so that it may perform better on particular data instances than the rest [124]. The second approach is to manipulate the class distribution (sampling). The minority class training examples can be increased in proportion to the majority class in order to raise the chances of correct predictions by the algorithm(s). Most of the published work on improving the performance of standard classifiers on skewed data usually in-volves using the same algorithm(s). For example, the work on cost sensitive learning [39,90] aimed at reducing total cost, and sampling approaches [25,39] to favour the minority class are usually demonstrated with decision tree algo-rithms and/or naive Bayes.
One related problem caused by skewed data includes measuring the perfor-mance of the classifiers. Success cannot be defined in terms of predictive accu-racy because the minority class in the skewed data usually has a significantly higher cost. Recent work on skewed data sets was evaluated using better per-formance metrics such as Area Under Curve (AUC) [25, 82], cost curves [41], and Receiver Operating Characteristic (ROC) analysis [76].
At present, fraud detection has been implemented by a number of methods such as data mining, statistics, and artificial intelligence. Fraud is discovered from anomalies in data and patterns. This chapter examines four major meth-ods commonly used, and their corresponding techniques and algorithms, and introduces the main measures used to evaluate the results in this enviroment.
2.2 Overview
Fig. 2.1: Structured diagram of the possible data for analysis. Data mining approaches can utilise training/testing data with labels, only legal examples, and no labels to predict/describe the evaluation data.
The figure 2.1 shows that many existing fraud detection systems typically operate by adding fraudulent claims/applications/transactions/accounts/sequences (A) to black lists to match for likely frauds in the new instances (E). Some use hard-coded rules which each transaction should meet such as matching addresses and phone numbers, and price and amount limits [102].
An interesting idea borrowed from spam [51] is to understand the tempo-ral nature of fraud in the black lists by tracking the frequency of terms and
2.2 Overview 9 category of terms (style or strategy of fraudster) found in the attributes of fraudulent examples over time. Below outlines the complex nature of data used for fraud detection in general [50, 51]:
• Volume of both fraud and legal classes will fluctuate independently of each other; therefore class distributions (proportion of illegitimate examples to legitimate examples) will change over time.
• Multiple styles of fraud can happen at around the same time. Each style can have a regular, occasional, seasonal, or onceoff temporal characteristic. • Legal characteristics/behaviour can change over time.
• Within the near future after uncovering the current modus operandi of professional fraudsters, these same fraudsters will continually supply new or modified styles of fraud until the detection systems start generating false negatives again.
With reference to figure 2.1, the common data mining approaches to deter-mine the most suspicious examples from the incoming data stream (evaluation data) are:
1. Labelled training data (A + B + C + D) can be processed by single super-vised algorithms (section 2.3). A better suggestion is to employ hybrids such as multiple supervised algorithms (section 2.4.1), or both supervised and unsupervised algorithms (section 2.4.2) to output suspicion scores, rules and/or visual anomalies on evaluation data.
2. All known legal claims/applications/transactions/accounts/ sequences (C) should be used processed by semi-supervised algorithms to detect signifi-cant anomalies from consistent normal behaviour (section 2.5).
However, there are many criticisms with using labelled data to detect fraud:
• In an operational event-driven environment, the efficiency of process-ing is critical.
• The length of time needed to flag examples as fraudulent will be the same amount of time the new fraud types will go unnoticed.
• The class labels of the training data can be incorrect and subject to sample selectivity bias [58].
• They can be quite expensive and difficult to obtain [16].
• Staffs have to manually label each example and this has the potential of breaching privacy particularly if the data contains identity and per-sonal information.
• [40] recommend the use of unlabelled data because the fraudster will try to make fraud and legal classes hard to distinguish.
Therefore it is necessary to:
3. Combine training data (the class labels are not required here) with eval-uation data (A + C + E + F). These should be processed by single or multiple unsupervised algorithms to output suspicion scores, rules and/or visual anomalies on evaluation data (section 2.6).
2.3 Supervised Approaches on Labelled Data
Predictive supervised algorithms examine all previous labelled transactions to mathematically determine how a standard fraudulent transaction looks like by assigning a risk score [102]. Neural networks are popular and support vec-tor machines (SVMs) have been applied. [36] used a three-layer, feed-forward Radial Basis Function (RBF) neural network with only two training passes needed to produce a fraud score in every two hours for new credit card transac-tions. [6] used a multi-layer neural network with exponential trace memory to handle temporal dependencies in synthetic Video-on-Demand log data. [126] propose fuzzy neural networks on parallel machines to speed up rule pro-duction for customer-specific credit card fraud detection. [65] proposes SVM ensembles with either bagging and boosting with aggregation methods for telecommunications subscription fraud.
The neural network and Bayesian network comparison study [77] uses the STAGE algorithm for Bayesian networks and backpropagation algorithm for neural networks in credit transactional fraud detection. Comparative results show that Bayesian networks were more accurate and much faster to train, but Bayesian networks are slower when applied to new instances.
[45] developed Bayesian network models in four stages with two parameters. They argue that regression, nearest-neighbour, and neural networks are too slow and decision trees have difficulties with certain discrete variables. The model with most variables and with some dependencies performed best for their telecommunications uncollectible debt data.
2.3 Supervised Approaches on Labelled Data 11 [109] applies the weight of evidence formulation of AdaBoosted naive Bayes (boosted fully independent Bayesian network) scoring. This allows the com-puting of the relative importance (weight) for individual components of sus-picion and displaying the aggregation of evidence pro and contra fraud as a balance of evidence which is governed by a simple additivity principle. Com-pared to unboosted and boosted naive Bayes, the framework showed slightly better accuracy and AUC but clearly improved on the cross entropy and Brier scores. It is also readily accessible and naturally interpretable decision support and allows for flexible human expert interaction and tuning on an automobile insurance dataset.
Decision trees, rule induction, and case-based reasoning have also been used. [48] introduced systematic data selection to mine concept-drifting, possibly insufficient, data streams. The paper proposed a framework to select the op-timal model from four different models (based on old data chunk only, new data chunk only, new data chunk with selected old data, and old and new data chunks). The selected old data is the examples which both optimal mod-els at the consecutive time steps predict correctly. The crossvalidated decision tree ensemble is consistently better than all other decision tree classifiers and weighted averaging ensembles under all concept-drifting data chunk sizes, es-pecially when the new data chunk size of the credit card transactions are small. With the same credit card data as [48], [112] demonstrates a pruned classifier C4.5 ensemble which is derived by weighting each base classifier according to its expected benefits and then averaging their outputs. The authors show that the ensemble will most likely perform better than a single classifier which uses exponential weighted average to emphasise more influence on recent data. [97] presents a two-stage rules-based fraud detection system which first in-volves generating rules using a modified C4.5 algorithm. Next, it inin-volves sort-ing rules based on accuracy of customer level rules, and selectsort-ing rules based on coverage of fraud of customer rules and difference between behavioural level rules. It was applied to a telecommunications subscription fraud. [13] used boosted C5.0 algorithm on tax declarations of companies. [100] applied a variant of C4.5 for customs fraud detection.
Case-based reasoning (CBR) was used by [121] to analyse the hardest cases which have been misclassified by existing methods and techniques. Retrieval was performed by thresholded nearest neighbour matching. Diagnosis utilised multiple selection criteria (probabilistic curve, best match, negative selection, density selection, and default) and resolution strategies (sequential resolution-default, best guess, and combined confidence) which analysed the retrieved cases. The authors claimed that CBR had 20% higher true positive and true negative rates than common algorithms on credit applications.
least squares regression and stepwise selection of predictors to show that stan-dard statistical methods are competitive. Their version of fully automatic step-wise regression has three useful modifications: firstly, organises calculations to accommodate interactions; secondly, exploits modern decision-theoretic crite-ria to choose predictors; thirdly, conservatively estimate p-values to handle sparse data and a binary response before calibrating regression predictions. If cost of false negative is much higher than a false positive, their regres-sion model obtained significantly lesser misclassification costs than C4.5 for telecommunications bankruptcy prediction.
[46] chooses the best indicators (attributes) of fraud by first querying domain experts, second calculating conditional probabilities of fraud for each indicator and third Probit regressions to determine most significant indicators. The au-thors also use Prohit regressions to predict fraud and adjusts the threshold to suit company fraud policy on automobile property damages. [75] compares a multinomial logit model (MNL) and nested multinomial logit model (NMNL) on a multiclass classification problem. Both models provide estimated condi-tional probabilities for the three classes but NMNL uses the two step estima-tion for its nested choice decision tree. It was applied to automobile insurance data. [79] described least-squares stepwise regression analysis for anomaly de-tection on aggregated employees applications data.
Other techniques include expert systems, association rules, and genetic pro-gramming. Expert systems have been applied to insurance fraud. [37] have implemented an actual five-layer expert system in which expert knowledge is integrated with statistical information assessment to identify medical in-surance fraud. [99]), [47] and [111] have experimented on fuzzy expert sys-tems. [105] applied an expert system to management fraud. [27] introduce a Fraud Patterns Mining (FPM) algorithm, modified from Apriori, to mine a common format for fraud-only credit card data. [8] uses genetic programming with fuzzy logic to create rules for classifying data. This system was tested on real home insurance claims [8] and credit card transaction data [9]. None of these papers on expert systems, association rules, and genetic programming provide any direct comparisons with the many other available methods and techniques.
The above supervised algorithms are conventional learning techniques which can only process structured data from single 1- to-1 data tables. Further re-search using labelled data in fraud detection can benefit from applying rela-tional learning approaches such as Inductive Logic Programming (ILP) [80] and simple homophily-based classifiers (Provost et al, 2003) on relational databases. [86] also present novel target-dependent aggregation methods for converting the relational learning problem into a conventional one.
2.4 Hybrid Approaches with Labelled Data 13
2.4 Hybrid Approaches with Labelled Data
2.4.1 Supervised Hybrids
Popular supervised algorithms such as neural networks, Bayesian networks, and decision trees have been combined or applied in a sequential fashion to improve results. [23] utilises naive Bayes, C4.5, CART, and RIPPER as base classifiers and stacking to combine them. They also examine bridging incom-patible data sets from different companies and the pruning of base classifiers. The results indicate high cost savings and better efficiency on credit card transactions. [88] proposes backpropagation neural networks, naive Bayes, and C4.5 as base classifiers on data partitions derived from minority oversam-pling with replacement. Its originality lies in the use of a single meta-classifier (stacking) to choose the best base classifiers, and then combine these base classifiers predictions (bagging) to produce the best cost savings on automo-bile insurance claims.
[85] recommends a rule generator to refine the weights of the Bayesian net-work. [106] propose a decision tree to partition the input space, tanh as a weighting function to generate fraud density, and subsequently a backpropa-gation neural network to generate a weighted suspicion score on credit card transactions.
Also, [59] propose genetic algorithms to determine optimal weights of the attributes, followed by k-nearest neighbour algorithm to classify the general practitioner data. They claim significantly better results than without feature weights and when compared to CBR.
2.4.2 Supervised/Unsupervised Hybrids
There is extensive work on labelled data using both supervised and unsu-pervised algorithms in telecommunications fraud detection. [33] propose the use of signatures (telecommunication account summaries) which are updated daily (time-driven). Fraudulent signatures are added to the training set and processed by supervised algorithms such as atree, slipper, and model-averaged regression. The authors remark that fraudulent toll-free numbers tend to have extensive late night activity and long call durations. Cortes and Pregibon (2001) use signatures assumed to be legitimate to detect significant changes in calling behaviour. Association rules is used to discover interesting country combinations and temporal information from the previous month. A graph-theoretic method [34] is used to visually detect communities of interest of fraudulent international call accounts (see section 2.6). [20] assign an averaged suspicion score to each call (event-driven) based on its similarity to fraudulent signatures and dissimilarity to its accounts normal signature. Calls with low
scores are used to update the signature and recent calls are weighted more heavily than earlier ones in the signature.
[50] present fraud rule generation from each cloned phone accounts labelled data and rule selection to cover most accounts. Each selected fraud rule is applied in the form of monitors (number and duration of calls) to the daily legitimate usage of each account to find anomalies. The selected monitors out-put and labels on an accounts previous daily behaviour are used as training data for a simple Linear Threshold Unit. An alarm will be raised on that ac-count if the suspicion score on the next evaluation day exceeds its threshold. In terms of cost savings and accuracy, this method performed better than other methods such as expert systems, classifiers trained without account context, high usage, collision detection, velocity checking, and dialled digit analysis on detecting telecommunications superimposed fraud.
Two studies on telecommunications [21] data show that supervised approaches achieve better results than unsupervised ones. With AUC as the performance measure, [101] show that supervised neural network and rule induction algo-rithms outperform two forms of unsupervised neural networks which identify differences between short-term and long-term statistical account behaviour profiles. The best results are from a hybrid model which combines these four techniques using logistic regression. Using true positive rate with no false posi-tives as the performance measure, [107] claim that supervised neural networks and Bayesian networks on labelled data achieve significantly better outcomes than unsupervised techniques such as Gaussian mixture models on each non-fraud user to detect anomalous phone calls.
Unsupervised approaches have been used to segment the insurance data into clusters for supervised approaches. [28] applies a three step process: k-means for cluster detection, C4.5 for decision tree rule induction, and domain knowl-edge, statistical summaries and visualisation tools for rule evaluation. [122] use a genetic algorithm, instead of C4.5, to generate rules and to allow the domain user, such as a fraud specialist, to explore the rules and to allow them to evolve accordingly on medical insurance claims. [95] present a similar methodology utilising the Self Organising Maps (SOM) for cluster detection before backpropagation neural networks in automobile injury claims. [35] uses an unsupervised neural network followed by a neuro-fuzzy classification sys-tem to monitor medical providers claims.
Unconventional hybrids include the use of backpropagation neural networks, followed by SOMs to analyse the classification results on medical providers claims [98] and RBF neural networks to check the results of association rules for credit card transactions [14].
2.6 Unsupervised Approaches with Unlabelled Data 15
2.5 Semi-supervised Approaches with Only Legal Data
[66] implements a novel fraud detection method in five steps: First, generate rules randomly using association rules algorithm Apriori and increase diver-sity by a calender schema; second, apply rules on known legitimate transaction database, discard any rule which matches this data; third, use remaining rules to monitor actual system, discard any rule which detects no anomalies; fourth, replicate any rule which detects anomalies by adding tiny random mutations; and fifth, retain the successful rules. This system has been and currently being tested for internal fraud by employees within the retail transaction processing system.
[81] use profiling at call, daily, and overall levels of normal behaviour from each telecommunications account. The common daily profiles are extracted using a clustering algorithm with cumulative distribution distance function. An alert is raised if the daily profiles call duration, destination, and quan-tity exceed the threshold and standard deviation of the overall profile. [2] experiment with auto-associative neural networks (one hidden layer and the same number of input and output neurons) on each credit card accounts legal transactions. [67] proposes similarity trees (decision trees with Boolean logic functions) to profile each legitimate customers behaviour to detect deviations from the norm and cluster analysis to segregate each legitimate customers credit card transactions.
2.6 Unsupervised Approaches with Unlabelled Data
Link analysis and graph mining are hot research topics in antiterrorism, law enforcement, and other security areas, but these techniques seem to be rela-tively under-rated in fraud detection research. A white paper [84] describes how the emergent group algorithm is used to form groups of tightly connected data and how it led to the capture of an actual elusive fraudster by visually analysing twelve months worth of insurance claims. There is a brief applica-tion descripapplica-tion of a visual telecommunicaapplica-tions fraud detecapplica-tion system [35] which flexibly encodes data using colour, position, size and other visual char-acteristics with multiple different views and levels. The intuition is to combine human detection with machine computation.[34] examines temporal evolution of large dynamic graphs for telecommunica-tions fraud detection. Each graph is made up of subgraphs called Communities Of Interest (COI). To overcome instability of using just the current graph, and storage and weightage problems of using all graphs at all time steps; the au-thors used the exponential weighted average approach to update subgraphs daily. By linking mobile phone accounts using call quantity and durations to form COIs, the authors confirm two distinctive characteristics of fraudsters.
First, fraudulent phone accounts are linked - fraudsters call each other or the same phone numbers. Second, fraudulent call behaviour from flagged frauds are reflected in some new phone accounts - fraudsters retaliate with applica-tion fraud/identity crime after being detected. [34] states their contribuapplica-tion to dynamic graph research in the areas of scale, speed, dynamic updating, con-densed representation of the graph, and measure direct interaction between nodes.
Some forms of unsupervised neural networks have been applied. [40] creates a non-linear discriminant analysis algorithm which do not need labels. It min-imises the ratio of the determinants of the within and between class vari-ances of weight projections. There is no history on each credit card accounts past transactions, so all transactions have to be segregated into different geo-graphical locations. The authors explained that the installed detection system has low false positive rates, high cost savings, and high computational effi-ciency. [17] use a recurrent neural network to form short-term and long-term statistical account behaviour profiles. Hellinger distance is used to compare the two probability distributions and give a suspicion score on telecommuni-cations toll tickets.
In addition to cluster analysis (section 2.4.2), unsupervised approaches such as outlier detection, spike detection, and other forms of scoring have been ap-plied. [127] demonstrated the unsupervised SmartSifter algorithm which can handle both categorical and continuous variables, and detect statistical out-liers using Hellinger distance, on medical insurance data.
[17] recommend Peer Group Analysis to monitor inter-account behaviour over time. It compares the cumulative mean weekly amount between a target ac-count and other similar acac-counts (peer group) at subsequent time points. The distance metric/suspicion score is a t-statistic which determines the stan-dardised distance from the centroid of the peer group. The time window to calculate peer group is thirteen weeks and future time window is four weeks on credit card accounts. [12] also suggest Break Point Analysis to monitor in-traaccount behaviour over time. It detects rapid spending or sharp increases in weekly spending within a single account. Accounts are ranked by the t-test. The fixed-length moving transaction window contains twenty-four transac-tions: first twenty for training and next four for evaluation on credit card accounts.
[16] recommends Principal Component Analysis of RIDIT scores for rank-ordered categorical attributes on automobile insurance data.
[62] present an experimental real-time fraud detection system based on a Hid-den Markov Model (HMM).
2.7 Performance Measures 17
2.7 Performance Measures
Most fraud departments place monetary value on predictions to maximise cost savings/profit and according to their policies. They can either define explicit cost [23, 50, 88, 112] or benefit models [48, 112].
[19] suggests giving a score for an instance by determining the similarity of it to known fraud examples (fraud styles) divided by the dissimilarity of it to known legal examples (legitimate telecommunications account).
Most of the fraud detection studies using supervised algorithms since 2001 have abandoned measurements such as true positive rate (correctly detected fraud divided by actual fraud) and accuracy at a chosen threshold (number of instances predicted correctly, divided by the total number of instances). In fraud detection, misclassification costs (false positive and false negative error costs) are unequal, uncertain, can differ from example to example, and can change over time. In fraud detection, a false negative error is usually more costly than a false positive error. Regrettably, some studies on credit card transactional fraud [26] and telecommunications superimposed fraud [66] still aim to only maximise accuracy. Some use Receiver Operating Characteristic (ROC) analysis (true positive rate versus false positive rate).
Apart from [110], no other fraud detection study on supervised algorithms has sought to maximise Area under the Receiver Operating Curve (AUC) and minimise cross entropy (CXE). AUC measures how many times the instances have to be swapped with their neighbours when sorting data by predicted scores; and CXE measures how close predicted scores are to target scores. In addition, [110] and [54] seek to minimise Brier score (mean squared error of predictions). Caruana and Niculescu-Mizil (2004) argues that the most effec-tive way to assess supervised algorithms is to use one metric from threshold, ordering, and probability metrics; and they justify using the average of mean squared error, accuracy, and AUC. [52] recommend Activity Monitoring Op-erating Characteristic (AMOC) (average score versus false alarm rate) suited for timely credit transactional and telecommunications superimposition fraud detection.
For semi-supervised approaches such as anomaly detection, [70] propose en-tropy, conditional enen-tropy, relative conditional enen-tropy, information gain, and information cost. For unsupervised algorithms, [127] used the Hellinger and logarithmic scores to find statistical outliers for insurance; [17] and [101] em-ployed Hellinger score to determine the difference between short-term and longterm profiles for the telecommunications account. [12] recommends the t-statistic as a score to compute the standardised distance of the target account with centroid of the peer group; and also to detect large spending changes within accounts.
Other important considerations include how fast the frauds can be detected (detection time/time to alarm), how many styles/types of fraud detected, whether the detection was done in online/real time (event-driven) or batch mode (time-driven) [36].
There are problem-domain specific criteria in insurance fraud detection. To evaluate automated insurance fraud detection, some domain expert compar-isons and involvement have been described. [111] claimed that their algo-rithm performed marginally better than the experienced auditors. [16] and [47] summed up their performance as being consistent with the human experts and their regression scores. [46] stated that both automated and manual methods are complementary. [122] supports the role of the fraud specialist to explore and evolve rules. [84] reports visual analysis of insurance claims by the user helped discover the fraudster.
2.8 Critique of Methods and Techniques
Each technique is intrinsically different from the other, according to the evalu-ation criteria, and has its own strengths and weaknesses. Interpretability refers to how much a domain expert or non-technical person can understand each of the model predictions through visualisations or rules. Effectiveness high-lights the overall predictive accuracy and performance of the each technique. Robustness assesses the ability to make correct predictions given noisy data or data with missing values. Scalability refers to the capability to construct a model efficiently given large amounts of data. Speed describes how effective it is in terms of how fast a technique searches for patterns that make up the model.
For example BBNs could be used for scalability and speed, decision trees for interpretability, and ANNs for its effectiveness and robustness. By abstracting from the peculiarities of each of the above techniques, we can generally affirm:
• In most scenarios of real-world fraud detection, the choice of data mining techniques is more dependent on the practical issues of operational re-quirements, resource constraints, and management commitment towards reduction of fraud than the technical issues poised by the data.
• There is too much emphasis by research on complex, nonlinear supervised algorithms such as neural networks and support vector machines. In the long term, less complex and faster algorithms such as naive Bayes [109]
2.8 Critique of Methods and Techniques 19 and logistic regression [72] will produce equal, if not better results, on population-drifting, concept-drifting, adversarial-ridden data. If the in-coming data stream has to be processed immediately in an event-driven system or labels are not readily available, then semisupervised and unsu-pervised approaches are the only data mining options.
• Other related data mining techniques used in this enviroment and cov-ered by survey papers and bibliographies include outlier detection [60], skewed /unbalanced /rare classes [60], sampling [38], cost sensitive learn-ing, stream minlearn-ing, graph mining [114], and scalability [91].
3
SNIPER: a methodology for Fiscal Fraud
Detection
3.1 SNIPER technique
Planning adequate audit strategies is a key success factor in a posteriori fraud detection applications, such as in fiscal and insurance domains, where audits are intended to detect fraudulent behavior. SNIPER is an auditing methodol-ogy based on a rule-based system, which is capable of trading among conflict-ing issues, such as maximizconflict-ing audit benefits, minimizconflict-ing false positive audit predictions, or deterring probable upcoming frauds. In this chapter it is de-scribed the experience made on the Value Added Tax (VAT) fraud detection scenario and the preliminaries results obtained using SNIPER approach.
3.2 Application Context
The objective of the DIVA project, introduced in section ??, was to design a predictive analysis tool able to identify the tax payers with the highest probability of being VAT defrauders to the aim of supporting the activity of planning and performing effective fiscal audits. The construction of the model is based on historical VAT declaration records labeled with the outcome of the audit performed by the Agency. The domain of the DIVA project is particularly challenging both from a scientific and a practical point of view. First of all, audited data available represent a very small fraction (about 0.15%) of the overall population of taxpayers requesting a VAT refund. This resource-aware restriction inevitably raises a sample selection bias. Indeed, auditing is the only way to produce a training set, and auditors focus only upon subjects which are particularly suspicious according to some clues. As a consequence, the number of positive subjects (individuals which are actually defrauders) is much larger than the number of negative (i.e., non-defrauders) subjects. This implies that, despite the number of fraudulent individuals is far smaller than those of non-fraudulent individuals in the overall population,
this proportion is reversed in the training set. Since auditing is resource-consuming, the number of individuals reported as possible fraudsters is of high practical impact. Hence, a scoring system should primarily suggest subjects with a high fraudulent likelihood, while minimizing false positives. From a socio-economic point of view, it is preferable to adopt a rule based approach to modeling. Indeed, intelligible explanations about the reason why individuals are scored as fraudulent are by far more important than the simple scores associated with them, since they allow auditors to thoroughly investigate the behavioral mechanisms behind a fraud.
3.3 DIVA Overview
In this section we provide an overview of the experience we tackled and the related technique we propose. The section is intended to clarify the choices about the formal building raised up. The data coming from the governmental Revenue Agency is concerned with the VAT declarations of Italian business companies. In particular the experience is focused on the companies claiming a VAT refund. The data made available by the agency consisted of about 34 million VAT declarations spread over 5 years. Data contain general demo-graphic information, like Zip of the registered office, start-up year and Legal status, plus specific information about VAT declarations, like Business Vol-ume, Sales, Import, Export and the total amount of VAT Refund. As a result of a data understanding process conducted jointly with domain experts, we chose a total of 135 such features.
Out of the 34 million of declarations, we collected further information about 45,442 audited subjects. The results of auditing for such subjects are sum-marized in the further feature VAT refund fraud (the difference between the amount of VAT Refund claimed and the VAT Refund actually due). Thus, audited subjects can be roughly classified into defrauders (when VAT refund fraud ≥ 0) and non-defrauders (in the other case). The resulting labeled train-ing set is extremely biased, consisttrain-ing of 38,759 (85.29%) subjects belongtrain-ing to the defrauder class, and 6,683 (14.71%) belonging to the non-defrauder class.
The situation is further exacerbated by the quest for a multi-purpose mod-eling methodology. Experts are interested in scoring individuals according to the following three main criteria.
• Proficiency: scoring and detection should rely not only on a binary deci-sion boundary separating defrauders from non-defrauders. Better, higher fraud amounts make defrauders more significant. For example, detecting a defrauder whose fraud amounts to $1,000 is better than discovering a
3.3 DIVA Overview 23
Fig. 3.1: Flowchart of the SNIPER technique
defrauder whose fraud amounts to $100.
• Equity: a weighting mechanism should leverage detection and scoring to include those cases where the amount of fraud is relevant related to their business volume. In practice, it should be avoided that individuals with low business volumes are never audited. For example, an individual whose fraud amounts to $1,000 and whose business volume amounts to $100,000 , is less interesting than an individual whose fraud amounts to $1,000 but the business volume amounts to $10,000.
• Efficiency: Since the focus is on refunds, scoring and detection should be sensitive to total/partial frauds. For example, a subject claiming an amount of VAT refund equal to 2,000 and entitled to 1,800 is less signifi-cant than a different subject claiming 200 and entitled to 0.
A further requirement is represented by the limited auditing capacity of the Revenue Agency: auditing is a very timeconsuming task, involving several investigation and legal steps which ultimately require a full-time employee. As a consequence, the scoring system should retrieve from the population a user-defined fixed number of individuals with high defrauder likelihood. Sniper has been devised to accommodate all the above mentioned issues in a unified framework. The idea of the approach is to progressively learn a set of rules until all the above requirements are met. The approach is summarized in figure 3.1.
As a first step, a score function is computed which associates an individ-ual with a value representing its degree of interestingness according to the proficiency, equity and efficiency parameters. Clear enough, this function is not known for the individuals in the whole population. Nevertheless, the train-ing set of audited subjects allows the computation of such a function and its analytical evaluation over those known cases.
A discretization step is accomplished for the scoring function, thus associ-ating a class label to each discretization level. This leads to the definition of a class containing the individuals scoring to the maximum value of the function.
Such a class is referred to in the following as top class.
The main objective is hence to build a rule set able to identify individuals belonging to the top class, with two main objectives: (i) false positives should be minimized; (ii) the number of subjects should be as close as possible to a user-specified value. To this purpose, a set of classifiers is trained, where each classifier provides a set of rules. These sets are collected in a global set R after a filtering phase that removes rules not complying with a minimum quality criteria. The set of rules R taken as a whole is not, in general, the best according to the two objectives cited above, since (i) its accuracy (the percentage of subjects of the top class retrieved) can be too low, and (ii) the number of retrieved subjects can be too high. This will be better clarified in section 3.5.
The global set of rules R is employed as input in order to build a final binary classifier, consisting in the optimal subset of the rules in R, according to the two main quality criteria. Notice that the problem of finding the best subset is intractable, thus Sniper uses a greedy strategy. The latter consists into it-eratively selecting the best rule, until the quality criteria are met.
3.4 Modeling Multi-Purpose Objectives
As mentioned in the previous section, a primary task in VAT fraud is to for-malize the notion of interestingness and exceptionalness of an individual. As already stated, auditing individuals is a very resource-consuming task and then it should be focused on those individuals which, among the defrauders, are the most interesting ones.
Within DIVA, this is formalized by means of a scoring function, which al-lows to associate a rank to the whole pupulation and thus to detect the top-fraudulent individuals. This approach is often preferable to a rough clas-sification of the population into fraudulent and non-fraudulent individuals. Here, the notion of scoring function is different than fraud likelihood, i.e., the likelihood of an individual being defrauder. We are more interested in characterizing the severity of the committed fraud. This is done by devising a scoring function capable of associating a notion of severity. In a sense, this is a regression problem, since the scoring function ranges into an interval of continuous values. Of course, people unlikely to commit fraud scores to the lowest values. However, an individual can be associated with a high probabil-ity of committing a fraud, but his/her relevance is low, since the amount of fraud committed is low (e.g., less than 1000). Under this perspective, the score associated with such an individual should be low. Moreover, higher scoring
3.4 Modeling Multi-Purpose Objectives 25
(a) Fraud amount
(b) Ratio between fraud amount and Business volume
(c) Ratio between fraud amount and VAT claimed
Fig. 3.2: Histograms describing the distributions of proficiency (3.2a), effi-ciency (3.2b) and equity (3.2c).
levels represent high relevance, but an individual may not necessarily repre-sent a high likelihood of scoring to such levels.
Thus, our objective is to twofold:
• first, to devise a scoring function based on the notion of fraud severity; • next, to associate, for each individual, the likelihood of committing a severe
fraud (i.e., to scoring to the highest values of the devised scoring function).
Unfortunately, several facets contribute to the definition of severity. Consider, e.g., the histograms in figure 3.2. they represents respectively proficiency, eq-uity and efficiency. However, while all the graphs show a base of almost 7000 individuals with low inclination to fraud, the distribution for the remaining subjects is substantially different. In particular, both proficiency and efficiency follow a lognormal distribution, whereas equity exhibits a mixture of two dif-ferent behaviors, peaked at difdif-ferent degrees of severity.
In the above example, no single measure summarizes the notion of severity of fraud. Better, it could be modeled as a combination of the baseline functions: e.g., within figure 3.2, the individuals scoring to the highest values should lay into the intersection of the rightmost buckets. Other subjects can be selected according to specific user-defined criteria: e.g., we could be interested in indi-viduals scoring high values in any of the three measures, or scoring in a similar way on all of them. We devise this multi-purpose strategy in two stages. In a first stage, several baseline scoring fuctions, also called first level function, can be defined, where each function is aimed at highlighting a specific aspect of the fraudulent behavior. In a second stage, baseline functions are combined according to specific business objectives, thus allowing to focus on the aspects of main interest and to better tune specific auditing criteria.
In general, many aspects play a role about the user notion of interesting individuals, therefore many parameters should be taken into account for es-timating an individual as interesting one. The idea here pursued is to define, interacting with the user, a function (called first-level function) for each of such parameters; then to combine them using a second-level function, able to weight the different first level functions in order to match as best as possible the user needs; and finally to define a scoring function able to sort the indi-viduals by their interestingness.
Baseline scoring functions can be used in combination with threshold val-ues, in order to highlight exceptional values to be taken into account in the next stages. For a particular baseline function f , two threshold values σhif and σlo
f can be defined, which partition the sample into the clusters of individuals
o such that f (o) ≤ σlo f, σ lo f < f (o) ≤ σ hi f , and f (o) > σ hi f . An individual
as-3.4 Modeling Multi-Purpose Objectives 27 suming a very high value on a baseline function f (higher than σhi
f ) can be of
interest for the user even if its score (valuated in the combination with other baselines) is not very high. Analogously, if an individual assumes a very low value on a first-level function (below σlo) and it is not outstanding (beyond
σhi) in any of the baseline functions, then it is not interesting for the user
even if its score is high.
Another advantage for the use of the baseline scoring functions is the pos-sibility to mitigate the sample-selection bias arising from the non-random choice of the individuals to be audited. Consider again the distributions in figure 3.2. We call the functions corresponding to such distributions, fprof
(representing the total amount of fraud), fequ, (the ratio between the total
fraud and the business volume), and feff ( the ratio between the total fraud
amount and the total VAT refund declared). The sample is clearly biased to-wards fraudsters, most individuals exhibit values greater than 0. The adoption of a lower threshold σlo
f, however, allows to rebalance the situation to a more
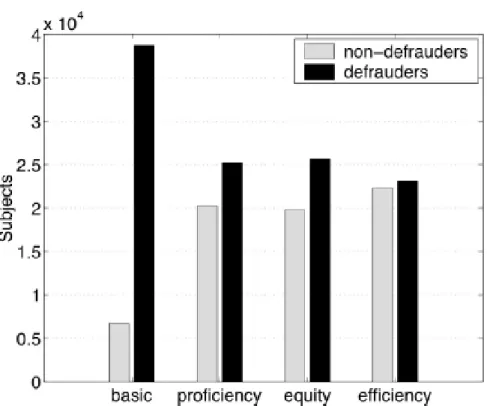
realistic distribution. The figure 3.3 reports the distribution of defrauders and non-defrauders subjects belonging to the sample set. The first histogram rep-resents the distribution as partitioned by fprof with threshold 0. Note that
this corresponds to roughly classify as non-defrauders those subjects whose total fraud amount is 0 and as defrauders all the other subjects, denoted as fbasic. The other histograms represent the distribution as partitioned by fprof,
fequ, and fef f, respectively. Threshold were chosen by exeperts, who assigne
the values σlo fprof = 2,000, σ lo fequ= 0.0025, and σ lo fef f = 0.2, respectively.
It is important to notice that a careful choice of the threshold values does not alter the significance of the training set. The figure 3.4 shows the retrieved fraud (i.e., the sum of the VAT refund fraud) associated with both the subjects identified as defrauders and as non-defrauders by each of the first level functions above considered.
The figure 3.3 highlights that the size of the set Sf of subjects identified as
defrauders by the first level function f is strongly reduced with respect to the size of the set Sfbasic of defrauders identified by fbasic. Nevertheless, as shown
in figure 3.4 the retrieved fraud of Sf is almost similar to that in Sfbasic,
thus confirming that the most interesting defrauders are those selected by the baseline functions.
First level functions play a major role in modeling local properties of fraud-ulent behavior. The role of a second level function is to combine such local properties into a global interestingness measure capable of summarizing them. We can formalize it as follows. Given k first level objective functions f1, . . . , fk,
a second-level objective function is a function F , associating each individual of a population with a real number ranging in [0,1], by combining the values assumed by f1, . . . , fk. The contribution of fi can be also weighted in order
Fig. 3.3: Training set partitioning according to first-level functions
to tune its influence within F .
The combination is made of two steps. A first preliminary step consists in harmonizing the values of the first-level functions, as they can be in different ranges and scales. Consider for example, the function fprof and the function
fequ. The former represents the absolute value of the fraud amount, while the
latter represents the ratio between the fraud amount and the business volume, thus ranging in [0, 1]. Directly combining them is clearly misleading as they refer to different unit measures.
Harmonization should also take care of rescaling values according to threshold values, in order to preserve homogeneity in comparisons. Consider for example two functions f1and f2, both ranging in [0, 1], whose thresholds
are σlo1 = 0.01, σhi1 = 0.1, σlo2 = 0.7 and σ2hi= 0.9. If for an object o both f1(o)
and f2(o) assume value 0.5, the semantic of such a value is inherently different,
and a combination of such values without a proper adjustment would result into a misleading score.
3.4 Modeling Multi-Purpose Objectives 29
Fig. 3.4: Retrieved fraud within the partitioned dataset.
Within Sniper, harmonization is accomplished by means of a normalizing function N : R → [0, 1], associating each value assumed by a first level func-tion with a value in the range [0, 1]. N can simultaneously account for the normalization concerning scales, ranges and thresholds.
Second-level functions can be directly derived by combining and weighting the normalized versions of the first-level functions. We considered two main combination functions: FΠ(o) = Y i∈[1,k] (N (fi(o))) pi FΣ(o) = X i∈[1,k] pi· N (fi(o)),
where pi represents the weight associated with fi. The FΠ function returns
the weighted product of the fi, whereas the FΣfunction returns the weighted
sum of the fi.
These two functions satisfy a different conceptual enforcement, but both of them have guaranteed good experimental results. Essentially, the former function is built by applying a sort of conjunctive operator to the single first-level functions; this fact causes that FΠ(o) assigns an higher value to those
subjects having high values for each first level functions. The latter instead implements a disjunctive criteria, which associates a high value with those
subjects having an high value for one first level functions at least.
Thus, the FΠ function is more selective than FΣ and therefore it could
as-sign a low value to some interesting subjects, for instance, characterized by a low value for one first level function at least and a very high value for the other ones. Analogously, FΣ suffers of the opposite problem, namely, it could
assign an high value to those subjects having an high value for one first level function but low values for all the other ones.
The adequacy of a second level function for capturing the most prominent aspects of the first level functions can be appreciated in figure 3.5. Here, we show the cumulative gains obtained for decreasing values of the score function (equipped with FΠ), relative to profitability, equity and efficiency.
Notice that top individuals cumulate the largest gain in practically all the three parameters.
Fig. 3.5: Cumulative gains in proficiency, equity and efficiency related to the score function.
In the framework we are addressing, the goal is to retrieve from the pop-ulation X individuals scoring the maximum value for the score function. It is more convenient to address this problem by discretizing the F function of interest. This allows us to gain more control on the prediction error, and to adopt well-known classification algorithms to our framework. When dis-cretizing, we can split the scoring function into intervals, and the interval containing the highest values of the score function identifies the top class.
3.4 Modeling Multi-Purpose Objectives 31 The width of the top class strongly influences the quantity and the quality of the individuals identified as members of the top class in the population. Hence, the discretization phase plays a very important role.
Discretization was accomplished by studying the distribution of the score functions. As a result, four main classes were detected. Figure 3.6a reports the effects of the employed discretization in partitioning the subjects. Specifically, from the lighter to the darker colored slice, the figure reports the percentage of subjects in classes 0, 1, 2 and 3, respectively. Conversely, Figure 3.6b reports the percentage of total amount of fraud made by the subjects of the different classes. It is worth pointing out that the subjects belonging to the top class, represent only 7.70% of the total number of audited subjects, but the total amount of fraud associated with them is 84.69% of the total fraud amount made by the whole set of audited subjects. This confirms the adequacy of the score function and the related discretization to our needs.
It is worth noticing also that different approaches can be exploited to discretization, based on clustering algorithms. In principle, the values of first and second level functions can be used to characterize groups. A cluster in that case would represent a set of individuals exhibting similar fraudulent behavior. The interested reader can find the details of the clustering approach to discretization in [7].
(a) Subject partitioning (b) Retrieved fraud Fig. 3.6: Score function results