7th International Conference on
Smart Cities and Green ICT Systems
PROCEEDINGS
Funchal, Madeira, Portugal
16-18 March, 2018
EDITORS Cornel Klein Brian Donnellan Markus Helferthttp://www.smartgreens.org/
SPONSORED BY PAPERS AVAILABLE AT
SMARTGREENS 2018
Proceedings of the
7th International Conference on
Smart Cities and Green ICT Systems
Funchal, Madeira - Portugal
March 16 - 18, 2018
Sponsored by
INSTICC - Institute for Systems and Technologies of Information, Control and Communication In Cooperation with
ACM SIGCAS - ACM Special Interest Group on Computers & Society IEEE Technical Area in Green Computing
Siemens
EDSO - EDSO for Smart Grids
Copyright © 2018 by SCITEPRESS – Science and Technology Publications, Lda. All rights reserved
Edited by Cornel Klein, Brian Donnellan and Markus Helfert
Printed in Portugal ISBN: 978-989-758-292-9 Depósito Legal: 437576/18
http://www.smartgreens.org [email protected]
C
ONTENTS
INVITED SPEAKERS KEYNOTESPEAKERS
Enhanced Protection of Vulnerable Road Users – A Combined Discriminative and Generative Approach for Accurate Detection and Prediction of Pedestrian Intentions
Miguel A. Sotelo 5
IoT Wayfaring through Urban Living Labs
David Prendergast 7
Intelligent Transport Systems for Smart Cities - Improvement of Air Quality on Roads by Environmentally Oriented Urban Traffic Management
Uwe Plank-Wiedenbeck 9
PAPERS FULLPAPERS
Spatial Dependence of Solar Photovoltaic Systems: Data Gathering Process, Related Issues and Preliminary Results
Sergio Copiello 15
Mining Sequential Patterns for Appliance Usage Prediction
Mathieu Kalksma, Brian Setz, Azkario Rizky Pratama, Ilche Georgievski and Marco Aiello 23 Blending Acceptance as Additional Evaluation Parameter into Carbon Capture and Utilization Life-Cycle Analyses
K. Arning, B. Zaunbrecher, A. Sternberg, A. Bardow and M. Ziefle 34 Forecasting Short-term Solar Radiation for Photovoltaic Energy Predictions
Alessandro Aliberti, Lorenzo Bottaccioli, Giansalvo Cirrincione, Enrico Macii, Andrea Acquaviva and Edoardo Patti
44 A Model Predictive Control based Peak Shaving Application for a Grid Connected Household with Photovoltaic and Battery Storage
Deepranjan Dongol, Thomas Feldmann and Elmar Bollin 54 Intelligent Thermal Control Method for Small-Size Air Conditioning System
Hung-Wen Lin, Min-Der Wu, Guan-Wen Chen and Ying Xuan Tan 64 IoT Architecture for Decentralised Heating Control in Households
Gillian Basso, Dominique Gabioud and Pierre Roduit 70 A New Crypto-classifier Service for Energy Efficiency in Smart Cities
Oana Stan, Mohamed-Haykel Zayani, Renaud Sirdey, Amira Ben Hamida, Alessandro Ferreira Leite
and Mallek Mziou-Sallami 78
A Predictive Comfort- and Energy-aware MPC-driven Approach based on a Dynamic PMV Subjectification towards Personalization in an Indoor Climate Control Scenario
Spatial Dependence of Solar Photovoltaic Systems: Data Gathering
Process, Related Issues and Preliminary Results
Sergio Copiello
Department of Design and Planning, IUAV University of Venice, Dorsoduro 2206, Venice, Italy [email protected]
Keywords: Solar Photovoltaic, Spatial Energy, Spatial Data, Peer Effects, Neighborhood Effects.
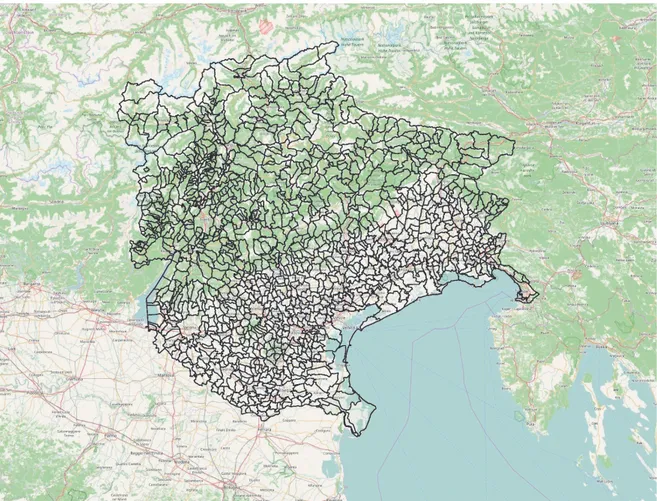
Abstract: In a previous study (Copiello and Grillenzoni, En. Proc., 2017), we have proven the solar photovoltaic capacity in Italy to be characterized by spatial dependence. In that research, the units of analysis were the Italian provinces, which correspond to level 3 of the European NUTS (Nomenclature of territorial units for statistics) classification. Here we focus on new data encoded according to the Italian townships, namely, the municipalities corresponding to level 2 of the European LAU (Local administrative units) classification. The change of scale is a huge challenge, due to both the difficulty to find reliable information and the time-consuming definition of the proximity structure of the units: while the provinces are about 100, the Italian municipalities are several thousands, and each one shares the borders with many others. In particular, three neighboring regions - Veneto, Trentino-Alto Adige, and Friuli-Venezia Giulia, in North-eastern Italy - and their 1,121 towns are considered in this study, which primarily aims to delve into the issues related to the data gathering process. As far as the preliminary findings are concerned, we find more clues about the role played by the so-called neighborhood and peer effects.
1 INTRODUCTION
During the last four decades, in the Western economies, the energy production and consumption model has faced several changes, which imply that producers and consumers have experienced shifts in the energy mix. For instance, it deserves mentioning the progressive substitution of oil products with natural gas, which nowadays is the primary source to produce electricity, as well as to heat buildings, in several countries (Copiello, 2017). Moreover, it is worth recalling the ongoing transition toward the renewables. Under this framework, the last ten years have seen a sizeable increase in the amount of solar photovoltaic (PV) generation, which is about to supply a 10% share of the primary energy used in the residential sector (Copiello, 2017). The upward trend in PV energy production is expected to go on during the next years. According to the Short-Term Energy Outlook published by the Energy Information Administration (July 2017), in the U.S., the large-scale PV electricity generation should increase by 38% in 2017 and 19% in 2018, while the small-scale PV electricity generation will experience a growth of 32% and 29%, respectively. As far as long-term trends are concerned, the 2014 edition of
Technology Roadmap: Solar Photovoltaic Energy published by the International Energy Agency envisions that 16% of total electricity generation will be met by PV systems in 2050, in comparison to 2% in 2020 and 7% in 2030.
The ever-greater role played by PV systems has drawn the attention of the scholarly research, which has been engaged in analyzing the determinants of their adoption and deployment. Following a promising research strand focusing on neighborhood and peer effects, in a previous study we proven the spatial dependence that characterizes the installation of PV capacity in Italy (Copiello and Grillenzoni, 2017b). In that research, the units of analysis were the Italian provinces, which correspond to level 3 of the European NUTS (Nomenclature of territorial units for statistics) classification. Here we focus on new data encoded according to the Italian townships, namely, the municipalities corresponding to level 2 of the European LAU (Local administrative units) classification. In particular, three neighboring regions - Veneto, Trentino-Alto Adige, and Friuli-Venezia Giulia, in North-eastern Italy - and their 1,121 towns are considered (Figure 1). The dataset consists of all the PV systems that have been installed - both by households and companies, on the
Copiello, S.
Spatial Dependence of Solar Photovoltaic Systems: Data Gathering Process, Related Issues and Preliminary Results. In Proceedings of the 7th International Conference on Smart Cities and Green ICT Systems (SMARTGREENS 2018), pages 15-22 ISBN: 978-989-758-292-9
Copyright© 2018 by SCITEPRESS – Science and Technology Publications, Lda. All rights reserved
Figure 1: Area of analysis: the municipalities in North-eastern Italy.
buildings’ rooftop or on the ground - during the period 2005-2016, thanks to the subsidies provided by the Italian laws named “Conto Energia” (Palmer et al., 2015).
The main purpose of this study is to delve into the issues related to the data gathering process, particularly the stage meant to define the proximity structure characterizing the units of analysis. Moreover, we aim to discuss the preliminary empirical evidence, as we find more clues about the role played by the so-called neighborhood and peer effects.
The remainder of this paper is organized as follows. Section 2 provides a brief literature review about the drivers of the adoption of PV systems, with a specific focus on the few studies dealing with the topic of spatial patterns. Section 3 is devoted to discuss the data gathering process and the related issues, particularly as regards the proximity structure of the observations. Section 4 describes the preliminary results we achieve, stressing the additional clues of spatial dependence. Finally,
Section 5 outlines the conclusions of the analysis.
2 LITERATURE REVIEW
The literature argues that the choice to adopt PV systems depend on a set of influential parameters. Balcombe et al. (2013) provide a summary of 18 earlier and contemporary studies that relate to the motivations and barriers for the adoption of microgeneration energy technologies, including both solar thermal and solar PV. Half of these studies concerns the UK, and most of the remaining involves continental Europe’s countries. The reviewed literature agrees in identifying the role played by environmental concerns and financial aspects. As far as the latter are concerned, the will to save money due to lower energy bills is a significant incentive, although counteracted by the expectation of high upfront and operating costs, not to mention long payback times and unclear impact on property
value. It looks like other motivations and barriers do matter, although there is a lack of consensus about their importance. Additional determinants emerging from the literature review performed by Balcombe et al. (2013) are as follows: age; household size; home ownership or tenancy; social class; income; education.
The survey performed by Sardianou and Genoudi (2013) focusing on the residential sector confirms some of the above findings: the consumers’ willingness to adopt renewable energy sources is affected by age, education, income, electricity cost, and perceived installation and maintenance costs. The same authors claim that a tax deduction is more likely to support the acceptance of the renewables than an energy subsidy. However, it should be considered that the above results stem from a small sample, and are characterized by a low goodness of fit.
Within the domain of the renewable energies, the research strand that focuses on the adoption of PV points out the significance of the following factors to distinguish between early innovators, potential adopters, majority adopters, and rejecters: the per-capita income more than sunlight intensity (Schaffer and Brun, 2015); the costs to be incurred and their ratio to the expected benefits (Vasseur and Kemp, 2015); the built environment as well as the property ownership structure (Schaffer and Brun, 2015; Graziano and Gillingham, 2015; Balta-Ozkan et al., 2015; Sommerfeld et al., 2017).
Alongside the above empirical evidence, another phenomenon came to light following specific studies. The literature suggests that the adoption of the renewables, and especially the deployment of solar PV across a country, may be encouraged by a kind of emulation within communities and between neighbors. Let us quote the Schelly’s (2014) words: “Adoption of technological innovations is arguably promoted through [a] form of informal information sharing. [...] it is not simply information, but particular communities of information. [...] For some, individuals within their neighbourhood or community provided inspiration” (p. 188). Actually, during the last few years, a promising research strand has focused on the occurrence of peer effects and neighborhood effects in order to explain the adoption of renewable energy sources, and especially PV systems. That research branch sinks its roots in the idea that spatial dependence is a key driver for the diffusion of technological innovations across territories and regions (Anselin, 1988; Keller, 2002; Schaffer and Brun, 2015).
Bollinger and Gillingham (2012) found that social interactions - namely, peer effects - play a major role in explaining the diffusion of PV panels in California. Their analysis points to the significance of two phenomena that occur within the same zip code area and give rise to social spillovers: the visibility of the PV panels is the former, the influence of word of mouth is the latter. Other studies show evidence that PV adoption is affected by the number of similar systems that have been previously installed in the same area or, more to the point, in the recent past and in the immediate surroundings (Müller and Rode, 2013; Schaffer and Brun, 2015; Graziano and Gillingham, 2015; Balta-Ozkan et al., 2015; Palm, 2016; Rode and Weber, 2016; Dharshing, 2017; Zhao at al., 2017, Copiello and Grillenzoni, 2017b). Let us consider the words of Müller and Rode (2013) that get to the heart of the matter: “imitation of spatially close precursors is indeed an explaining factor in PV adoption; [...] results confirm a localized peer effect in the adoption of PV” (p. 527). Similarly, Graziano and Gillingham (2015) “find clear evidence of spatial neighbor effects (often know as ‘peer effects’) from recent nearby adoptions that diminish over time and space” (p. 816). Balta-Ozkan et al. (2015), Dharshing (2017), and Copiello and Grillenzoni (2017b) confirm the occurrence of regional spillover effects. Rode and Weber (2016) show the occurrence of localized emulative behavior. Zhao et al. (2017) claim that the deployment of PV systems may be described by clusters that tend to spread in the surrounding areas.
3 DATA GATHERING PROCESS
AND RELATED ISSUES
3.1 Proximity Structure
In order to investigate the occurrence of neighborhood and peer effects, the identification of the proximity structure that characterizes the unit of analysis is the most time-consuming process we had to deal with. It relies on the following stages:
use of search engines to find the list of adjoining municipalities for each analyzed township;
replacement of the adjoining municipalities’ names with the codes provided by the National Institute of Statistics;
Spatial Dependence of Solar Photovoltaic Systems: Data Gathering Process, Related Issues and Preliminary Results
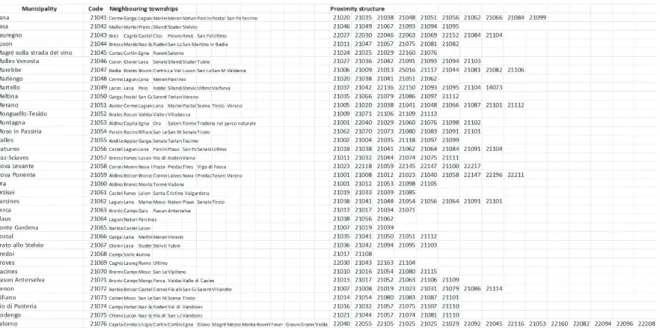
Figure 2: Excerpt from the proximity structure dataset.
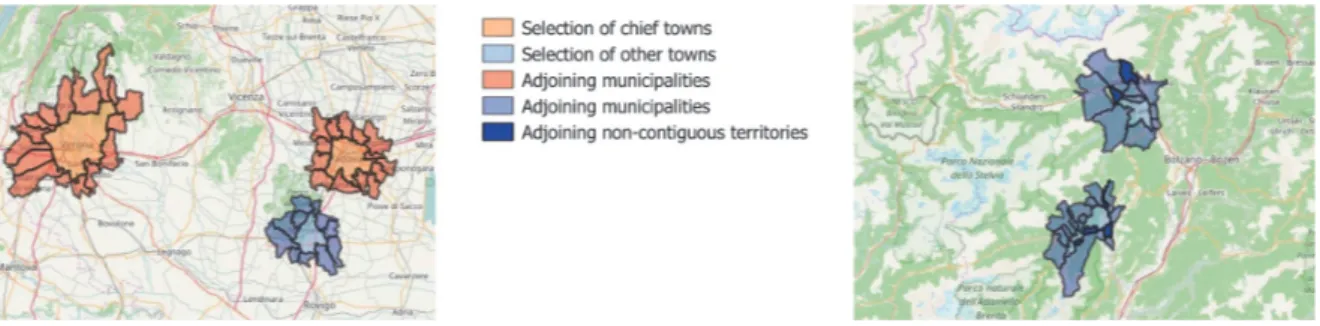
use of the codes to extrapolate the data concerning the solar photovoltaic capacity in the adjoining municipalities, which are then summed to calculate the total (Figure 2). As far as the first stage is concerned, in North-eastern Italy, the number of municipalities surrounding each township highly varies, from a minimum of 1 to a maximum of 21. On average, the number of municipalities sharing their boundaries is equal to 7. Figure 3 shows a selection of complex neighborhoods. For instance, Verona - one of the chief town in the Veneto region - is surrounded by 16 medium-sized townships. That situation is common to other chief towns, but it also occurs in rural and mountainous areas. Another unusual feature is that several municipalities are composed by at least two not contiguous territories. The issue is further complicated because, contrary to what is commonly thought, the municipal boundaries are not stable at all. During the last decade, several changes have taken place, mainly due to the need to reduce the number of local administrative units, so as to achieve saving in public expenditure. In the Trentino-Alto Adige region alone, 50 municipalities have disappeared: after having merged themselves, they have brought 18 new larger townships into being. Most of the mergers occurred in the last few years and became effective in January 2016. Instead, the figures on the installation of solar photovoltaic systems mainly refer to the ex-ante situation. Therefore, we had to keep track of both the following aspects: the photovoltaic capacity installed
in the municipalities according to their former boundaries (before the mergers), and their currently neighboring towns (after the mergers). Another distinguishing feature concerns the Alto Adige area - namely, the province of Bolzano - where the municipalities are identified by two names. Since it is legally designated as a bilingual region, the former name is in Italian, while the latter is in German. Unfortunately, several sources use only one of the names to label the data they provide, hence we had to face matching problems when assembling the dataset.
Leaving the above specific problems aside, the identification of the proximity structure entails, at least, two other issues, which have wide significance and strong ability to affect the results. The former is how we define the concept of proximity, namely, what is the assumptions - and the measures - which we rely on to distinguish the near spatial units from the distant ones. The latter consists in the sort of truncation the proximity structure is sometimes subjected to.
As far as the first topic is concerned, to quote the words of Tobler (1970), “everything is related to everything else” (p. 234) and, more to the point, “everything is related to everything else, but near things are more related than distant things” (p. 236). In this study, we assume that the energy-related behavior in a municipality may be affected by what happens in the adjoining municipalities. Therefore, here we establish a relationship between proximity and administrative borders, suggesting to translate
Figure 3: Selection of complex neighborhoods.
the concept of proximity into practice according to the shared boundaries between the analyzed municipalities. But why not to assume that the local behavior may be somehow affected by what happens in all the surrounding municipalities within a radius of, let us say, 50 kilometers? And why not to consider all the municipalities within the same province or region? Each of the above option is arbitrary and, although we prefer to adopt the first solution, the third one could be preferred for simplicity’s sake. However, it looks hard to sustain that a specific way to define the proximity structure should certainly prevail among several available alternatives. Moreover, one should be aware that the above remarks are not free of consequences for the results. In other words, the empirical findings on the occurrence of spatial dependence phenomena, in turn, also depend on how the spatial relationships between the units of analysis are defined.
As regards the second topic, in our case study, the claim that “everything is related to everything else” is somehow violated by the presence of the national borders, where the spatial relationships find an unexpected interruption. For instance, in the province of Bolzano, the town of San Candido borders on the Austrian town of Sillian. The two towns are not situated on the opposite slopes of high mountains, instead they are both located along the Drava River in the Puster Valley. Moreover, they are well linked by a primary road, and border controls are no more carried out thanks to the Schengen Agreement, not to mention that more than 80% of the inhabitants in the Italian town of San Candido are German native speakers. The same situation can be found in several other municipalities, especially in the northern Alto Adige, at the Austrian border, and in the north-eastern Friuli, at the Austrian and Slovenian borders. Therefore, there is no reason to neglect the occurrence of cross-border relationships and dependencies, except that we have no data on the installed photovoltaic systems outside of Italy. Obviously that data can be searched for, but we must consider that they have a different nature and origin.
Indeed, we are analyzing the photovoltaic systems that were subsidized according to a sequence of Italian laws (Palmer et al., 2015). That laws were stimulated by the European Directive 2001/77/CE. The same happened in Austria, but according to different detailed rules, as well as to different timing and subsidies.
3.2 Other Parameter
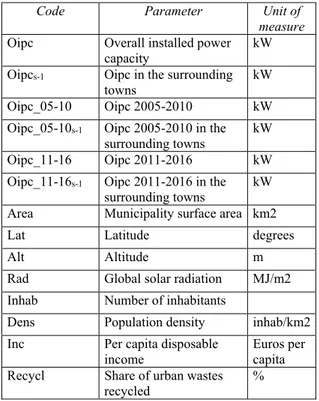
The data concerning the installed PV capacity, both in each municipality and in the adjoining ones, are juxtaposed with variables belonging to the following clusters (Table 1): geoclimatic aspects (surface area, latitude, altitude, solar radiation); demography (inhabitants and population density); economy (income); social and behavioral aspects (waste recycling rate). The underlying hypotheses are as follows. The PV capacity is expected to be fostered by a lower latitude and the corresponding higher solar radiation, while it is expected to be limited by unfavorable geographic conditions, such as smaller surface area and higher altitude. The number of inhabitants and the population density are anticipated to be positively related to the installed PV capacity, since individuals and families are important targets of the policies providing incentives and subsidies for the renewables. Also, the disposable income is expected to be positively related to the installed capacity, because the adoption of PV systems involves the ability to incur investment costs, even in presence of public grants. The waste recycling rate is assumed as a proxy of the adoption of innovative and responsible behavior, hence we expect that the more the individuals and households are prone to recycle, the higher should be the installed PV capacity.
The above variables have some limitations, especially with regard to the reference period, which is not homogeneous. In particular, the data on solar radiation refer to several years ago. They stem from a research performed by ENEA, the former Italian institute for research on nuclear energy, now
Spatial Dependence of Solar Photovoltaic Systems: Data Gathering Process, Related Issues and Preliminary Results
National agency for new technologies, energy and sustainable economic development. The average radiation on monthly and yearly basis is extrapolated from EUMETSAT maps acquired during the period 1995-1999. The results are published only for the towns with more than 10 thousand inhabitants. However, the yearly solar radiation for different locations, according to their latitude and longitude, may be estimated using a web-based calculation tool.
Table 1: Summary of the parameters.
Code Parameter Unit of
measure
Oipc Overall installed power capacity kW Oipcs-1 Oipc in the surrounding
towns kW Oipc_05-10 Oipc 2005-2010 kW Oipc_05-10s-1 Oipc 2005-2010 in the
surrounding towns
kW Oipc_11-16 Oipc 2011-2016 kW Oipc_11-16s-1 Oipc 2011-2016 in the
surrounding towns kW Area Municipality surface area km2 Lat Latitude degrees Alt Altitude m Rad Global solar radiation MJ/m2 Inhab Number of inhabitants
Dens Population density inhab/km2 Inc Per capita disposable
income
Euros per capita Recycl Share of urban wastes
recycled
%
4 PRELIMINARY RESULTS
We base our preliminary findings on the following regression model, from which we expect useful suggestions in order to develop further studies:
Ln Oipc = + Ln Oipcs-1 + Ln X + (1)
where is the constant, and are the regression coefficients, X is the vector of the independent variables, and is the error term. We use a double logarithmic model since in the previous study it proved to fit better the data (Copiello and Grillenzoni, 2017b). Moreover, it allows dealing with the possible non-linear relationships between
the parameters. Since the Ordinary Least Squares (OLS) estimates are affected by heteroscedasticity, as shown by the cone-shaped scatterplot of the residuals (Figure 4), we opt for using heteroskedasticity-robust Weighted Least Squares (WLS) (Copiello and Grillenzoni, 2017a). The results are summarized in Table 2.
Figure 4: Cone-shaped scatterplot of the residuals.
Due to their implications, two empirical findings are worth attention. The first is that, contrary to the expectations, the deployment of solar PV installations has little or nothing to do with latitude and solar radiation. The second is that several clues of neighborhood and peer effects arise from the analysis.
Table 2: Summary of the results. Dependent Oipc
Parameter T-stat P-value const. 6.1309 2.375 0.0177 Oipcs-1 0.4579 13.58 0.0000 Area 0.8493 21.42 0.0000 Dens 0.8313 22.40 0.0000 Inc -1.0487 3.843 0.0001 Adj. R2 0.6471
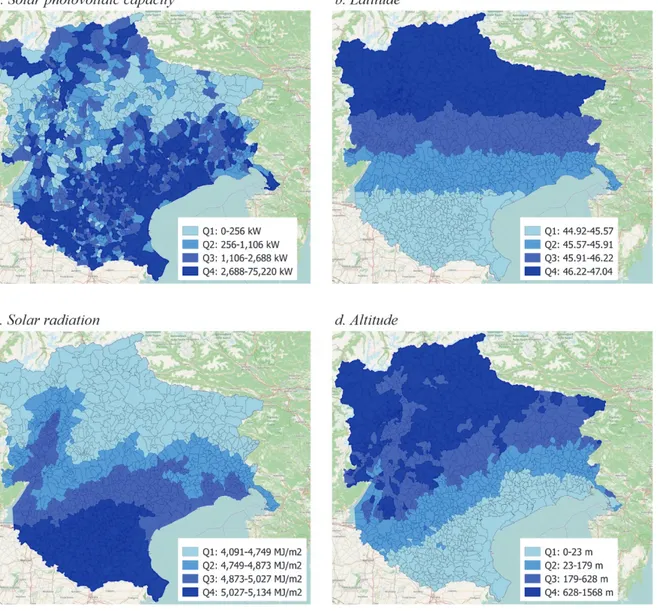
The relationship between PV systems and geoclimatic variables is quite weak with regard to the installed capacity, on the one hand, and both latitude and solar radiation, on the other hand. In Figure 5 the values of these variables are subdivided into quartiles. The correlation values are -0.38 and 0.45, respectively. It looks like the reason is the strong development of the PV capacity in Alto-Adige. Despite being an entirely mountainous region characterized by a solar radiation of 4,661 MJ/m2 on average, the more northern area of analysis has an
Figure 5: Relationship between PV systems and geoclimatic variables.
installed photovoltaic capacity of 1,975 kW (54 kW/Km2), which are nearly the same one can find in the Friuli region (2,151 kW, 77kW/km2), one degree of latitude to the south. To go to the root cause of that empirical finding, at least two hypotheses can be put forward. Firstly, the geoclimatic data may not tell the whole story, since during the winter a not negligible share of the solar radiation is lost in the Po Valley due to the recurrent presence of dense and persistent fog. Secondly, the propensity to adopt PV systems in Alto Adige may be ascribed to the influence of the neighboring Austria, where the government subsidies have started earlier.
The second hypothesis paves the way to the main aim of this study, which is to check whether the deployment of PV capacity is driven by
neighborhood effects, that is to say, whether the phenomenon is bolstered by emulation. The relationship between the installed capacity in each municipality and the corresponding installed capacity in the adjoining townships is positive and high. Therefore, if we aim to understand the deployment of the PV capacity and generation in a territory, then we should consider not only geoclimatic and socio-economic factors of that same territory, but also what happens with regard to the adoption of PV systems in the surroundings.
5 CONCLUSIONS
In this follow-up study, we analyze data encoded at
Spatial Dependence of Solar Photovoltaic Systems: Data Gathering Process, Related Issues and Preliminary Results
the municipal level, hence disaggregated at level 2 of the European LAU (Local administrative units) classification. Here we find new empirical evidence of the spatial dependence characterizing the deployment of PV capacity and generation, confirming our previous findings and the claims of the few studies that have so far looked at this promising research strand. We may conclude that some energy-related behavior, signally those concerning the adoption of renewable energy sources, spread themselves across the space due to phenomena of emulation between neighbors and peers that can be caught and expressed according to proximity measures.
However, further developments are required: by enlarging the dataset in order to include additional variables, by testing other proximity measures, and by defining not only spatial but also spatio-temporal regression models.
ACKNOWLEDGEMENTS
Statistical analysis is performed using the packages R v. 3.3.2 and gretl v. 2017b. Spatial data representation is made using the software QGis v. 2.14.9.
REFERENCES
Anselin, L, 1988. Spatial econometrics: methods and
models. Dordrecht: Springer Kluwer.
Balcombe, P., Rigby, D., Azapagic, A., 2013. Motivations and barriers associated with adopting microgeneration energy technologies in the UK. Renewable and
Sustainable Energy Reviews, 22, pp.655–666.
Balta-Ozkan, N., Yildirim, J., Connor, P. M., 2015. Regional distribution of photovoltaic deployment in the UK and its determinants: A spatial econometric approach. Energy Economics, 51, pp.417–429. Bollinger, B., Gillingham, K., 2012. Peer Effects in the
Diffusion of Solar Photovoltaic Panels. Marketing
Science, 31(6), pp.900–912.
Copiello, S., 2017. Building energy efficiency: A research branch made of paradoxes. Renewable and
Sustainable Energy Reviews, 69, pp.1064–1076.
Copiello, S. Grillenzoni, C., 2017a. Is the cold the only reason why we heat our homes? Empirical evidence from spatial series data. Applied Energy, 193, pp.491– 506.
Copiello, S., Grillenzoni, C., 2017b. Solar photovoltaic energy and its spatial dependence Energy Procedia, 141, pp. 86–90.
Dharshing, S., 2017. Household dynamics of technology adoption: A spatial econometric analysis of residential
solar photovoltaic (PV) systems in Germany. Energy
Research & Social Science, 23, pp.113–124.
Graziano, M., Gillingham, K., 2015. Spatial patterns of solar photovoltaic system adoption: The influence of neighbors and the built environment. Journal of
Economic Geography, 15(4), pp.815–839.
Keller, W., 2002. Geographic localization of international technology diffusion. American Economic Review, 92(1), pp.120–142.
Müller, S., Rode, J., 2013. The adoption of photovoltaic systems in Wiesbaden, Germany. Economics of
Innovation and New Technology, 22(5), pp.519–535.
Palm, A., 2016. Local factors driving the diffusion of solar photovoltaics in Sweden: A case study of five municipalities in an early market. Energy Research
and Social Science, 14, pp.1–12.
Palmer, J., Sorda, G., Madlener, R., 2015. Modeling the diffusion of residential photovoltaic systems in Italy: An agent-based simulation. Technological Forecasting
and Social Change, 99, 106–131.
Rode, J., Weber, A., 2016. Does localized imitation drive technology adoption? A case study on rooftop photovoltaic systems in Germany. Journal of
Environmental Economics and Management, 78,
pp.38–48.
Sardianou, E., Genoudi, P., 2013. Which factors affect the willingness of consumers to adopt renewable energies?
Renewable Energy, 57, pp.1–4.
Schaffer, A. J., Brun, S., 2015. Beyond the sun— Socioeconomic drivers of the adoption of small-scale photovoltaic installations in Germany. Energy
Research & Social Science, 10, pp.220–227.
Schelly, C., 2014. Residential solar electricity adoption: What motivates, and what matters? A case study of early adopters. Energy Research and Social Science, 2, pp.183–191.
Sommerfeld, J., Buys, L., Mengersen, K., Vine, D., 2017. Influence of demographic variables on uptake of domestic solar photovoltaic technology. Renewable
and Sustainable Energy Reviews, 67, pp.315–323.
Tobler, A.W.R., 1970. A Computer Movie Simulating Urban Growth in the Detroit Region. Economic
Geography, 46, pp.234–240.
Vasseur, V., Kemp, R., 2015. The adoption of PV in the Netherlands: A statistical analysis of adoption factors.
Renewable and Sustainable Energy Reviews, 41,
pp.483–494.
Zhao, T., Zhou, Z., Zhang, Y., Ling, P., Tian, Y., 2017. Spatio - temporal analysis and forecasting of distributed PV systems diffusion : A case study of Shanghai using a data - driven approach. IEEE Access, 5, pp.5135–5148.
A
UTHOR
I
NDEX
Acquaviva, A. . . 44, 262 Aiello, M. . . 23 Albayrak, S. . . 108 Aliberti, A. . . 44 Andújar-Montoya, M. . . 206 Arning, K. . . 34, 325 Arshad, N. . . 101 Aslam, T. . . 101 Bardow, A. . . 34 Basso, G. . . 70 Beigl, M. . . 89 Bindner, H. . . 199 Bollin, E. . . 54 Bongaerts, M. . . 120 Bottaccioli, L. . . 44, 262 Bremser, C. . . 157 Brettschneider, D. . . 182 Calderaro, V. . . 238 Chen, G-W. . . .64 Cirrincione, G. . . 44 Cobben, S. . . 120 Copiello, S. . . 15 Costa, G. . . 165 Dang-Nguyen, D-T. . . 254 Debray, F. . . 214 Delinchant, B. . . 214 Dongol, D. . . 54 Donnellan, B. . . .294 Donno, M. . . 173 Feldmann, T. . . 54 Frere, M. . . 311 Gabioud, D. . . 70 Galatoulas, F. . . 278, 311 Galdi, V. . . 238 Georgievski, I. . . 23 Giannotti, M. . . 143 Gibescu, M. . . 120 Gilart-Iglesias, V. . . 206 Goeller, T. . . 231 Gomes, J. . . 270 González, R. . . 120 Graber, G. . . 238 Guerard, G. . . 223 Hamida, A. . . 78 Hasebe, K. . . 352 Helfert, M. . . .157, 254 Hölker, D. . . 182 Ioakimidis, C. . . 278, 311 Janßen, J. . . .89 Kalksma, M. . . .23 Kanashiro, L. . . 143 Karatzoglou, A. . . 89 Kato, K. . . .352 Kesavulu, M. . . 254 Kloibhofer, S. . . 286 Kon, F. . . 143 Lamberti, F. . . 238 Laurent, P. . . 344 Leite, A. . . 78 Levy, L-N. . . 223 Lin, H-W. . . 64 Linzenich, A. . . 190 Macii, E. . . 44, 262 Maekawa, J. . . 320 Mantyneva, M. . . 151 Maréchal, Y. . . 214 Mayer, H. . . 304 McLoughlin, S. . . 294 Mohammed, A. . . 337 Mora, H. . . 206 Morriet, L. . . 214 Mziou-Sallami, M. . . 78 Nakone, B. . . 337 Nebel, W. . . 246 Nes-Koedam, M. . . 120 Neto, M. . . 270 O’Flynn, B. . . 173 Pajot, C. . . 214 Patti, E. . . 44, 262 Pérez-delHoyo, R. . . 206 Petersen, B. . . 199 Piccolo, A. . . 238 Pieper, C. . . 246 Pierson, J-M. . . 165 Piller, G. . . 157 Plank-Wiedenbeck, U. . . 9 Porter, R. . . .278 Poulsen, B. . . 199 Pourzolfaghar, Z. . . 157 Pousseur, H. . . 223 Pratama, A. . . 23 Prendergast, D. . . 7, 294 Rego, J. . . 270 Roduit, P. . . .70 Ruohomaa, H. . . 151 Saidu, I. . . 337 Santana, E. . . 143 Sawall, H. . . 130 Scheuriker, A. . . 130 Schlitt, D. . . 246 Schmidt, J. . . 231 Schneider, S. . . 344 Setz, B. . . 23 Shimada, K. . . 320 Sirdey, R. . . 78 Sotelo, M. . . 5 Srikanthan, V. . . .89 Stan, O. . . 78 Sternberg, A. . . 34 Stetter, D. . . 130 Stifter, M. . . 286 Takai, S. . . 352 Tan, Y. . . 64 Tanimu, S. . . 337 Thiam, C. . . 165 Tomasiello, D. . . 143 Tönjes, R. . . 182 Übermasser, S. . . .286 Urbaczek, C. . . 89 Vermeiden, W. . . 120 Vincent, B. . . 214 Voß, M. . . 108 Weihs, P. . . 286 Wenninger, M. . . 231 Wilhelm, M. . . 108 Wu, M-D. . . 64 Wurtz, F. . . 214 You, S. . . 199 Zaunbrecher, B. . . 34, 325 Zayani, M-H. . . 78 Zelger, T. . . .344 Ziefle, M. . . 34, 190, 325Proceedings of SMARTGREENS 2018
7th International Conference on Smart Cities and Green ICT Systems
http://www.smartgreens.org/
Copyright © 2018 by SCITEPRESS - Science and Technology Publications, Lda. All Rights Reserved ISBN: 978-989-758-292-9
PROCEEDINGS WILL BE SUBMITTED FOR INDEXATION BY LOGISTICS PARTNER EVENT MANAGEMENT SYSTEM
by SCITESOFT IN COOPERATION WITH