2016
Publication Year
2020-05-07T13:06:15Z
Acceptance in OA@INAF
ALMA-SZ Detection of a Galaxy Cluster Merger Shock at Half the Age of the
Universe
Title
Basu, K.; Sommer, M.; Erler, J.; Eckert, D.; VAZZA, FRANCO; et al.
Authors
10.3847/2041-8205/829/2/L23
DOI
http://hdl.handle.net/20.500.12386/24595
Handle
THE ASTROPHYSICAL JOURNAL LETTERS
Journal
829
Mach number as well as the relic magneticfield. We employ a Bayesian analysis technique for modeling the SZ and X-ray data self-consistently, illustrating respective parameter degeneracies. Combined results indicate a shock with Mach number =2.4-+0.6
1.3
, which in turn suggests a high value of the magnetic field (of the order of 4–10 mG) to account for the observed relic width at 2 GHz. At roughly half the current age of the universe, this is the highest-redshift direct detection of a cluster shock to date, and one of the first instances of an ALMA-SZ observation in a galaxy cluster. It shows the tremendous potential for future ALMA-SZ observations to detect merger shocks and other cluster substructures out to the highest redshifts.
Key words: galaxies: clusters: individual(ACT-CL J0102 4915) – galaxies: clusters: intracluster medium
1. INTRODUCTION
Intergalactic shocks created by galaxy cluster mergers are among the most spectacular events in the structure formation history of the universe. They raise the thermal energy of the intracluster medium to the keV range and also accelerate a population of seed electrons to relativistic energies (e.g., Sarazin et al. 2002; Brüggen et al.2012). These GeV energy electrons are believed to be responsible for producing the megaparsec-scale diffuse synchrotron sources known as radio relics (Enßlin et al. 1998; Nuza et al. 2012; Skillman et al. 2013). While the connection between merger shocks and the non-thermal relic emission has been established in the low-redshift universe through X-ray observations (e.g., Fino-guenov et al. 2010; Akamatsu & Kawahara 2013), at high redshifts it becomes extremely difficult due to the dimming of the X-ray signal. In this regard, the Sunyaev–Zel’dovich (SZ) effect(Sunyaev & Zel’dovich1972) can be an ideal alternative since its brightness is redshift independent, opening a new window for observing cluster shocks across the visible universe. Thefirst use of the SZ effect to model a relic shock was done recently for the Coma cluster using Planckdata (Erler et al.2015). In this Letter, we present the first SZ result from ALMA for a merger shock in the famous El Gordo cluster.
The galaxy cluster ACT-CL J0102−4915 at z=0.87, nicknamed “El Gordo,” is the most massive high-redshift cluster known and was the most significant SZ detection in the ACT survey from where it was discovered (Menanteau et al. 2010; Marriage et al. 2011). Menanteau et al. (2012, hereafterM12) described the merging nature of this cluster in a multi-wavelength analysis, and Lindner et al. (2014, hereafter L14) presented its non-thermal environment from GMRT and ATCA data, discovering a giant radio halo and a set of peripheral radio relics. These are the highest-redshift radio halo and relics known and are among the most luminous. Our ALMA observation targeted the prominent NW relic with
a 3 hr exposure at 100 GHz, detecting the sign of an underlying pressure discontinuity.
The presence of a shock at El Gordo’s NW relic location is already hinted at by the observation of a radio spectral index gradient, from which L14 derived a shock Mach number = 2.5-+0.30.7. Recently, Botteon et al. (2016) reported on modeling the same 360 ks Chandraarchival data that we use in this Letter, inferring a strong shock( 3) from a brightness discontinuity measurement. However, X-ray brightness edges can also be the result of cold fronts that can extend to the cluster outskirts in large-scale gas sloshing (e.g., Rossetti et al.2013). Measuring a pressure discontinuity through the SZ effect, on the other hand, provides an unequivocal case for a shock. Accurate shock Mach number determination also helps to infer the infall velocities of the merging subclusters, and such velocity tests are a critical tool in examining current cosmological models, particularly with high-z systems like El Gordo(e.g., Lee & Komatsu2010; Katz et al.2013; Molnar & Broadhurst2015). This makes ALMA, with its superb angular resolution and sensitivity, as one of the forefront instruments for probing cluster astrophysics and cosmology through SZ shock modeling.
This Letter presents a concise description of the multi-wavelength data and their analysis methods(Section2), results for this highest-redshift shock (Section 3), and a summary (Section 4). More details on the SZ and X-ray analysis, supplemented by upcoming ALMA Compact Array data, will be presented in a future paper. We use ΛCDM cosmology parameters W = 0.27m , W =L 0.73, andH0=70km s−1Mpc−1 (Hinshaw et al. 2013); thus, ¢1 corresponds to 471 kpc at El Gordo’s redshift. Parameter values are quoted with 68% credible intervals, unless otherwise noted.
2. DATA AND ANALYSIS METHODS
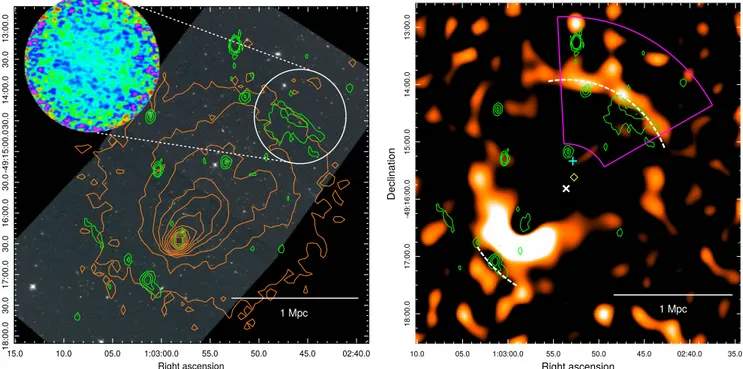
Figure 1 gives an overview of the X-ray and radio data available for the El Gordo cluster and puts our ALMA
observation into perspective. The left panel shows an RGB-color image made from two Hubble Space Telescope (HST) pointings spanning the NW–SE direction, overlaid with the 0.5 2 keV– X-ray(orange) and 2.1 GHz radio (green) contours. Thefield of view of ALMA at 100 GHz is marked by the white circle (primary beam FWHM ~ ¢1). In the right panel, an unsharp-masked (“edge-detected”) X-ray image, created from differencing two images smoothed by s = 25 and s = 8. 5 resolutions, describes the shock geometry. There is a large(∼1 Mpc length) arc-like shock feature in the NW direction that extends well beyond the relic region (see also M12). Two opposing radio relics in the NW and SE directions suggest a
merger in the plane of the sky along their common axis(L14; Ng et al.2015). We take the midpoint of these arcs, at R.A., decl. = [15°.723, −49°.264], as the center of our spherical shock model(marked by a white “×”). The shock radius, here the same as its radius of curvature, isfitted individually from each data set.
2.1. ATCA 2.1 GHz Radio Data
The radio data analysis is described inL14; we use a high-resolution total intensity image made from the ATCA 2.1 GHz observation. The effective resolution is 6. 1 ´ 3. 1, making the relic sufficiently resolved in the direction of shock propagation
Figure 1. Multi-wavelength view of the El Gordo cluster and its NW relic. Left: a color-composite image made from two HST/ACS pointings, overlaid with contours from the soft-band Chandra (orange) and the 2.1 GHz ATCA radio continuum (green) data. The white circle marks the region imaged by ALMA, with a zoomed-out inset showing theflux distribution as obtained from imaging the ALMA data (see Figure2for scales). Right: an unsharp-masked image of the X-ray brightness in
color, highlighting an arc-like shock front extended well beyond the radio synchrotron emission(green contours). The magenta sector marks the area used for the main X-ray analysis. White-dashed arcs mark the tentative shock fronts, whose center is the white“×” in the middle defining the center of our shock model. The blue “+” is the ACT-SZ centroid(Marriage et al.2011), and the yellow “à” is the weak-lensing center of mass (Jee et al.2014).
Figure 2. Real and simulated ALMA observations. From left: direct deconvolved or “dirty” image made from the real ALMA data (a), and a simulation with negligible noise for a = 2 shock to highlight the ripple-like signal(b). The radio relic contours at 2.1 GHz are shown for reference. Right: results for model fitting from mock ALMA observations with realistic noise, for a = 1(no shock), 2, or 4 shock in a massive El Gordo–like cluster. Contours define the 95% posterior regions, and the input values are indicated by the stars. ALMA interferometric observation is insensitive to any large-scale SZ signal and detects primarily the pressure difference(Dp) across the shock.
tofit a radial brightness profile. We use a lognormal emissivity model(Basu et al.2016) that is projected from a 3D cone and smoothed to the ATCA resolution. Thefit is shown in Figure3 (top panel), where the error bar (bottom right) represents the noise at the phase center.
2.2. Chandra X-Ray Data
We use archival Chandradata for El Gordo totaling 360 ks of observation (ObsID: 12258, 14022, 14023). The data are reduced with the CIAO software (CALDB 4.7.1) to produce calibrated image and background files from each ObsID individually and then are added together weighted by the respective exposures. We define a “shock-cone” that encom-passes the entire arc-like shock feature, between 26 and 94 angles (magenta sector in Figure 1, right), to maximize the
particularly disturbed, as M12 has pointed out a low-density “wake” in this direction. To keep our spherical projection approximately valid, we limit the fit to 400 kpc downstream. Spectralfitting was done in the 0.5 7 keV– range using a single-temperature model.
2.3. ALMA-SZ Data
The relic was observed by the ALMA main array in Cycle 3 during 2015 December, employing thirty-five 12 m antennas in the most compact configuration (2015.1.01187.S; PI: K. Basu). Four continuum bands were centered at 93, 95, 105, and 107 GHz, covering a total 7.5 GHz bandwidth. Total duration of the observation was 5.2 hr, which after calibration yielded roughly 3 hr of on-source data. We used the calibrated data products obtained with the CASA software as provided by the ALMA project, with a few additionalflaggings. Imaging using CLEAN with natural weighting resulted in a noise rms of 6μJy/beam at the phase center, for a synthesized beam size of
´
3. 6 2. 7 (P.A. 88). There is no evidence for point-like sources in the ALMA image.
A CLEAN image example is shown in the Figure1 inset, and a direct deconvolved image (“dirty image”) in Figure 2 (left panel); the difference is negligible due to the low S/N. These images are shown only for illustration; we do not use any imaging product for the shock modeling, ratherfit our model directly to the ALMA uv-data after Fourier transforming and de-gridding it into the visibility plane. This is done using an MCMC method within CASA and is computationally expen-sive, due to the large data volume. The 93 107 GHz– SZ spectrum is computed with relativistic corrections (Itoh & Nozawa2004) due to the high post-shock temperatures.
The uv-fitting method safeguards against possible biases that can occur when imaging a diffuse, low S/N negative signal like a cluster shock in SZ. We make extensive simulations for mock ALMA observations, and some results are shown in Figure2. The middle panel is a dirty image from a practically noiseless simulation, highlighting the ripple-like intensity pattern which is a deconvolution artifact (see also Figure 3, bottom panel). Figure2(right) shows fit results for realistic noise, simulating a = 1, 2, or 4 shock model on a massive El Gordo–like cluster. The noise is obtained from randomizing the phases in individual scans. In the =1 case(no shock), ALMA filters out the entire large-scale SZ signal from the cluster, and the measurement is consistent with noise. For a weak shock ( = 2) ALMA clearly detects a pressure discontinuity, but its amplitude is anti-correlated with the pressure normalization. This is an inherent limitation of the current ALMA observation
Figure 3. Thermal and non-thermal signal variations across the relic shock. From top: radio synchrotron emission at 2.1 GHz, X-ray temperature measurements from the Chandra 0.5 7 keV– data, X-ray surface brightness in the 0.5 2 keV– band, and the SZflux modulation at 100 GHz as observed by ALMA. The green lines show the respective best-fit theoretical models, and the red dotted–dashed lines are the observed profiles after beam smoothing (radio) or image deconvolution(SZ). The X-ray temperature lower limit is at the 90% confidence level, and the blue dotted line in the third panel marks the mean X-ray background. The vertical gray line is the best-fit shock location derived from the SZ data.
(“short-spacing” problem). With higher -values the S/N improves, lowering the uncertainties but not removing this degeneracy.
To fit the shock, we choose a spherical GNFW pressure model for the cluster (Nagai et al.2007; Arnaud et al. 2010), adding a pressure boost at the shock radius from the R-H condition, as pdown pup GNFW( ) =(52 -1 4) . The down-stream and updown-stream slopes are taken to be consistent with the X-ray results, leaving the pressure amplitude, shock radius, and the Mach number as free parameters. Since X-ray data indicate a shallow upstream density profile (Section 3.2), we choose GNFW model parameters with a shallow outer pressure slope (Sayers et al. 2013) and marginalize its value within 30% uncertainty. The small field of view of ALMA makes our modeling insensitive to any parameter choice that regulates the pressure profile shape far away from the shock.
3. RESULTS AND DISCUSSION
Figure3is a summary of our multi-wavelength analysis, in a first modeling of the radio synchrotron, X-ray temperature and brightness, and the thermal SZ effect signal across a cluster shock. Even with a deep (∼100 hr) Chandraobservation, the pre-shock temperature in this high-z object remains uncon-strained due to the high background-to-cluster photon ratio. The X-ray background level is shown by the blue dotted line in the third panel. In the bottom panel, the observed SZ signal is the ripple-like feature (red dotted–dashed line), also seen in Figure2.
3.1. SZ Shock Modeling
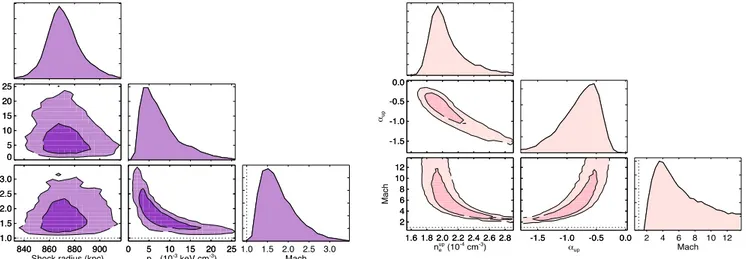
An SZ fit result example, based on the GNFW+shock pressure model, is shown in Figure 4 (left panel). The high angular resolution of ALMA constrains the shock radius to good accuracy at rsh=870-+1314 kpc. This value is uncorrelated with other model parameters, and the uncertainty roughly corresponds to the effective size of the ALMA synthesized beam, approximately 3. 5 (27.5 kpc) in FWHM. There is a strong anti-correlation between the Mach number and the upstream pressure amplitude, which results from the unconstrained
normalization. SZ data alone prefer a weak shock, with a large uncertainty range for the Mach number: =1.4-+0.21.2, support-ing >1 at more than 98% confidence. Putting a weak-lensing prior on the total mass (M500,c=1.800.34´
M
1015 ; Jee et al. 2014) partially breaks this degeneracy and reduces the errors to =1.5-+0.20.5 (shown in the figure). However, for a merging cluster like El Gordo a global mass prior will be inaccurate for modeling the pressure in a disturbed sector, so we derive a pressure prior from the X-ray data.
3.2. X-Ray Shock Modeling
X-ray brightness modeling supports a strong shock( ~ 4) propagating outward in a low-density region where the pre-shock medium has a shallow density slope(~r-0.6). Parameters are shown in Figure 4 (right panel); the Mach number is strongly degenerate with the amplitude and the slope of the pre-shock density due to the noisy upstream data. Moreover, the insensitivity of a density ratio measurement for 4 shocks adds to the degeneracy. X-ray data alone prefer a smaller shock radius, at854-+13
11
kpc, consistent with the SZ result but in mild tension with the radio(Section3.4). Marginalizing over a 5% background calibration error and placing an SZ prior on the shock radius, we obtain a Mach number3.5-+1.3
6.4, downstream slope -1.2-+0.10.1, upstream slope -0.6-+0.40.2, and upstream density at the shock radius 1.9-+0.2´10
-0.3 4 cm−3. Fixing the back-ground(i.e., no systematics) prefers a shallower upstream slope and hence biases the Mach number to be high. Possible inverse Compton(IC) emission in the post-shock region at this redshift can also cause a high-Mach bias. Both downstream and upstream brightness data show hints of substructures(Figure3), giving a poor fit with the broken power law model and suggesting a possible clumpy medium.
Preceding X-ray results are obtained within the full ~70 shock-cone, and results from the relic-cone and its comple-mentary sector are consistent. Both show evidence for a shock, with =2.9-+0.9
7.8
and =2.3-+0.8 3.0
, respectively. This is the first evidence of a cluster merger shock clearly extending beyond its synchrotron emitting region. A possible explanation for this asymmetry could be the presence of an AGN-like
Figure 4. SZ and X-ray modeling results, showing the 68% and 95% posterior probabilities (darker and lighter contours) and the marginalized parameter values. Left: results obtained from the ALMA-SZ data, with a prior on the GNFW pressure normalization based on El Gordo’s mass (Section3.1). The shock location is
well-constrained, but the shock Mach number is highly anti-correlated with the upstream pressure amplitude(pup). Right: results from the ChandraX-ray brightness modeling, using an SZ prior on the shock location and a 5% error on the background. Both the pre-shock gas density(neup) and its power-law slope (aup) have strong non-zero correlation with the Mach number.
source in the relic, unresolved in the ATCA image(significance below 3s), that is seeding only part of the shock with relativistic electrons and magneticfields.
3.3. Joint SZ/X-Ray Modeling
To better constrain the SZ shock Mach number, we use a pressure prior assuming the upstream X-ray density and temperature measurements are independent. Since the upstream TX has no effective upper bound, we scale from the
downstream TXvalue using the Mach number in a chain, from
the R-H condition for temperature jump. The post-shock
lensing based mass estimates for El Gordo. Combined results thus point toward a stronger shock, with =2.4-+0.61.3 (Figure 5, top panel inset), very similar to the radio measurement of L14 based on the theory of diffusive shock acceleration(Blandford & Eichler1987; Kang et al.2012).
3.4. Radio Modeling and the Relic B-field
From the Mach number and the upstream gas temperature one can estimate the relic magneticfield, assuming the relic’s width to be roughly equal to the product of the velocity and the radiative lifetime of the non-thermal electrons(see van Weeren et al.2010;L14). The high-resolution radio image enables us to model a deprojected synchrotron emissivity profile, shown in Figure5 (bottom panel). The fit suggests a narrow lognormal shape, with best-fit parameters m s =[ , ] [2.1, 0.9] kpc (see Basu et al.2016, Equation(9)) and a shock radius 882 kpc that is consistent with the SZ measurement. The observed broad-ening (Figure 3, top panel) comes from the projection of a 560 kpc diameter relic surface. The three-dimensional width of the relic is∼15 kpc (at half peak-maximum), to maintain which one would require a high value of the field strength, of the order of4 10 G– m (Figure 5, bottom panel inset).
Such strongfields at such low density are extremely difficult to justify if they result from the amplification of primordial seed fields. Indeed, even in the presence of a well-developed dynamo, the typical field strength in this environment is expected to be at most a few μG (e.g., Vazza et al. 2015, Figure 2). The restricted time available for dynamo amplifica-tion at this high redshift exacerbates the problem. Alternatively, part of the observed width might be caused by a turbulent re-acceleration of electrons in the downstream region (Fujita et al. 2015) that coincides with the location of El Gordo’s radio halo, or by small-scale dynamo amplification of the downstream magneticfields (Donnert et al.2016).
4. CONCLUSIONS
We present one of thefirst ALMA measurements of the SZ effect, detecting a shock feature in the famous El Gordo cluster at z=0.87. The shock is coincident with the location of a prominent radio relic and count as the highest redshift confirmed detection of a merger shock. Besides the ALMA-SZ data, we also analyze archival ChandraX-ray data and an ATCA 2.1 GHz radio image to present a self-consistent picture of the thermal and non-thermal signal variation across the shock front. SZ and X-ray data are modeled using a Bayesian technique that illustrates respective parameter degeneracies and
Figure 5. Constraints on the shock Mach number and the relic magnetic field. Top: posterior probabilities for the Mach number and cluster mass/pre-shock pressure: the green contours are from ALMA-SZ modeling only, and the yellow ones are after using an X-ray pressure prior. Darker and lighter colors mark the 68% and 95% credible regions. The inset figure shows the marginalized Mach number distributions. Bottom: estimation of the relic magnetic field based on its 2.1 GHz width. The solid line shows the deprojected synchrotron emissivity profile, and the two horizontal bands mark the maximum relic width at 68%(dark gray) and 95% (light gray) confidence as expected from the radiative lifetime of the accelerated electrons. These limits come from the insetfigure, where we show the relic width as a function of the magnetic field strength, using gas temperature and Mach number ranges derived from the joint SZ/X-ray modeling. Same curve for the nearby Sausage relic is shown for comparison(van Weeren et al.2010).
show how the ALMA measurement of the shock Mach number can improve from an overall normalization of the SZ signal. A future paper will present new ALMA Compact Array data for this purpose along with more details on our multi-wavelength analysis.
ALMA data alone provide evidence for a shock at more than 98% confidence from the measurements of an underlying pressure discontinuity. However, the Mach number can be constrained only within a wide range, =1.4-+0.2
1.2
. A joint SZ/X-ray modeling gives preference for a stronger shock, with =2.4-+0.61.3. Fitting the observed relic width with a synchrotron emissivity model indicates a magnetic field strength of the order of 4 10 G– m inside the relic, which is unexpectedly high for this redshift.
These results make use of a relatively short ALMA measurement (3 hr on-source), demonstrating the tremendous potential of future ALMA-SZ observations to model cluster astrophysics from shocks and other substructures.
We acknowledge R. Lindner and A. Baker for providing the ATCA radio image, F. Pacaud for an X-ray analysis, T. Erben for an HST color image, and C. Porciani and R. Sunyaev for discussions. We thank the anonymous referee for a positive and helpful report. Financial support from the Deutsche For-schungsgemeinschaft(DFG) was received through the follow-ing programs and grants: M.S., F.B. (TRR33); J.E., F.B. (SFB956); B.M. (SPP1573) and F.V. (VA876/3-1). This Letter makes use of the following ALMA data: ADS/JAO. ALMA#2015.1.01187.S. ALMA is a partnership of ESO (representing its member states), NSF (USA) and NINS (Japan), together with NRC (Canada), NSC and ASIAA (Taiwan), and KASI (Republic of Korea), in cooperation with the Republic of Chile. The Joint ALMA Observatory is operated by ESO, AUI/NRAO and NAOJ. This ALMA project was supported by the German ARC node.
Facilities: ALMA, CXO, ATCA.
REFERENCES
Akamatsu, H., & Kawahara, H. 2013,PASJ,65, 16
Arnaud, M., Pratt, G. W., Piffaretti, R., et al. 2010,A&A,517, A92
Basu, K., Vazza, F., Erler, J., & Sommer, M. 2016,A&A,591, A142
Blandford, R., & Eichler, D. 1987,PhR,154, 1
Botteon, A., Gastaldello, F., Brunetti, G., & Kale, R. 2016, MNRAS, 463, 1534
Brüggen, M., Bykov, A., Ryu, D., & Röttgering, H. 2012,SSRv,166, 187
Donnert, J., Stroe, A., Brunetti, G., Hoang, D., & Röttgering, H. 2016, MNRAS,462, 2014
Eckert, D., Jauzac, M., Vazza, F., et al. 2016,MNRAS,461, 1302
Enßlin, T. A., Biermann, P. L., Klein, U., & Kohle, S. 1998, A&A,332, 395
Erler, J., Basu, K., Trasatti, M., Klein, U., & Bertoldi, F. 2015,MNRAS,
447, 2497
Finoguenov, A., Sarazin, C. L., Nakazawa, K., Wik, D. R., & Clarke, T. E. 2010,ApJ,715, 1143
Fujita, Y., Takizawa, M., Yamazaki, R., Akamatsu, H., & Ohno, H. 2015,ApJ,
815, 116
Hinshaw, G., Larson, D., Komatsu, E., et al. 2013,ApJS,208, 19
Itoh, N., & Nozawa, S. 2004,A&A,417, 827
Jee, M. J., Hughes, J. P., Menanteau, F., et al. 2014,ApJ,785, 20
Kang, H., Ryu, D., & Jones, T. W. 2012,ApJ,756, 97
Katz, H., McGaugh, S., Teuben, P., & Angus, G. W. 2013,ApJ,772, 10
Lee, J., & Komatsu, E. 2010,ApJ,718, 60
Lindner, R. R., Baker, A. J., Hughes, J. P., et al. 2014,ApJ,786, 49
Markevitch, M. 2006, in ESA Special Publication, Vol. 604, The X-Ray Universe 2005, ed. A. Wilson(ESA SP-604; Noordwijk: ESA),723
Marriage, T. A., Acquaviva, V., Ade, P. A. R., et al. 2011,ApJ,737, 61
Menanteau, F., Gonzaĺez, J., Juin, J.-B., et al. 2010,ApJ,723, 1523
Menanteau, F., Hughes, J. P., Sifón, C., et al. 2012,ApJ,748, 7
Molnar, S. M., & Broadhurst, T. 2015,ApJ,800, 37
Nagai, D., Kravtsov, A. V., & Vikhlinin, A. 2007,ApJ,668, 1
Ng, K. Y., Dawson, W. A., Wittman, D., et al. 2015,MNRAS,453, 1531
Nuza, S. E., Hoeft, M., van Weeren, R. J., Gottlöber, S., & Yepes, G. 2012, MNRAS,420, 2006
Rossetti, M., Eckert, D., De Grandi, S., et al. 2013,A&A,556, A44
Sarazin, C. L. 2002, in Merging Processes in Galaxy Clusters, ed. L. Feretti, I. M. Gioia, & G. Giovannini(Dordrecht: Kluwer Academic),138
Sayers, J., Czakon, N. G., Mantz, A., et al. 2013,ApJ,768, 177
Skillman, S. W., Xu, H., Hallman, E. J., et al. 2013,ApJ,765, 21
Sunyaev, R. A., & Zel’dovich, Y. B. 1972, CoASP,4, 173
van Weeren, R. J., Röttgering, H. J. A., Brüggen, M., & Hoeft, M. 2010,Sci,
330, 347
Vazza, F., Ferrari, C., Brüggen, M., et al. 2015,A&A,580, A119