S
pecial
R
epoRt
t
echnology
R
epoRt
Novel sensitive, specific and rapid pharmacogenomic
test for the prediction of abacavir hypersensitivity
reaction: HLA-B*57:01 detection by real-time PCR
Abacavir (ABC) is a nucleoside reverse transcrip-tase inhibitor used as part of combination anti-retroviral therapy in HIV-infected patients [1]. It
has been extensively evaluated in clinical studies and is currently recommended as a preferred or an alternative nucleoside reverse transcriptase inhibitor in antiretroviral-naive patients accord-ing to international HIV guidelines [101]. It is
generally a very well-tolerated drug, even though an increased risk of myocardial infarction in patients exposed to ABC within the preceding 6 months has been recently reported [2], but not
confirmed by other studies [3]. The major
rea-son for early discontinuation of ABC remains the occurrence of an immunologically mediated hypersensitivity reaction (HSR) [4]. ABC-HSR
has been observed in 5–8% of treated patients, appears within the first 6 weeks of therapy and requires an immediate and permanent dis-continuation of the drug [5]. A strong
associa-tion between the ABC-HSR and MHC class I allele HLA-B*57:01 (locus position 6p21.3 and OMIM: 142830) has been observed in Caucasian HIV-infected patients [6,7]. Subsequently, skin
patch testing demonstrated the presence of such an association across racial and geographic pop-ulations [8,9]. Finally, a powered, double-blind,
prospective, randomized study (Prospective Randomized Evaluation of DNA Screening in
a Clinical Trial [PREDICT-1]) demonstrated the clinical utility of HLA-B*57:01 screening in reducing ABC-HSR in HIV-infected patients. HSR was clinically diagnosed in 93 patients from a total of 1650 patients, with a signifi-cantly lower incidence (3.4%) in the prospec-tive screening group than in the control group (7.8%; p < 0.001). Interestingly, HLA-B*57:01 screening eliminated immunologically con-firmed HSR, with a negative predictive value of 100% [9]. Therefore, international HIV
treat-ment guidelines now recommend HLA-B*57:01 typing before ABC administration, in order to reduce the incidence of ABC hypersensitiv-ity [10,11,101]; while the screening is also part of
the license of ABC-containing products. Different technologies are available to detect individual HLA types that are routinely used for the characterization of tissue compatibility during organ transplantation, such as DNA sequence-based typing or the sequence-spe-cific oligo nucleotide probe method with addi-tional DNA sequencing for patients screened as positive with the probes. However, these approaches are time-consuming, expensive and not readily available [12]. An alternative
method has been developed by Mallal’s group, based on the identification of the HLA-B*57:01 allele by sequence-specific primer (SSP) by
Aim: International HIV treatment guidelines recommend HLA-B*57:01 typing before abacavir
administration, in order to reduce the incidence of abacavir hypersensitivity reactions, the major cause of early therapy discontinuation. A fast, sensitive and specific test for HLA-B*57:01 detection has been developed in the present study. Materials & methods: Two sets of sequence-specific primers were designed, and amplification rapidly detected by real-time PCR. Results: A total of 108 samples were analyzed in a single-blind fashion, and 41 samples were identified as positive. Complete agreement, with k = 1 (standard error = 0.0962, p < 0.0001), was found, with a validated methodology used in the EPI109367 clinical trial funded by GlaxoSmithKline, and consisting of low-resolution sequence-specific oligonucleotide PCR, followed by high-resolution sequence-specific oligonucleotide PCR carried out on the HLA-B*57-positive samples. Conclusion: We provided a detailed characterization of a novel HLA-B*57:01 screening test, which can be easily implemented by those laboratories already involved in the detection of viral load and virus genotyping.
Original submitted 26 October 2010; Revision submitted 13 December 2010. KEYWORDS: abacavir n HIV-1 n HLA-B*57:01 n hypersensitivity reaction n pharmacogenomic test n real-time PCR
Cinzia Dello Russo†1,
Lucia Lisi1, Alessia
Lofaro1, Simona Di
Giambenedetto2,
Bruno Federico3,
Giordano Madeddu4,
Marianna Salerno4,
Maria Stella Mura4,
Antonella Pirazzoli5,
Andrea de Luca2,6,
Roberto Cauda2
& Pierluigi Navarra1
1Institute of Pharmacology, Catholic
University Medical School, Rome, Italy
2Institute of Clinical Infectious Diseases,
Catholic University Medical School, Rome, Italy
3Department of Health & Sport
Sciences, University of Cassino, Cassino (FR), Italy
4Department of Infectious Diseases,
University of Sassari, Sassari, Italy
5ViiV Healthcare, Verona, Italy 6Infectious Diseases Unit, University
Hospital, Siena, Italy
†Author for correspondence:
Tel.: +39 063 015 4367 Fax: +39 063 050 159 [email protected]
t
echnology
R
epoRt
Dello Russo, Lisi, Lofaro et al.
t
echnology
R
epoRt
Dello Russo, Lisi, Lofaro et al.
Abacavir hypersensitivity screening test by real-time PCR
t
echnology
R
epoRt
semiquantitative PCR [12]. This methodology
has been validated, and it has been widely dif-fused for the rapid screening of HLA-B*57:01-positive patients [13]. The assay was recently
improved by Giardina and collaborators, using the same primer sets in a PCR assay based on fluorescence detection of the amplified products through capillary electrophoresis [14]. However,
considering that most of the standard semi-quantitative PCR techniques have been replaced by real-time (Q)-PCR, in the present study we have developed and characterized an alterna-tive screening test based on the SSP method but using Q-PCR to detect the amplification products. We report the detailed methodology of this technique and the results of its validation by comparison with a reference method.
Materials & methods
n DNA samples
A first group of 28 blood samples was provided by the Institute of Clinical Infectious Diseases, Catholic University Medical School of Rome (Italy) and the Department of Infectious Diseases, University of Sassari (Italy). These patients were originally recruited and thus geno typed as described below in the EPI109367 clinical trial funded by GlaxoSmithKline (GSK; Brentford, UK) [15]. They were readmitted at
the outpatient clinics (after institutional review board approval of an amended research protocol for HLA-B genotyping with a different method), whole blood samples were collected in EDTA-treated tubes and used in the present study. These samples were initially used to optimize the experimental conditions, as detailed below. Subsequently, a panel of 80 additional DNA samples genotyped in the same clinical trial of the previous 28 were directly provided by GSK (Verona, Italy). These samples came from a multiethnic population and were genotyped by low-resolution sequence-specific oligonucleotide PCR, followed by high-resolution sequence-specific oligonucleotide PCR carried out on the HLA-B*57 positive samples (Laboratory of Tissue Genotyping, Immunohematology and Transfusion Medicine Service, Fondazione IRCCSS, Centro San Raffaele del Monte Tabor, Milan, Italy). This method was validated during the EPI109367 clinical trial, comparing results from 776 blood samples analyzed with this method with results obtained by LabCorp (NC, USA) on buccal swabs collected from the same subjects by sequence-specific oligonucleotide probe PCR [15]. The latter method was validated
during the PREDICT-1 clinical trial on 1956
samples [9], by comparison with the gold
stand-ard technique based on DNA sequencing. This panel of samples was enriched in HLA-B*57:01-positive samples (46.3%); moreover, six alleles belonging to the B*57 family were deliberately included. These alleles are discriminated on the basis of two mismatches in the exon-3-specific PCR primers, thus they were considered ‘diffi-cult’ to detect in comparison to other alleles dis-criminated on the basis of >2 mismatches. The exact number of positive samples, the number of ‘difficult’ alleles, together with the correct genotype of the samples included in the panel analyzed by our laboratory, were disclosed at the end of our ana lysis. These data are summarized in Table 1.
n Total DNA extraction.
Total DNA was prepared from whole blood samples, using the QIAamp® DNA Blood mini
kit (Qiagen, Hilden, Germany) according to the manufacturer’s instructions. Briefly, whole blood was collected in EDTA-treated tubes and stored at -20°C until the day of the extraction. Aliquots of 200 µl for each whole blood sample were used, and total DNA was eluted in 200 µl elution buf-fer (10 mM Tris HCl; 0.5 mM EDTA; pH 9.0; provided by the kit). DNA concentration was measured using the Quant-iT™ PicoGreen®
DNA Assay Kit (Invitrogen Corporation, Paisley, Scotland). A standard curve in the range of 0–10 ng was run in each assay using Lambda DNA standards, provided by the kit. Consistently, with data reported in the kit hand-book, final DNA yield was approximately 5 µg per sample.
n HLA-B-specific amplification by PCR HLA-B-specific amplification between the first and the third intron was carried out by PCR, using the following validated primers: 5BIn1–57 forward primer (forward: 5´-GGG AGG AGC GAG GGG ACC G/CCA C-3´; intron 1: 36–57) and 3BIn3–37 reverse primer (reverse: 5´-GGA GGC CAT CCC CGG CGA CCT AT-3´; intron 3: 37–59), yielding a 922 bp product [16]. The PCR reaction contained 50
ng total DNA, 1X PCR buffer, 300 nM of each primer, 1.25 U AccuPrime™ PfX DNA Polymerase (Invitrogen Corporation) in 50 µl final volume. After initial denaturation (10 min at 95°C), a total of 35 PCR cycles were conducted, using the following two-step PCR conditions: denaturation at 95°C for 20 s and annealing/extension at 68°C for 1 min, in a MasterCycler ep thermo cycler® (Eppendorf,
t
echnology
R
epoRt
Dello Russo, Lisi, Lofaro et al.
t
echnology
R
epoRt
Dello Russo, Lisi, Lofaro et al.
Abacavir hypersensitivity screening test by real-time PCR
t
echnology
R
epoRt
Hamburg, Germany). The amplicons were sep-arated by electrophoresis through 1.5% agarose gels containing 0.1 µg/ml ethidium bromide. This step allowed us to verify the efficiency of DNA amplification, in order to avoid the pro-cessing of incorrect preamplified samples, thus reducing the incidence of false-negative results.
n HLA-B*57:01 typing by SSPs Q-PCR
The Immunogenetics project (IMGT)/HLA database was used to align the HLA-B*57:01 DNA sequence to other known HLA-B allele sequences [17]. The highest variability was found
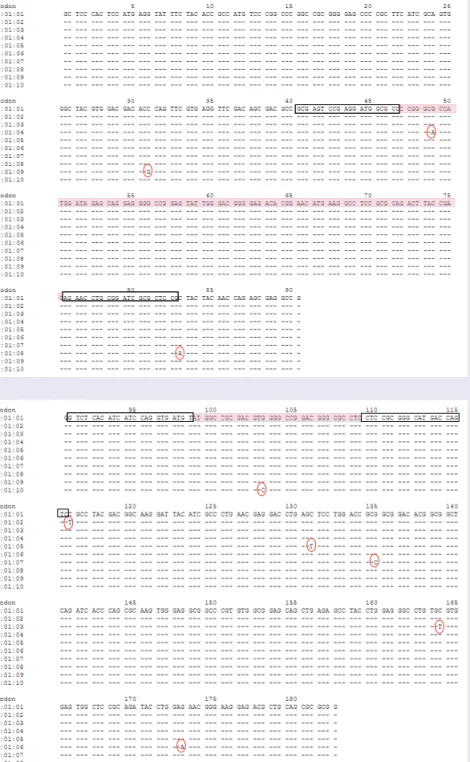
in the exon 2 and exon 3 sequences, which are regions that encode the peptide-binding domains of the MHC class I molecules. In this database, we initially found three different sequences rela-tive to the HLA-B*57:01 allele, named progres-sively as 57:01:01, 01:02 and 01:03, which dif-fered for one mismatch on exon 3, as indicated in Figure 1 (red circles). These two SNPs were not
included in the product of amplification when SSPs (black rectangles, Figure 1) were designed,
so that all three HLA-B*57:01 alleles could be detected. By 15 October 2010 (the last released update), seven additional sequences had been stored in the IMGT/HLA database [17]. The
HLA-B*57:01:04 allele, which differs by an A to
G mutation at position 648 (AJ458991 sequence, NCBI GenBank database), is located within the PCR product amplified by exon-2-specific PCR
(Figure 1a). This mutation does not interfere with
the alignment of the primers, but may cause a small change in the melting temperature (Tm) of the amplification product. Nevertheless, the allele HLA-B*57:01:04 will be detected by amplifications in the two Q-PCRs. The point mutations found in the exon 2 sequences of the newly identified HLA-B*57:01:08 and 01:09 are not included in the amplified Q-PCR product, while the other newly identified sequences are identical in the exon 2 region (Figure 1a). The
HLA-B*57:01:05–09 point mutations identified
on the exon 3 region (Figure 1b) are not included
in the product amplified by the exon-3-specific Q-PCR. Finally, the point mutation found in the exon 3 sequence of the HLA-B*57:01:10 allele is within the amplified Q-PCR product, and it is a C to G substitution, which does not change the Tm of the amplicon (Figure 1b). Taking all these
observations together we can conclude that the additional HLA-B*57:01 alleles will be detected by our assay.
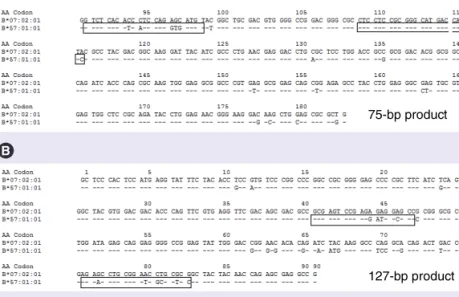
In order to encompass the highest variable regions of the HLA-B DNA sequence, two sets of primers were designed. The first set consisted
of forward primer 345F (5´-GTC TCA CAT CAT CCA GGT GAT GT-3´) and reverse primer 419R (5´-GAC TGG TCA TGC CCG CGG AG-3´), allowing for the amplification of a 75 bp amplicon, corresponding to nucleo tides 1020–1094 on exon 3 of the AJ458991 sequence, NCBI GenBank database (Figure 2a). This
prod-uct is similar but not identical to that previously described by Mallal and collaborators [12]. The
second set of primers consists of forward primer 193F (5´-GCG AGT CCG AGG ATG GCG CC-3´) and reverse primer 319R (5´-GGA GCG CGA TCC GCA GGT TCT-3´), which yield a 127 bp product, corresponding to nucleotides 622–748 on exon 2 of the AJ458991 sequence (NCBI GenBank database, Figure 2b). In Figure 2,
the sequence of the HLA-B*57:01:01 is aligned to the official reference sequence HLA-B*07:02:01,
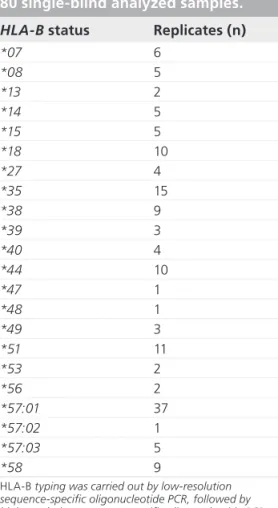
Table 1. Allele distribution in the
HLA-B*57:01-enriched panel of
80 single-blind analyzed samples. HLA-B status Replicates (n)
*07 6 *08 5 *13 2 *14 5 *15 5 *18 10 *27 4 *35 15 *38 9 *39 3 *40 4 *44 10 *47 1 *48 1 *49 3 *51 11 *53 2 *56 2 *57:01 37 *57:02 1 *57:03 5 *58 9
HLA-B typing was carried out by low-resolution sequence-specific oligonucleotide PCR, followed by high-resolution sequence-specific oligonucleotide PCR carried out on the HLA-B*57-positive samples (Laboratory of Tissue Genotyping, Immunohematology and Transfusion Medicine Service, Fondazione IRCCSS, Centro San Raffaele del Monte Tabor, Milan, Italy), a technique validated during the GlaxoSmithKline-funded EPI109367 clinical trial [15]. Nine alleles were not univocally genotyped and were thus not included in this table. Among these, one allele was reported as HLA-B*57:01 positive, even though data were also compatible with the HLA-B*57:14 genotype. Most patients were heterozygous, while one patient was homozygous for HLA-B*57:01, one for HLA-B*18 and one for HLA-B*38.
t
echnology
R
epoRt
Dello Russo, Lisi, Lofaro et al.
t
echnology
R
epoRt
Dello Russo, Lisi, Lofaro et al.
Abacavir hypersensitivity screening test by real-time PCR
t
echnology
R
epoRt
corresponding to the AJ292075 sequence (NCBI GenBank database).
B preamplified DNA was used for
HLA-B*57:01 allele detection by Q-PCR, performed
with the two set of primers described above.
Q-PCR conditions were set using two positive controls (data not shown). Q-PCR reactions were carried out in a 20 µl reaction volume, using 163 nM of each primer and the Brilliant SYBR®
Green Q-PCR Master Mix 2X (Stratagene, CA, USA) in a MX3000P Q-PCR machine (Stratagene). Reaction efficiency of approxi-mately 98% was found in the dilution range of 1:100 and 1:5000 using HLA-B preamplified DNA, while a significantly lower efficiency was detected when crude DNA was directly used as template in the Q-PCRs (data not shown). Thus HLA-B preamplified DNA diluted 1:1000 was chosen for subsequent assessments.
The first group of 28 blood samples were analyzed in a single-blind fashion using the two Q-PCRs described above, with the following cycling conditions: 30 cycles of denaturation at 95°C for 20 s; annealing at 64°C for the exon-3-specific primers and 65°C for the exon-2-exon-3-specific primers for 30 s; and extension at 72°C for 30 s. Data were analyzed using the amplification-based threshold and the adaptative baseline algorithms provided by the software ana lysis system of the MX3000P Q-PCR machine. The first algorithm automatically sets the threshold fluorescence for each dye, based on the amplification properties of each reaction; while the adaptative baseline algorithm calculates the best baseline for each amplification plot, thereby providing the most accurate fluorescence take-off point of reaction per sample, named threshold cycle (Ct). Using the automated algorithm to calculate the Ct val-ues and detect amplifications by Q-PCRs, we identified four positive and 24 negative samples
(Table 2), in complete concordance with results of
the previous genotyping. Data obtained with this first set of samples were used to further standard-ize Q-PCR conditions as follows: 20 cycles for the exon-3-specific Q-PCR, taking Ct values <15 to determine positive amplifications; 15 cycles for the exon-2-specific Q-PCR, taking Ct values <14 as positive amplifications (as described in detail in the ‘Results’ section). Using these Q-PCR parameters, we carried out a single-blind ana-lysis of a panel of 80 additional DNA samples, directly provided by GSK.
n Data ana lysis
Results obtained with the analytical method for HLA-B*57:01 screening generated in our laboratory were compared with results obtained using a previously validated method. The k-statistic measure of inter-rater agreement for two unique raters and two ratings was calcu-lated, according to the method described by
Figure 1. DNA sequences relative to HLA-B*57:01. DNA sequences relative to the (A) exon 2 and (B) exon 3 regions of HLA-B*57:01 are aligned. When the sequence-specific primer (black rectangles) were designed in October 2007, the first three DNA sequences were found in the Immunogenetics project (IMGT)/HLA database [17]. These sequences differ for one mismatch (red circles), that was not included in the DNA region amplified by sequence-specific primer sets. However, at present, seven additional sequences are stored in the database. Pink rectangles refer to the sequences amplified between each primer set.
t
echnology
R
epoRt
Dello Russo, Lisi, Lofaro et al.
t
echnology
R
epoRt
Dello Russo, Lisi, Lofaro et al.
Abacavir hypersensitivity screening test by real-time PCR
t
echnology
R
epoRt
Cohen [18]. k is a general measure of agreement
for categorical data and it is computed using the following equation: Pr Pr Pr K e a e 1 = -^ ^ ^ h h h
where Pr(a) is the relative observed agreement among raters, and Pr(e) is the hypothetical prob-ability of chance agreement. k can vary between -1 (complete disagreement) to +1 (complete agreement). Results were analyzed by Stata 10.1 (Stata Statistical Software 10.1, StataCorp LP, TX, USA).
Results
n Analysis of the first 28 samples DNA samples from 28 individuals were analyzed in a single-blind fashion using a HLA-B-specific amplification followed by two sequence-specific Q-PCRs. Using the automatic algorithms pro-vided by the Q-PCR software (see ‘Materials & methods’ section), four positive samples were identified, that is amplification in both Q-PCRs
(Table 2). However, the Q-PCR designed for the
exon 2 allowed for the identification of five posi-tive samples (average Ct = 11.7) (Table 2). This
primer set does not differentiate some alleles of the HLA-B*57 group, thus suggesting that the genotype of the additional positive sample belongs to the B*57 group. At present the
HLA-B*57 group includes 37 different alleles, identified
progressively with two numbers, from B*57:01 to B*57:37. Moreover, with the exon-2-specific Q-PCR we identified five additional samples with an average Ct value of approximately 14.9, three of which had similar Tm to the ones reported in Table 2. However, these higher Ct values are
not compatible with possible differences in the amount of initial DNA template owing to the homo- or hetero-zygous status, which can only account for no more than ± 1 cycle difference (one cycle = double amount of DNA), thus they were considered nonspecific amplifications. For the same reason, all the amplifications detected in both Q-PCRs with Ct values higher than 20 cycles were considered nonspecific.
n Standardization of Q-PCR cycling conditions & data ana lysis
Results from the ana lysis of the first 28 samples were compared with the previous genotyping, and demonstrated a complete concordance; thus, they were used to standardize the Q-PCR profile setting and the ana lysis parameters in order to better compare data from different Q-PCR runs. Only the first 20 cycles were taken into account
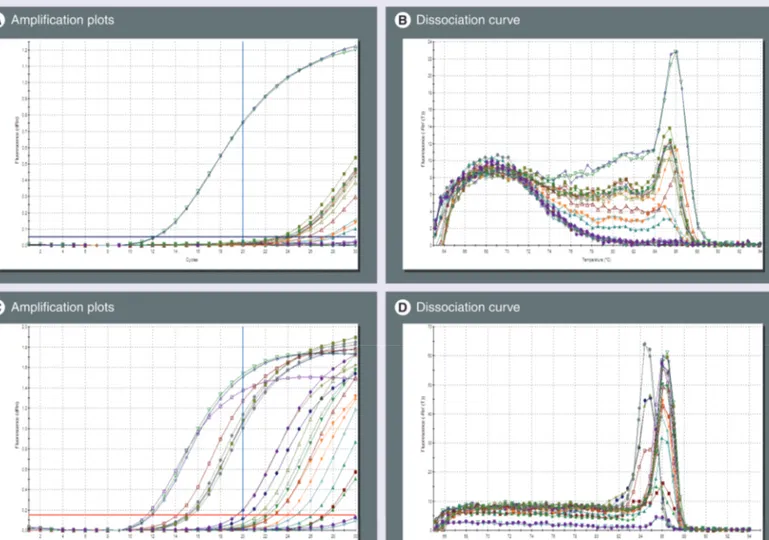
for a second ana lysis, which was carried out using a higher fluorescence threshold, manually adjusted to a fixed value arbitrarily chosen in the exponential phase of the amplification plot, which was equal to 0.05 for the exon 3 Q-PCR. This value was equal to 0.15 for the exon 2 Q-PCR. Moreover, the background correction was carried out using fluorescence values from cycle 3 to 10. Data from 21 samples analyzed with these param-eters are shown in Figure 3. Briefly, the Ct values
Table 2. Positive results from the first set of 28 patients who were analyzed in a single-blind fashion.
Sample number
Threshold Average Ct ± SEM
(n = 3) Average Tm ± SEM (n = 3) Q-PCR exon 3 1 0.024 13.4 ± 0.1 85.45 ± 0.023 2 0.024 13.5 ± 0.3 85.51 ± 0.020 3 0.020 10.6 ± 0.3 85.97 ± 0.001 4 0.020 10.9 ± 0.1 85.90 ± 0.183 Q-PCR exon 2 1 0.053 11.9 ± 0.1 85.90 ± 0.202 2 0.053 12.4 ± 0.1 86.30 ± 0.001 3 0.136 11.5 ± 0.04 86.47 ± 0.001 4 0.136 11.6 ± 0.1 86.08 ± 0.001 5 0.136 10.9 ± 0.1 85.95 ± 0.001
Samples were analyzed in two different PCR runs carried out per set of primers, as shown by differences in the threshold value. The latter was set by automatic algorithms provided by the Q-PCR software ana lysis system. Data, average Ct (each sample measured in triplicate) and average Tm values, relative to positive amplifications are reported.
Ct: Threshold cycle; Q-PCR: Real-time PCR; SEM: Standard error of the mean; Tm: Melting temperature.
75 bp product75-bp product
127 -p product127-bp product
Figure 2. HLA-B*57:01 alignment with the official reference sequence
B*07:02:01. HLA-B*57:01 is aligned with the official reference sequence. The
location of the sequence-specific primers within (A) exon 2 and (B) exon 3 is indicated (rectangles), and was selected in order to include the variable regions of the HLA-B DNA sequence to discriminate the allele of interest (B*57:01) and exclude other B alleles.
t
echnology
R
epoRt
Dello Russo, Lisi, Lofaro et al.
t
echnology
R
epoRt
Dello Russo, Lisi, Lofaro et al.
Abacavir hypersensitivity screening test by real-time PCR
t
echnology
R
epoRt
for the positive samples were as expected; higher than those reported in Table 2. In fact, the average
Ct value of the positive samples measured in the exon 3 Q-PCR was 13.4 ± 0.7 (mean ± standard error of the mean [SEM], n = 4) with three cycle differences between the lower, and the highest Ct value; and a value of 12.8 ± 0.05 (mean ± SEM, n = 4) with two cycle differences between the lowest and the highest sample detected in positive assays using the exon 2 Q-PCR.
Taking these data into account, subsequent Q-PCRs were run and analyzed as follows:
Exon-3-specific Q-PCR: 20 cycles, cycle 3–10 fluorescence values for background correction, fluorescence threshold of 0.05, and cut-off Ct value <15 to determine positive amplifications. The cut-off value was calculated considering the average Ct calculated for the positive samples
(13.4) ± 1.5 cycle, since three cycle differences were measured among the lowest and the highest positive sample.
Exon-2-specific Q-PCR: 15 cycles, cycle 3–7 fluorescence values for background correction, fluorescence threshold of 0.15, and cut-off Ct value <14 to determine positive amplifications. The cut-off value was calculated considering the average Ct calculated for the positive sam-ples (12.8) ± 1 cycle, since two cycle differ-ences were measured among the lowest and the highest positive sample. However, this Q-PCR will be used to confirm positive results obtained with the first PCR, and to exclude the presence of the 55:14, 57:16, 57:34 and
58:14 alleles, which would be detected as
positive with the exon-3-specific Q-PCR but negative with the exon-2-specific Q-PCR.
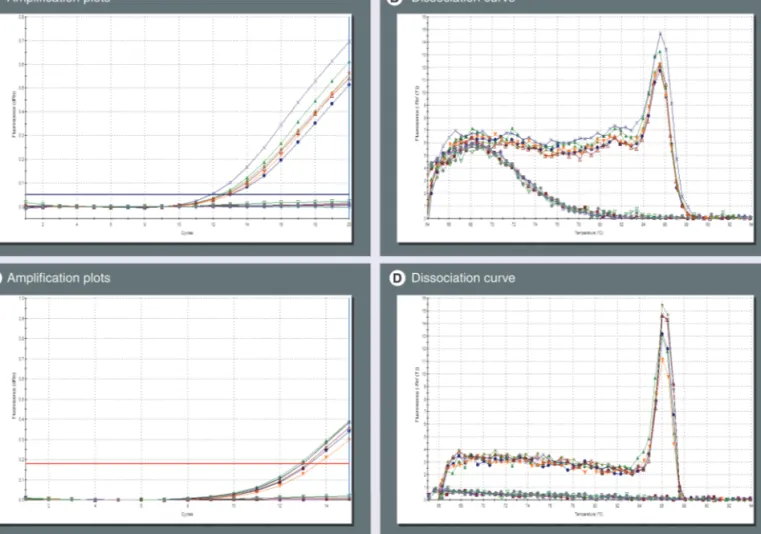
Figure 3. Identification of HLA-B*57:01 by real-time PCR. (A & B) Exon-3- and (C & D) exon-2-specific real-time (Q)-PCR were run for 30 cycles on 21 samples; data were analyzed using fluorescence values detected within cycles 3–10 as background and a fixed threshold level. The first 20 cycles were considered for data ana lysis. In the exon-3-specific Q-PCR, two positive samples were detected with an average threshold cycle (Ct) of 12.2 (A) and a melting temperature (Tm) of 85.90 (B). In the exon-2-specific Q-PCR, three positive samples were detected with an average threshold cycle (Ct) of 11.8 (C) and a Tm of 86.17 (D). Five other samples had an average Ct value of 15, which was considered not compatible with possible variation in the initial quantity of DNA template owing to the homo- or hetero-zygous status. The latter would explain a difference of one cycle in the Ct value (one cycle = double DNA quantity).
t
echnology
R
epoRt
Dello Russo, Lisi, Lofaro et al.
t
echnology
R
epoRt
Dello Russo, Lisi, Lofaro et al.
Abacavir hypersensitivity screening test by real-time PCR
t
echnology
R
epoRt
In order to assess the error rate owing to pos-sible changes in the PCR efficiency, one posi-tive sample was measured in triplicate in eight different PCR runs. The average Ct value was 12.7 ± 0.3 (mean ± SEM, n = 8) for the exon-3-specific PCR, and 11.9 ± 0.4 (mean ± SEM, n = 8) for the exon 2 PCR. Ct values measured in each PCR run were found consistently below the cut-off Ct value, indicating the high reproducibility of the results in different PCR runs.
With these settings, we have analyzed in a single-blind fashion 80 DNA samples provided directly by GSK and previously genotyped in the EPI109367 trial. We identified a total of 37
HLA-B*57:01-positive samples by detecting positive
amplifications in both Q-PCRs. In particular, in the exon-3-specific Q-PCR, we identified 37 positive samples, with an average Ct value of 12.9 ± 0.1 (SEM), and an average Tm of the ampli-fication product equal to 85.48 ± 0.03 (SEM). By contrast, in the exon 2 Q-PCR, 43 positive sample were identified, with an average Ct value of 12.8 ± 0.1 (SEM), and an average Tm equal to 86.3 ± 0.03 (SEM). In Figure 4, Q-PCR
fluo-rescence plots and Tm for the first ten samples analyzed with the parameters described above are shown as an example of a typical Q-PCR assay. All data were compared with previous g enotyping data and a 100% overlap was found. In conclusion, we analyzed, with a Q-PCR screening test, a total of 108 samples, and identi-fied 41 samples as positive and considered 67 as negative. Complete agreement was found with a validated methodology, with k for concord-ance = 1 (standard error = 0.0962; p < 0.0001).
Discussion
In the present paper we have validated a rapid pharmacogenomic test for the screening of the
HLA-B*57:01 allele using SSPs and Q-PCR.
Since the HLA-B*57:01 sequence differs in 59 point mutations from the official HLA-B reference sequence, namely HLA-B*07:02:01
(Figure 2), multiple sets of primers needed to be
used in order to detect the allele of interest. We designed two sets of SSPs (approximately 20 bp oligonucleotides) that aligned the HLA-B*57:01 sequence in two different regions; one in exon 3 and another in exon 2. In the presence of the
HLA-B*57:01 allele, primers bind DNA and a
specific product can be amplified by Q-PCR and detected by SYBR Green fluorescence. In 2005, the group of Mallal described an allele-specific PCR method for the detection of
HLA-B*57:01, based on the use of a panel of four
SSPs; one forward and three reverse primers [12].
Amplification of the HLA-B*57:01-specific sequence was detected by standard semiquan-titative PCR, a method presently used by sev-eral laboratories [13] which has been recently
improved [14]. Fluorescence-based detection by
capillary electrophoresis increases the sensitivity of Mallal’s method, thus allowing the use of as low as 1 ng of DNA per sample. This allows the employment of a noninfective source of DNA, such as saliva and buccal swabs, the main advan-tage of this method [14]. The semiquantitative
PCR technique has been progressively replaced by Q-PCR, a more rapid and sensitive method for the direct monitoring of DNA amplification during PCR cycling. In a subsequent study, the same research group described a faster test car-ried out in Q-PCR [19]. For this approach, they
used only three of the four HLA-B*57:01 SSPs previously characterized [12], thus missing the
opportunity to discriminate the HLA-B*57:06 allele [19]. Briefly, the authors used together
with the HLA-B*57:01-specific primers, a set of primers specific for the housekeeping gene, the HGH gene, that yielded a 439-bp product. The authors set up a multiplex Q-PCR to favor amplification of the HLA-B*57:01-specific product when the allele is present instead of the amplification of the HGH-specific amplicon. The assessment of the HLA-B*57:01 status was carried out by analyzing differences in the melting curves of the two different amplified products [19]. However, our preliminary data
demonstrated a significantly lower Q-PCR effi-ciency and sensitivity when both primer sets were used directly on crude DNA preparation (data not shown); therefore, HLA-B-specific amplification using already validated primers was introduced in our strategy [16]. To prevent
the introduction of nonspecific mutations dur-ing this amplification step, we used a high fidel-ity DNA polymerase as described in detail in the ‘Materials & methods’ section.
The allele-specific PCR method described by Mallal is based on the recognition of a high variable DNA sequence located on exon 3; this region has also been included in our strategy. The forward primer used in this Q-PCR is simi-lar to the one described by Mallal et al., how-ever the rhow-everse primers are located upstream, thus leading to the amplification of a shorter product of 75 bp [12]. This shift allowed us
to discriminate the following alleles: 57:02,
57:03, 57:04, 57:05, 57:07, 57:09, 57:12 and
the newly identified 57:17 allele, via one addi-tional mismatch in comparison to the reverse primer used by Mallal’s group [12]. In fact, we
t
echnology
R
epoRt
Dello Russo, Lisi, Lofaro et al.
t
echnology
R
epoRt
Dello Russo, Lisi, Lofaro et al.
Abacavir hypersensitivity screening test by real-time PCR
t
echnology
R
epoRt
identified six samples as negative in the exon 3 Q-PCR and positive in the exon 2 Q-PCR, and hypothesized that they were alleles of the
B*57 group. These samples corresponded to one HLA-B*57:02 allele and five HLA-B*57:03
alle-les included in the panel of known GSK sam-ples. Based on these experimental data and the sequence ana lysis, we also expected to detect other alleles of the B*57 family indicated above as negative on exon-3-specific Q-PCR and posi-tive in the exon-2-specific Q-PCR. The latter reaction allows for the amplification of a sec-ond variable region within the exon 2 sequence, using a SSP set.
Finally, the amplification of a product within the two Q-PCRs allows for the identi-fication of HLA-B*57:01, including all of the ten sequences deposited for this allele, along with HLA-B*57:06, -57:08, -57:10 and -57:13 alleles and the newly identified HLA-B*57:14,
-57:15, -57:18–20, -57:22–27, -57:29–33
and -57:35–37 which are absolutely identical in the regions examined. However, B*57:06 and B*57:08 alleles have a 0% frequency in the Caucasian population [20], and thus do
not represent a significant confounding fac-tor. There is no information available regard-ing the frequency of other alleles in different populations, thus suggesting that they may be very rare. Similar to our technique, the stand-ard SSP-PCR method [12], widely used in other
laboratories as a fast screening test as well as the newly described fluorescence method [14], does
not discriminate these newly identified alleles, as well as the B*57:16 and B*57:34 alleles that are detected instead by our strategy using a mis-match in the forward primer of the exon-2-spe-cific Q-PCR. However, the need for a continu-ous update of the primer sets based on newly identified DNA polymorphisms represents a limit of SSP-based techniques; thus, this work is an important update on the sequence studies
Figure 4. Use of standardized real-time PCR conditions for detection of HLA-B*57:01. (A & B) Exon-3- and (C & D) exon-2-specific real-time (Q)-PCR were run for 20 and 15 cycles, respectively, on the first ten GlaxoSmithKline samples (Figure 1); data were analyzed using fixed parameters for background correction and fluorescence threshold in order to compare different runs. In the exon-3-specific Q-PCR, six positive samples were detected with an average threshold cycle (Ct) of 12.6 (A) and a Tm of 85.47 (B). Similarly, in the exon-2-specific Q-PCR six positive samples were detected with an average Ct of 13.2 (C) and a Tm of 86.01 (D).
t
echnology
R
epoRt
Dello Russo, Lisi, Lofaro et al.
t
echnology
R
epoRt
Dello Russo, Lisi, Lofaro et al.
Abacavir hypersensitivity screening test by real-time PCR
t
echnology
R
epoRt
Executive summary
International HIV treatment guidelines recommend HLA-B*57:01 typing before abacavir administration, in order to reduce the incidence of abacavir hypersensitivity reaction.
Technologies available to detect individual HLA types, such as DNA sequence-based typing or the sequence-specific oligonucleotide probe method with additional DNA sequencing for patients screened as positive with the probes, are time-consuming, expensive and not readily available.
In 2005, Mallal’s group developed an quick method for HLA-B*57:01 screening, based on the use of a panel of
sequence-specific primers and standard PCR technique. This assay has been recently improved by fluorescence-based detection via capillary electrophoresis.
Results
Two sets of sequence-specific primers have been designed and a novel test, based on real-time PCR technique, has been developed and validated in the present study.
Conclusion
This test is rapid, allowing for the processing of 30 samples in 24 h, is sensitive and specific, inexpensive in comparison to already available alternatives, and can be easily implemented into routine clinical practice.
The main limitation of this approach, and in general with sequence-specific primer techniques, is represented by the continuous need for sequence updating owing to the highly polymorphic nature of the HLA-B gene.
Since the seminal work of Mallal’s group, approximately 1000 new sequences have been identified for the HLA-B gene; thus, a useful update of sequence studies has been provided in the present paper.
reported in the abovementioned papers [12,14].
Another advantage of our technique is the pos-sibility to discriminate additional alleles, such as HLA-B*55:14 and -58:14.
In this regard, we should also report that the validated methodology used to compare our results provided, with respect to the few alleles analyzed, results compatible with differ-ent geno typing studies (Table 1). Among these,
the genotype of one HLA-B*57:01-positive sample was also compatable with the
HLA-B*57:14-specific sequence. These data
sug-gest that with respect to some B*57 alleles, the only technique able to detect differences is the DNA sequence-based typing, which still remains the gold standard technique. However, since the frequency of such alleles seems to be extremely low, they should not represent a criti-cal c onfounding factor.
Conclusion
In the present paper, we provided evidence to suggest the adoption of the test herein charac-terized into clinical practice as a fast method to screen for HLA-B*57:01 status, particularly in those laboratories already involved in detec-tion of viral load and virus genotyping. The test described may be considered as an alterna-tive to Mallal’s test for those laboratories that can have access to the Q-PCR technique. In particular, with respect to the validated meth-odology used to compare our method, the assay presented in this paper can allow the processing of 30 samples versus 10 samples in one single assay. The genotype results can be provided in 24 h (30 patients) versus 48 h of the reference
method (ten patients). The entire assay is run in approximately 6–8 h.
Acknowledgements
The authors would like to thank Francesca Zazzeroni and Francesco Ria for meaningful insights into how to design the present strategy, with respect to HLA-B preamplifica-tion and primer sets. The authors are also thankful to Giulia Berrettarossa Fiorentino for initial help in the study of the HLA-B sequences. The authors acknowledge the provision of samples and the corresponding HLA-B*57:01 results from GlaxoSmithKline.
Author disclosure
Data discussed in this article were recently presented at the Italian Conference on AIDS and Retroviruses (ICAR 2010), which was held in Brescia, Italy, 20–22 June 2010. The abstract (P040) was published in Infection [21].
Financial & competing interests disclosure
Dr Antonella Pirazzoli was employed by GlaxoSmithKline at the time of validation. The authors have no other relevant affiliations or financial involvement with any organization or entity with a financial interest in or financial conflict with the subject matter or materials discussed in the manuscript apart from those disclosed.
No writing assistance was utilized in the production of this manuscript.
Ethical conduct of research
The authors state that they have obtained appropriate insti-tutional review board approval or have followed the princi-ples outlined in the Declaration of Helsinki for all human or animal experimental investigations. In addition, for investi gations involving human subjects, informed consent has been obtained from the participants involved.
t
echnology
R
epoRt
Dello Russo, Lisi, Lofaro et al.
Bibliography1 Martinez-Cajas JL, Wainberg MA: Antiretroviral therapy: optimal sequencing of therapy to avoid resistance. Drugs 68, 43–72 (2008).
2 Sabin CA, Worm SW, Weber R et al.: Use of nucleoside reverse transcriptase inhibitors and risk of myocardial infarction in HIV-infected patients enrolled in the D:A:D study: a multi-cohort collaboration. Lancet 371, 1417–1426 (2008).
3 Currier JS: Update on cardiovascular complications in HIV infection. Top HIV Med. 17, 98–103 (2009).
4 Chessman D, Kostenko L, Lethborg T et al.: Human leukocyte antigen class I-restricted activation of CD8+ T cells provides the
immunogenetic basis of a systemic drug hypersensitivity. Immunity 28, 822–832 (2008).
5 Lucas A, Nolan D, Mallal S: HLA-B*5701 screening for susceptibility to abacavir hypersensitivity. J. Antimicrob. Chemother. 59, 591–593 (2007).
6 Mallal S, Nolan D, Witt C et al.: Association between presence of HLA-B*5701, HLA-DR7, and HLA-DQ3 and hypersensitivity to HIV-1 reverse-transcriptase inhibitor abacavir. Lancet 359, 727–732 (2002).
7 Hetherington S, Hughes AR, Mosteller M et al.: Genetic variations in HLA-B region and hypersensitivity reactions to abacavir. Lancet 359, 1121–1122 (2002).
8 Saag M, Balu R, Phillips E et al.: Study of hypersensitivity to abacavir and
pharmacogenetic evaluation study team. High sensitivity of human leukocyte
antigen-B*57:01 as a marker for immunologically confirmed abacavir hypersensitivity in white and black patients. Clin. Infect. Dis. 46, 1111–1118 (2008). 9 Mallal S, Phillips E, Carosi G et al.;
PREDICT-1 Study Team: HLA-B*5701 screening for hypersensitivity to abacavir. N. Engl. J. Med. 358, 568–579 (2008). 10 Hammer SM, Eron JJ Jr, Reiss P et al.;
International AIDS Society-USA: Antiretroviral treatment of adult HIV infection: 2008 recommendations of the International AIDS Society-USA panel. JAMA 300, 555–570 (2008).
11 Clumeck N, Pozniak A, Raffi F; EACS Executive Committee: European AIDS Clinical Society (EACS) guidelines for the clinical management and treatment of HIV-infected adults. HIV Med. 9, 65–71 (2008).
12 Martin AM, Nolan D, Mallal S: HLA-B*5701 typing by sequence-specific amplification: validation and comparison with sequence-based typing. Tissue Antigens 65, 571–574 (2005).
13 Lalonde RG, Thomas R, Rachlis A et al.: Successful implementation of a national HLA-B*5701 genetic testing service in Canada. Tissue Antigens 75, 12–18 (2010). 14 Giardina E, Stocchi L, Foti Cuzzola V et al.:
A fluorescence-based sequence-specific primer PCR for the screening of HLA-B*57:01. Electrophoresis 31, 3525–3530 (2010). 15 Orkin C, Sadiq ST, Rice L, Jackson F:
Prospective epidemiological study of the prevalence of human leukocyte antigen (HLA)-B*5701 in HIV-1-infected UK subjects. HIV Med. 11, 187–192 (2010).
16 Cereb N, Maye P, Lee S, Kong Y, Yang SY: Locus-specific amplification of HLA class I genes from genomic DNA: locus-specific sequences in the first and third introns of HLA-A, -B, and -C alleles. Tissue Antigens 45, 1–11 (1995).
17 Robinson J, Mistry K, McWilliam H, Lopez R, Parham P, Marsh SG: The IMGT/HLA Database. Nucleic Acids Res. 39(Database issue), D1171–D1176 (2011). 18 Cohen J: A coefficient of agreement for
nominal scales. Edu. Psych. Measur. 20, 37–46 (1960).
19 Hammond E, Mamotte C, Nolan D, Mallal S: HLA-B*5701 typing: evaluation of an allele-specific polymerase chain reaction melting assay. Tissue Antigens 70, 58–61 (2007).
20 Middleton D, Menchaca L, Rood H, Komerofsky R: New allele frequency database. Tissue Antigens 61, 403–407 (2003).
21 Dello Russo C, Lisi L, Lofaro A et al.: Validation of a sensitive, specific and rapid pharmacogenomic test for the prediction of abacavir hypersensitivity reaction: detection of HLA-B*5701 by real-time PCR. Infection 38(Suppl. 1), 61 (2010) (Abstract P040).
n Website
101 Panel on Antiretroviral Guidelines for Adults and Adolescents. Guidelines for the use of antiretroviral agents in HIV-1-infected adults and adolescents. Department of Health and Human Services
www.aidsinfo.nih.gov/ContentFiles/ AdultandAdolescentGL.pdf