Bennet Woodcroft and the value of English patents, 1617
–1841
☆
Alessandro Nuvolari
a,⁎
, Valentina Tartari
ba
Laboratory of Economics and Management (LEM), Sant'Anna School of Advanced Studies, Piazza Martiri della Liberta' 33, 56127, Pisa, Italy
b
Innovation and Entrepreneurship Group, Imperial College Business School, Imperial College, South Kensington Campus, London, SW7 2AZ, United Kingdom
a r t i c l e i n f o
a b s t r a c t
Article history: Received 13 March 2009 Available online 9 November 2010
We examine the potentialities of a new indicator measuring the value of English patents in the period 1617–1841. The indicator is based on the relative visibility of each individual patent in the contemporary technical and legal literature as summarized in Bennet Woodcroft's Reference Index of Patents of Invention. We conclude that the indicator provides a reasonable proxy for the value of patents and that it can be usefully employed to shed light on the timing and scope of innovation during the Industrial Revolution. In particular, our indicator offers a suitable reconciliation between the patent records evidence and the Crafts–Harley view of the Industrial Revolution.
© 2010 Elsevier Inc. All rights reserved.
Keywords: Patents Invention Industrial Revolution England 1. Introduction
Richard Sullivan (1989, 1990)has argued that patent statistics can shed light on the ongoing debates on the timing and the nature of innovation during the British Industrial Revolution. The time series of English patents exhibits a significant structural break around 1760 and this would indicate, at least according to Sullivan, a momentous acceleration of technical progress taking place in that period. Furthermore, the distribution of patents across industrial sectors displays a rather low level of concentration pointing to the relatively widespread nature of inventive activities. Considered together these twofindings may be regarded as providing evidence in support of the“traditional” interpretation of the Industrial Revolution as a phase of rapid and widespread technical change, while contradicting the revisionist view put forward by Crafts and Harley arguing for a more gradual dynamics, initially restricted only to a handful of modernized sectors (Crafts and Harley, 1992).
Sullivan'sfindings are, however, critically dependent on the reliability of patent counts as indicators of innovation. In fact, historians such asMacLeod (1988), O'Brien et al. (1995)and more recentlyNuvolari (2004) and Moser (2005)have suggested that a sizable share of inventive activities was undertaken outside the coverage of patent protection. Therefore, one should be extremely cautious in gauging the dynamics of invention during the Industrial Revolution by looking at trends in patent counts. Furthermore, patents differed greatly in their quality and, as a result, the use of simple patent counts for reconstructing the patterns of technical change during this period may be unwarranted.
In this paper we examine the issue of the quality of patents during the Industrial Revolution. We provide a comprehensive appraisal of the quality of all English patents granted in the period 1617–1841 using a historical source that so far has been neglected. This source is the Reference Index of Patents of Invention, 1617–1852 edited by Bennet Woodcroft and published in 1855.
☆ We are particularly grateful to Christine MacLeod, Tim Leunig, Thomas Burr, Karl Gunnar Persson, Paola Criscuolo, Ken Lipartito, Jochen Streb, Jim Bessen, Bob Allen, Patrick O'Brien, Giulio Bottazzi, Pietro Dindo, Sean Bottomley, Marco Grazzi, Federico Tamagni and two anonymous referees for helpful suggestions on previous drafts. Davide Pirino has provided precious advice in the implementation of some statistical exercises. We would like also to thank participants at seminars in Cambridge, London, Geneve, Strasbourg, and at sessions of the 2008 Social Science History Conference in Miami and of the 2009 Economic History Society Conference in Warwick for stimulating discussions.
⁎ Corresponding author.
E-mail addresses:[email protected](A. Nuvolari),[email protected](V. Tartari). 0014-4983/$– see front matter © 2010 Elsevier Inc. All rights reserved.
doi:10.1016/j.eeh.2010.09.005
Contents lists available atScienceDirect
Explorations in Economic History
For each patent, the Reference Index volume provides a list of references (either to technical and engineering literature or to legal proceedings and commentaries) where the patent specification is mentioned. Our basic assumption is that the relative “visibility” of each patent in Woodcroft's Reference Index provides a reasonable proxy for its relative technical and economic significance (only patents of non-trivial economic value are likely to be extensively discussed in the technical literature or at the centre of litigations). This approach is analogous to the use of patent citations as measures of the value of patents in the contemporary literature (Jaffe and Trajtenberg, 2002).
On the basis of Woodcroft's Reference Index, we assign a quality score to each patent in our period of interest. Thefirst step of our study is to assess the reliability of our new indicator of patent quality. We establish that patents classified as radical innovations byBaker (1976)and patents taken by inventors listed in the 2004 edition of the Oxford Dictionary of National Biography and in another selection of“great inventors” recently compiled byAllen (2009)are systematically characterized by high quality scores (also after controlling for other patent characteristics). This result, in our interpretation provides significant corroboration of the general reliability of our indicator of patent quality. Furthermore, the distribution of the quality scores both at the aggregate level and at the level of individual industries is highly skewed and similar to those characteristic of modern patent data (Jaffe and Trajtenberg, 2002).
The second step of our analysis is to examine the distribution of high quality patents both over time and across industrial sectors. Wefind that, in comparison with the distribution of total patents over time, the distribution of high quality patents is clustered on an earlier period. Additionally, the distribution of high quality patents across industries is significantly more concentrated than the distribution of total patents. In this way, our proposed indicator of patent quality seems to offer a way of reconciling the patent evidence with the“revisionist view” put forward byCrafts and Harley (1992). Concerning the timing of the Industrial Revolution, ourfindings seem in line with the traditional chronology, confirming that the second half of the eighteenth century (1762–1801) was characterized by a clustering of critical technical breakthroughs (high quality patents). In terms of the scope of the change, ourfindings indicate that, although patents were relatively widespread across industries, patents of relatively high quality were localized in a more restricted number of sectors. Ourfindings can be reconciled with the dynamics of productivity growth posited in the Crafts–Harley view (Crafts and Harley, 1992) by interpreting the pattern of innovation of the Industrial Revolution as a two-stage process, as suggested byMokyr (1999, pp. 20–23)and more recently byAllen (2009, pp. 135– 155). Thefirst stage, broadly coinciding with the “take-off” of the traditional chronology (1760–1800) is the phase when, in a number of key-sectors, critical technical breakthroughs, or macroinventions in the sense ofMokyr (1990, pp. 13–14), such as steam engines and textile machinery were invented. The second stage, corresponding to the period (1810–1840), may be seen as the phase during which the potential of the macroinventions became fully realized by virtue of streams of microinventions that greatly improved their performance. Obviously, it is in the second phase that we should expect tofind a significant impact of technical change on productivity growth.
2. Estimating patent quality
One of the well-known limitations of the use of simple patent counts as indicator of technical progress is the different quality of the inventions covered by individual patents. This point is effectively made byO'Brien et al. (1996, p. 165):
In their quantitative work, cliometricians and economists are prone to aggregate recorded inventions into an index, purporting to represent annual and cyclical variations in the volume of technological change within particular industries or across national economies as a whole. Such an index would be extremely useful to historians, but, except for entirely limited purposes, no such indicator can be constructed, since innovations recorded in patents and other documents are unknown and potentially variable proportion of changes in the totalflow of invention. Even recorded inventions cannot be aggregated without some system of weighting to account for variations in their economic and technological significance. So ideally, one would like to be able to assign each patent a weight reflecting its technological and economic significance. Sullivan (1995), although acknowledging the issue of variations in patent quality, proposes that it may not be so severe in practice. We should be aware that English patents until the reform of 1852 required the payment of a very expensive fee, well above the average yearly household income. Thus, according to Sullivan, given the high costs of taking a patent, we could expect that inventors carried out informed assessments of the economic value of the invention in question before patenting it. In other words, we can imagine that the high patent fees acted as afiltering device, screening out inventions of particularly low quality.
In our view, Sullivan is too optimistic. We must remember that the English system was one of registration and not of examination and this means that patents were not subjected to any check concerning their technological feasibility. Furthermore, as noted byMacLeod (1988), in this period there were several heterodox uses of the patent system (e.g. using patents not for protecting innovations, but as an advertisement or reputation device; this, for example, was a common practice in the medical business). This clearly aggravates the problem of variations in patent quality. In this respect, detailed examinations of the contents of patents for specific industries may provide us with important insights. An exercise along these lines has been recently carried out byMacLeod et al. (2003). They examined a sample of 2010 British patents in steam engineering in the period 1800–1900 and found that 365 of these patents (corresponding to a sizable 18.1%) were granted to“perpetual motion” machines or other inventions which were not technically feasible. Notably, 217 of these impossible patents were granted in the period 1860–1900, that is well after the formulation of the principles of classic thermodynamics by Clausius and Kelvin in the early 1850s, which scientifically proved the impossibility of a perpetual motion engine.
However, recent developments in the economics of innovation suggest that the“nihilist” view of O'Brien, Griffiths and Hunt may not be completely warranted and that the problem of variations in the value of patents can be tackled rather effectively by constructing indicators of quality using patent characteristics that are likely to be positively correlated with the economic value of patents.
Thefirst example of this approach to the measurement of the value of patents is the use of renewal data pioneered by Schankerman and Pakes (Schankerman and Pakes, 1986; see alsoBessen, 2008for a more recent contribution in this vein). Most modern patent systems require patent owners to pay a renewal fee atfixed time intervals in order to keep the patent in force. In fact, only few patents are kept in force for their full lifetime. Thus, it is possible to estimate the value of an individual patent by considering the amount of renewal fees that the owner of the patent has paid to keep the patent“alive”. The underlying assumption is that a patent owner will pay the renewal fee for a given period only if he expects that this payment will be lower than the discounted streams of profits generated by the patent.Sullivan (1994)has applied this method to historical patent data by providing estimates of the value of British patents in the period 1852–1876.1The approach, however, cannot be used for the
English patent system in the period 1617–1852 because the system did not impose the payment of renewal fees after the granting of the patent.
The second approach pioneered byTrajtenberg (1990)is the assessment of the economic value of patents using the number of citations received. The intuition is relatively straightforward: when a patent has received many citations, this means that it contains knowledge that was used in a large number of subsequent technological developments. The actual existence of a positive correlation between citations received and the economic value of patents was documented byTrajtenberg (1990)for the case of US patents in computed tomography and it has been subsequently confirmed in a number of empirical studies both for US and European patents (seeSampat and Ziedonis, 2004 and van Zeebroeck, in pressfor useful surveys). Another indicator that is gaining popularity is the use of information on thefiling of legal oppositions or on patent litigations (Harhoff et al., 2003; Allison et al., 2004). The rationale underlying the use of this information is the idea that oppositions and legal disputes will tend to revolve around patents of higher economic value.2
In this paper, we study the feasibility of employing an approach similar to the contemporary practice of constructing citation-based indicators of patent quality to the case of the English patent system in the Industrial Revolution period. The English patent system of the time did not prescribe the use of citations to previous patents for defining prior art. Therefore, we should look for an alternative historical source suitable of being used for constructing a plausible proxy for the value of patents.
3. Bennet Woodcroft and the Reference Index
Before the reform of 1852, a patent application could be lodged in anyone of these three Public Offices in London: Rolls Chapel Office, Petty Bag Office and Enrolment Office. In this way patent specifications were dispersed in three different locations. Furthermore, the system also lacked an effective search catalogue providing easy access to the specifications of existing patents. This was seen as an important problem: for an inventor was almost impossible to have a clear picture of the state of art covered by existing patents (Gomme, 1946; Hewish, 2000).
From the early 1830s, several patent agents had begun to construct lists and indexes of existing patents. With the reform of the patent system in 1852, the new Patent Office Commissioners decided to address this problem by funding a major publication of indexes and abridgments of the patents granted from 1617 to 1852. The Commissioners entrusted this task to Bennet Woodcroft, who had already been working on his own at the construction of patent indexes for specific industries such as steam navigation and textile machinery.3Woodcroft was probably the optimal choice for this task. He was energetic and his efforts were sustained
by a strong belief in the beneficial role of patents not only as a system of incentives for innovation, but also as a powerful “information system” for engineers (and also for historians).4
Woodcroft and his team of clerks undertook the construction of the system of indexes following a straightforward approach. Each patent was assigned a progressive number (on the basis of its date). Thefirst volume published was a Chronological Index, followed by an Alphabetical Index and this in turn was followed by a Subject Index. These three indexes provided an indispensable
1Thefindings ofMacLeod et al. (2003)suggest a cautionary attitude towards the use of renewal data. In their study theyfind that many potentially valuable
steam engineering patents were not renewed (this was most probably due to the limitedfinancial resources of many patent holders). Vice versa, even some technically impossible inventions were kept in force for the full patent duration.
2
A third approach in this stream of literature is the estimation of patent values by means of econometric models linking the market value offirms to their patent portfolio (seeBessen, 2009for a recent example). Also this approach is not feasible for the period of thefirst industrial devolution because the large majority of example were owned by individuals.
3Bennet Woodcroft (1803–1879) was himself a talented inventor, who took several patents (at least two of major technical importance). During his life, he
enjoyed friendships with some of the most important engineers of the time such as J. Whithworth, J. Nasmyth and R. Roberts. In 1843 he opened in London an office as patent agent and consulting engineer. In 1847 he was appointed professor of machinery at University College. In 1852 with the passing of the Patent Law Amendment Act, Woodcroft was appointed assistant to the commissioners. He was in charge of the publication of all the specifications of patents for the period 1617–1852 together with the relative series of indexes. On Woodcroft's life and achievements, seeHewish (1982) and Harrison (2006, pp. 55–66).
4
In 1851 Woodcroft in front of the Select Committee of the House of Lords on patent laws insisted on the advantages of implementing an effective index system and of printing the full patent specifications: “Anyone who had the ambition to become the historian of inventions, could not do better than take such a work on patents, because he would there not onlyfind the true course of inventions, but he would also find every futile effort made in that direction…..It would be the most valuable encyclopaedia of invention ever published” (House of Lords, 1851, p. 403). For an account of the publication of Woodcroft's indexes, against the background of contemporary debates on the reform of the patent system, seeMacLeod (2007, pp. 251-264).
orientation in thefield for would-be patentees. The usefulness of these sources is also confirmed by the very intense use that historians of technology have done of this material. The set of indexes was completed in 1855 by the publication of the Reference Index (Hewish, 2000, p. 35–36). The index is structured in chronological/numerical order and for each patent it reports the office of enrolment where the specification was filed. Additionally, for each patent, the index gives a list of references providing information on the patent in question. These references comprise mentions in technical journals and books, law commentaries and reports, Record Office reports and other official publications such as Parliamentary Select Committees.5Remarkably, this source so
far has received very little attention by historians (to the best of our knowledge the index so far has only been employed by Dutton for examining the outcome of a number of legal disputes over patents, 1984, pp. 78–79).6
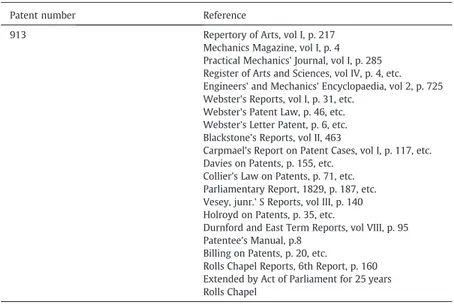
A typical entry of Woodcroft's Reference Index is represented inTable 1. The patent in question is the one granted in 1769 to James Watt for the separate condenser. The entry gives references to the technical and legal literature where the patent is mentioned, while the last line of the table indicates in which office the specification was lodged (in this case Rolls Chapel).Table 2 provides the example of another entry. This is for a patent covering an improvement in the Newcomen engine developed by William Symington. This was surely a valuable invention, but whose economic and technological significance was relatively minor in comparison to Watt's separate condenser.7For this patent, as one would have expected, the Reference Index contains a much lower number of references.
Table 3contains a list of all publications that were referenced more than 10 times in Woodcroft's Reference Index over the period 1617–1841. In order to illustrate the changing coverage of different publications over time, the columns of the table show the number of references for different subperiods, each of these covering a time interval during which 2000 patents, chronologically arranged, were granted. For example thefirst column contains the number of references for patents from number 1 to number 2000 (granted over the period 1617–1794). The last column gives the total number of reference throughout the entire period 1617–1841. Overall, the publications used in the compilation of Woodcroft's Reference Index can be classified in three broad categories: i) publications reporting latest developments in science and technology (in particular those embodied in patents recently granted), ii) engineering journals and books containing discussion of merits and limitations of specific technical solutions, iii) legal commentaries on patent laws and cases. We should note that this classification gives just a preliminary orientation to the contents of Woodcroft's Reference Index and that in several cases a specific publication may be not straightforwardly classified in one of the three categories. Thefirst category contains specialized journals edited by patent agents that published regularly selections of patent specifications.8
This specialized literature represented an important channel of information fuelling the emergence of the market for patented inventions identified byDutton (1984)in thefirst half of the nineteenth century. The first important publication of this kind was the Repertory of Arts and Manufactures,first published in 1794, whose aim was to establish “a vehicle, by means of which new discoveries and improvements in Arts and Manufactures, may be transmitted to the public”. The
5
Therefirst edition of the Reference Index was published in 1855. A second edition based on a slightly more extensive number of references was published in 1862. In this paper we use this second edition.
6The publication of these indexes was followed by a further attempt to summarize and classify by subject all the existing patent specifications by publishing a
series of volumes Abridgments of Patent Specifications. Each of these volumes contained a succinct description of all the patent specifications pertaining to specific technological subject.
7On Symington's improved Newcomen engine design, seeHarvey and Downs-Rose (1974). 8
SeeHarrison (2006, pp. 224–226)for an overview of the publishing activities of some early patent agents. Table 1
Entry in Woodcroft's Reference Index for James Watt's patent of the separate condenser. Patent number Reference
913 Repertory of Arts, vol I, p. 217 Mechanics Magazine, vol I, p. 4 Practical Mechanics' Journal, vol I, p. 285 Register of Arts and Sciences, vol IV, p. 4, etc. Engineers' and Mechanics' Encyclopaedia, vol 2, p. 725 Webster's Reports, vol I, p. 31, etc.
Webster's Patent Law, p. 46, etc. Webster's Letter Patent, p. 6, etc. Blackstone's Reports, vol II, 463
Carpmael's Report on Patent Cases, vol I, p. 117, etc. Davies on Patents, p. 155, etc.
Collier's Law on Patents, p. 71, etc. Parliamentary Report, 1829, p. 187, etc. Vesey, junr.' S Reports, vol III, p. 140 Holroyd on Patents, p. 35, etc.
Durnford and East Term Reports, vol VIII, p. 95 Patentee's Manual, p.8
Billing on Patents, p. 20, etc. Rolls Chapel Reports, 6th Report, p. 160 Extended by Act of Parliament for 25 years Rolls Chapel
editors noted that a selection of“specifications of patents will form a considerable, and, it is presumed, interesting part of this work.” (Anon., 1794, pp. i–ii). In the 1820s two noteworthy new journals that published regularly selections of patent specifications were launched: the London Journal of Arts and Sciences edited by William Newton, whose declared goal was to publish the“earliest information relative to every useful discovery and invention in practical mechanics, as well as such other novel inventions as are applicable to the arts, manufactures and agriculture” (Newton, 1820, p. i) and the Register of Arts and Sciencesfirst issued in 1824, that had similar editorial scope. Finally, The Inventors' Advocate and Patentee Recorder first issued in 1839 aimed to become“an efficient medium of communication between inventors, patentees, capitalists and the public at large”. In terms of contents, the journal set itself the task to give its readers“earliest, and exclusive information with matters connected with science and art, discoveries and inventions”. The journal would publish the full specification of the “most important” patents (Anon., 1839, p. 1). The second category contains engineering journals and books that did not limit themselves to summarize the contents of patents, but discussed in more depth the merits and limitations of the technical solutions contained in some patented inventions. For example, Luke Hebert, a famous patent agent, with the The Engineer's and Mechanic's Encyclopedia intended to offer a“judicious selection of all those machines, engines, manipulations, processes and discoveries, that now lie scattered throughout several hundreds of volumes of the scientific journals or are inscribed in obsolete characters upon the rolls of the Court of Chancery in the form of specifications of patent inventions” (Hebert, 1836, p. ii). Mechanics' Magazine and The Artizan can be regarded as journals that falls in this category. The aim of Mechanics' Magazine was“to promote a better acquaintance with the history and principles of the arts” together with “earlier information…of new discoveries, inventions and improvements” (Anon., 1823). Technical treatises covering specific technology fields such as Ure's Cotton Manufacture and Stuart's History of the Steam Engine also belong to this second category. The third category comprises publications that were clearly more aimed to be digests of patent cases, such as the famous patent treatises by Carpmael, Holroyd and Webster. However, even in these publications, legal
Table 2
Entry in Woodcroft's Reference Index for William Symington's patent of an improved Newcomen engine design.
Patent number Reference
2544 Mechanics' Magazine, vol XVII, p. 385, etc. Rolls Chapel Reports, 6th Report, p. 151 Rolls Chapel
Table 3
Publications with most references in Woodcroft's Reference Index.
Publications 1–2000 [1617–1794] 2001–4000 [1794–1816] 4001–6000 [1816–1830] 6001–8000 [1830–1839] 8001–9210 [1839–1841] Total
London Journal of Arts and Sciences (Newton's; London, 1820) 0 2 1330 1290 463 3085 Repertory of Arts and Manufactures (5th series, London, 1794) 169 931 1124 833 335 3392 Rolls Chapel Reports, 6th, 7th and 8th 738 968 360 245 0 2311 Mechanic's Magazine (London, 1823) 32 22 194 249 641 1138 Inventors' Advocate and Patentees' Recorder (London, 1839) 0 0 0 38 901 939 Register of Arts and Sciences (2nd series, London, 1824) 23 35 602 212 1 873 Engineers' and Mechanics' Encyclopaedia (by Luke Hebert,
London, 1836)
30 44 315 102 0 491
Carpmael's Patent Cases (Reports) 25 36 44 25 1 131
Webster's (Reports) 22 20 44 41 5 132
Webster's Patent Law (a Treatise) 22 28 32 23 1 106 Billing on Patents (a Treatise) 13 18 36 28 5 100 Engineers' and Architects' Journal (London, 1837) 1 2 6 45 100 154
Law Journal (Reports) 0 2 13 27 18 60
Parliamentary, 1829 Patent Law (Reports) 15 26 17 0 0 58 Artizan. A Monthly Journal of Operative Arts (London, 1843) 2 4 7 17 17 47 Patentees Manual (by Henry Johnson, London, 1853) 6 10 12 7 2 37 Ure's Cotton Manufacture (London, 1836) 6 6 23 10 0 45 Websters Letters Patent (London, 1848) 6 9 14 5 0 34 Patent Journal and Inventor's Magazine (London, 1846) 0 0 5 24 12 41 Holroyd's on Patents (a Treatise) 12 15 4 0 0 31
Jurist (Reports) 0 1 4 15 11 31
Law Times (Reports) 0 2 3 12 12 29
Davies on Patents (Reports) 16 9 0 0 0 25
Practical Mechanics' Journal (Glasgow, 1848) 2 0 2 8 14 26 Stuart's History of the Steam Engine (London, 1825) 7 7 4 0 0 18 Moore's Privy Council Cases (Reports) 0 0 4 9 3 16 Transactions of the Society of Arts 0 0 0 5 10 15
Meeson and Welsby's (Reports) 0 1 5 5 2 13
considerations were often interwoven with technical discussions. Overall,Table 3indicates that the bulk of the publications used in the compilation of the Reference Index is largely of technical nature (either specialized journals publishing systematically selections of patent specifications or more elaborated technical commentaries of specific patents). The extension of this publishing activity suggests that, even if before 1852 patent specifications were of difficult access because dispersed in three different offices, a considerable amount of the technical information embodied in patent specifications was actually placed in the public domain by virtue of the growth of this specialized literature that reported and discussed the contents of patents (Mokyr, 2009, p. 409; Moser, 2010).
We suggest that the number of references listed in Woodcroft's Reference Index provides a good indication of the“visibility” of a specific patent in the contemporary technical and legal literature. In this paper we study the feasibility of constructing an index of the economic value of patents based on the number of references listed in Woodcroft's Reference Index.9Our assumption is that
patents which are more significant from a technical point of view will tend to be cited more often in the technical literature. Furthermore, we also assume that patents with high economic importance will be more likely to become the subject of legal controversies. Thus, we propose that the number of references listed in Woodcroft's Reference Index can serve as a reasonable proxy of the economic value or“quality” of the patent.10This approach is obviously analogous to the use of patent citations as
proxy for the economic value of patents adopted in the modern literature on innovation. On reflection, there are two main limitations of the Reference Index as indicator of patent value when compared to patent renewals and citations. With respect to renewals, the number of references has the disadvantage of not being a metric susceptible of a straightforward economic interpretation, whereas renewals provide a direct assessment of patent values in monetary terms. With respect to patent citations, the number of references has the disadvantage of being a composite indicator of the visibility of a patent in the contemporary specialized literature (i.e., publications can mention the same patent for different reasons). Instead patent citations are the outcome of a fairly“regulated” search process aimed at defining the prior art of the patented invention. However, in comparison to modern patent citations, the number of references in the Reference Index has the advantage of being the product of a relatively homogenous source (Woodcroft and his team of clerks), whereas modern patent citations are generated by heterogeneous sources (inventors, patent attorneys and patent examiners). Furthermore, it is also increasingly recognized that citing behavior in modern patent systems is affected by strategic considerations, e.g. an inventor may be reluctant to cite a patent that may disrupt some novelty claims. This problem, instead, is not present in the case of the Reference Index. In fact, it is worth noting that the nature of the references of the Reference Index is more similar to that of citations in modern scientific literature than to contemporary patent citations.11In this sense, our approach is akin to bibliometric studies providing assessments of the importance of a scientific paper on the basis of the citations received in the subsequent literature.
9A similar exercise has been carried out bySullivan (1989, pp. 431–433). His quality indicator is simply the number of different classes in which a patent is
listed in Woodcroft's Subject Index. This would be analogous to the count of patent classes in contemporary patents, so in our view, it should be properly considered a measure of generality rather than of quality (Jaffe and Trajtenberg, 2002).
10
The Reference Index volume was prepared in the early 1850s. This means that Woodcroft and his team of clerks, due to lack of hindsight, may have faced more difficulties in preparing accurate and complete list of references for the most recent patents. In order to minimize this problem, in this paper we restrict our analysis to the period 1617–1841. This means that each patent in our sample can at least enjoy a period of ten years for becoming “fully visible” in the technical and legal literature.
11On strategic considerations affecting citing behavior in patents, seeLampe (2010)and for cautionary considerations on the use of patent citations as
indicators of patent value, seeBessen (2008)).
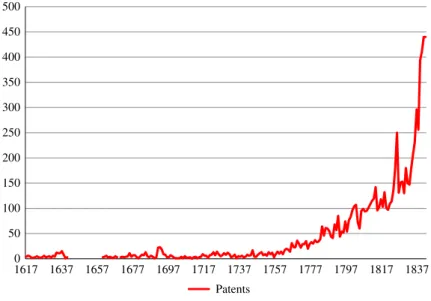
0 50 100 150 200 250 300 350 400 450 500 1617 1637 1657 1677 1697 1717 1737 1777 1797 1817 1837 Patents 1757
4. The construction of the patent quality indicator
Our approach is to assign to each patent a quality score that is equal to the number of references listed in Woodcroft's Reference Index. In our sample, this indicator has a lower bound of 0 (patents with no references and for which the index contains only information concerning the public office in which the specification was lodged) . We will refer to this indicator as Woodcroft Reference Index (WRI).12
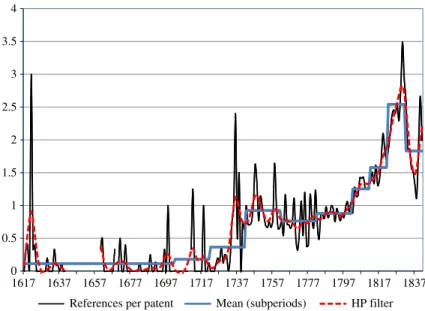
Fig. 1shows the annual number of granted patents over the period 1617–1841. The gap in the series corresponds to the period of the civil war, Commonwealth and the Protectorate (1641–1660) when the patent system was practically dismantled and no patents were granted (MacLeod, 1988, p. 16).Fig. 2displays the yearly average number of references per patent in Woodcroft's Reference Index as a thin line.Fig. 2also shows as a thick line the average number of references for the following subperiods: 1617– 1701, 1702–1721, 1722–1741, 1742–1761, 1762–1781, 1782–1801, 1802–1811, 1812–1821, 1822–1831, 1832–1841 and as a dotted thick line the yearly average number of references smoothed using the Hodrick–Prescott filter.13It is quite clear that the
time series of the yearly average number of references shows a cyclical behavior around an upward trend, revealing a propensity of more recent patents to be mentioned in a higher number of references. This increase in the number of references reflects both the sustained expansion of the English literature on science and technology taking place during the eighteenth and early nineteenth century (Mokyr, 2009, pp 46–48) and the growth of the specialized literature on patents, also related to the growing public awareness of the working of the patent system (MacLeod, 1988, pp 146–147). Clearly, if one were to use simply the number of references as indicator of patent quality when comparing patents granted in different years, he could obtain results that are possibly biased by the variations over time in the number of references per patent.14This type of problem is indeed present in
12
Thus, going back to the examples ofTables 1 and 2, patent 913 is assigned a WRI score of 20 and patent 2544 a WRI score of 2.
13We have used a parameter of 6.25 for the Hodrick–Prescott filter as suggested byRavn and Uhlig (2002).
14The growth in the average number references per patent is mostly accounted for the increasing number of specialized periodicals reporting and commenting
the specifications of selections of contemporary patents.
0 0.5 1 1.5 2 2.5 3 3.5 4 1617 1637 1657 1677 1697 1717 1737 1757 1777 1797 1817 1837
References per patent Mean (subperiods) HP filter
Fig. 2. Average number of references per patent (yearly and subperiods).
Table 4
Spearman rank correlation matrix of differentfixed-effects adjustments. Woodcroft (raw) Adjusted Woodcroft (yearly mean) Adjusted Woodcroft (mean subperiods) Adjusted Woodcroft (HPfilter) Adjusted Woodcroft (Goldsmith Kress Library) Woodcroft (raw) 1 Adjusted Woodcroft (yearly mean) 0.8256 1 Adjusted Woodcroft (mean subperiods) 0.8748 0.9384 1
Adjusted Woodcroft (HPfilter) 0.8722 0.9717 0.9782 1 Adjusted Woodcroft
(Goldsmith Kress Library)
0.8266 0.8285 0.8966 0.8803 1
modern patent data. Also in this case the propensity to cite other patents is not constant over time. For example, the computerization of patent databases during the 1980s enhanced the search of prior art for inventors and patent examiners leading to an increase in the average number of citations per patent (Hall et al., 2002, p. 418–419). A common way to solve this issue is to divide the citations received by a given patent by the mean of citations received by all patents belonging to the same time cohort. This means using as a benchmark citation intensity for assessing the quality of an individual patent, the average number of citations received by patents of the same time cohort. This procedure is usually referred to as“fixed effects” approach (Hall et al., 2002, pp 437–441). Here we adopt the same type of adjustment by dividing the number of references of each individual patent for the average number of references received by all patents in the time cohorts corresponding to thefixed subperiods used for the drawing the thick line ofFig. 2. This is our adjusted indicator of the economic value of patents, which we shall call adjusted Woodcroft Reference Index (WRI*).
As afirst step, it is important to check how sensitive the quality indicator is to the choice of the time intervals employed for benchmarking the reference intensity.Table 4reports the Spearman rank correlations matrix between patents whose quality has been measured using different types offixed-effects adjustments. The first column (“Woodcroft raw”) refers simply to patents whose quality was measured by the“raw” number of references without any type of adjustment, the second column refers to patents whose quality was measured using as benchmark the yearly average number of references, the third column refers to patents whose quality was measured using as benchmark the average number of references for thefixed subperiods ofFig. 2, the fourth column refers to patents whose quality was measured using as benchmark the time series of the yearly average number of patents smoothed using the Hodrick– Prescottfilter, the fifth column refers to patents whose quality has been measured by dividing their number of references by the number of publications retrieved in the Goldsmiths'-Kress Library of Economic Literature using the keyword“patent” in the publication years corresponding to thefixed subperiods ofFig. 2.15The Goldsmiths'-Kress Library is one of the largest collections of publications in
English covering the period 1450–1850. It is important to note that, notwithstanding its title, the collection is not restricted only to economic subjects, but it contains a large amount of engineering publications and legal treatises (including most publications listed in Table 3). Therefore, the aim of this last column is to examine the effects of a benchmark that does not reflect only the variations over time of the references in Woodcroft's index, but instead captures the more general trends in the broad literature (books and journals) related to patents.Table 4shows that all indicators of patent quality calculated using more sophisticated adjustment procedures appear strongly correlated with each other. Furthermore, even the simple“raw” counting of the number of references is strongly correlated with the indicators calculated using the more sophisticated adjustment procedures. The main reason for this result is that historically significant patents (such as James Watt's patent for the separate condenser) have, in comparison to all other patents, a significantly higher number of references. For this reason, even withoutfixed-effects adjustment, they will receive a high quality score even when compared to patents belonging to later time cohorts characterized by higher average reference numbers. Overall, the results ofTable 4 indicate that the use of different approaches for benchmarking the reference intensity is not likely to have major effects on the relative assessment of patents (in the sense that the different approaches will tend to single out highly overlapping groups of patents as those with a high quality). In the rest of this paper we will use the time cohorts corresponding to thefixed subperiods ofFig. 2to construct our quality indicator adjustment using thefixed-effects procedure.Table 4also suggests that the use of a quality indicator based number of references is better suited for the identification of groups of high quality patents, rather than as a precise index for measuring the quality of individual patents. Accordingly, in this paper we will employ the quality indicator to study the characteristics of patents belonging to different quality percentiles (limiting in this way the impact of measurement errors at the level of individual patents). 5. Assessing the reliability of the patent quality indicator
To substantiate the reliability of the indicator of patent quality based on Woodcroft's Reference Index we need to compare it with some independent measure of patent quality. To perform this task, we will construct four lists of“important patents” that can be used to validate our patent quality indicator.
Khan and Sokoloff (1993)havefirst used inclusion in biographical dictionaries as a method for identifying “great inventors” (i.e., those responsible for the most historically significant inventions) in the US case. More recentlyKhan and Sokoloff (2008)have carried out a comparative study of American and British“great inventors” using the same method.Khan and Sokoloff (2008)have constructed their British sample of“great inventors” using the 2004 edition of the Dictionary of National Biography (DNB). Here we will follow this type of approach and consider patents awarded to inventors included in the Dictionary of National Biography as of particular historical significance. In our period of interest, we have been able to retrieve 218 patentees whose biographical profile is included in the DNB. These inventors were responsible for 723 patents. This is ourfirst list of “important patents”.
15
We have retrieved the number of publications using the search catalogue of the digital edition of the Goldsmiths'-Kress Library published by Gale publishing. Table 5
Overlap between DNB, Allen and Baker patents.
DNB Allen“Great Inventor” Allen“Macro Inventor” Baker
DNB 723 104 26 55
Allen“Great Inventor” 133 27 32
Allen“Macro Inventor” 27 12
Allen (2009, pp. 242–271)has also recently constructed two samples of British“great inventors” with a specific focus on the economic significance of the inventions they produced. Allen's first list of “great inventors” has been constructed by considering all the inventors active in Britain between 1660 and 1800 mentioned inSinger et al. (1957, 1958). This sample has been integrated also consideringMokyr (1990) and Mantoux (1928). This list contains 54 inventors that were responsible for 133 patents in total. Allen's second list of inventors is more restricted and contains 10“superstar” inventors that can be regarded as responsible for genuine“macroinventions” in the sense ofMokyr (1990). These“macro inventors” were responsible for 27 patents. Allen's lists of “great” and “macro” inventors are the sources of our second and third list of “important patents”.
Another interesting source for the identification of important patents isBaker (1976). Baker's list is meant to include the“most important” patents granted in Britain over the period 1691–1971. An initial selection was originally compiled by the staff of the enquiry desk of the British patent office in the early 1970s. This selection was extended by Baker through an extensive search in the technical and historical literature (Baker, 1976, pp. 7–25). Baker's list of important patents has been employed byKleinknecht (1987) and Silverberg and Verspagen (2003)for testing the Schumpeterian hypothesis of the existence of temporal clusterings of radical innovations. In our period of interest, we have 137 patents belonging to the Baker list. This is our fourth list of“important patents”. Table 5shows that there is an imperfect overlap between the lists of patents identified using the DNB, Allen's two lists of inventors and the Baker list. InTable 5, the diagonal cells contain the total number of patents in each of these lists. Cells outside the diagonal instead contain the number of patents that are included simultaneously in two lists. The most significant differences are clearly between the Baker list and the other great inventor lists (both DNB and Allen's). In particular, respectively 60% (i.e., 82 patents) and 77% (i.e., 105 patents) of the patents in the Baker list are not included in the DNB list and the Allen's lists. In this perspective, these lists of“important patents” seems to reflect a number of relatively independent assessments of the historical significance of inventions and, for this reason, they can be an interesting yardstick for gauging the reliability of our indicator of patent quality.
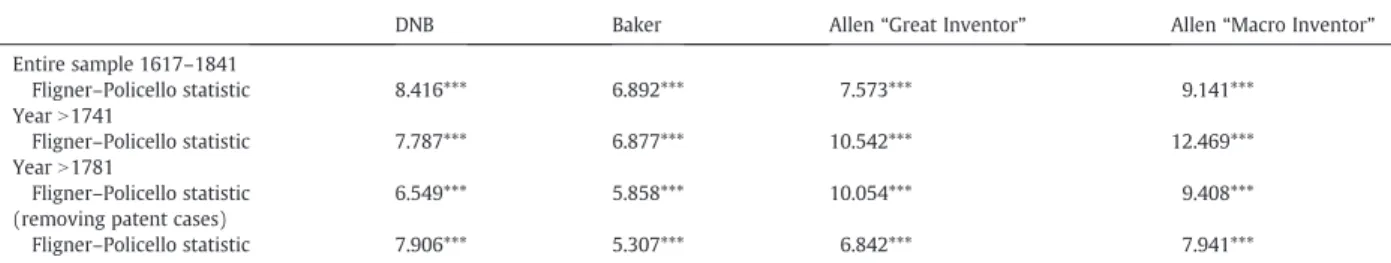
Ourfirst step is to check whether there are significant differences in the quality scores between patents included in our four lists of“important patents” and the rest of the sample. This is done by performing the non-parametric test of stochastic equality suggested byFligner and Policello (1981), which is particularly suited for our case in which we must compare samples of different numerosity possibly characterized by non normal distributions of unknown shape. Given two random variables X and Y, the Fligner–Policello statistic determines whether the Prob [XNY]N0.5. In other words, the Fligner–Policello statistic reveals whether by randomly selecting two patents, one from the“important patents” list and one from the rest of the sample, the probability that the patent from the“important patents” list has a higher quality score measured using WRI* is higher than 0.5.16
Table 6contains the results of these Fligner–Policello tests of stochastic equality for the four different lists of “important patents”. The first row ofTable 6reports the results for the period 1617–1841. We perform these tests of stochastic equality also for subsets of our total patent sample. The second row ofTable 6considers only patents granted after 1741. In this way, we want to remove from the sample the erratic procedures of the early patent system. In particular, in the early period, patentees were asked only to provide a cursory description of the invention. Thefiling of a complete written description of the invention (specification), became established practice only in the 1730s (MacLeod, 1988, pp. 48–49). The third row considers only patents granted after 1781. With this third subset we would like to control for the effect of Liardet vs Johnson (1778) decision that established that the specification should enable anyone skilled in the art to construct the invention. After this decision the specification was definitely recognized as a fundamental aspect for the legal validity of the patent (MacLeod, 1988, p. 49). Thefinal row considers all patents excluding those subjected to trials in court.17Since patent lawsuits were very costly (MacLeod, 1988, pp. 58–74), it seems unlikely that patents of minor economic importance were subjected to extensive litigation. Hence, references discussing legal issues may be expected to be related to the economic value of patents. In this sense, it seems appropriate to have an indicator that combines references to technical and legal literature (also because in several cases it is difficult to classify precisely the nature of the source used in the index). On the other hand, patents subjected to court trials can attract references because the lawsuit in question represented an important legal precedent, rather than by virtue of their technological significance, so by removing these patents from the sample we may expect to have a more restricted set of patents in which the distribution of references is reflecting, to a major degree, the genuine technological content of the patents, rather than legal issues. Therefore it is surely important to check
16As a robustness check we have also carried out the Mann–Whitney–Wilcoxon test, which is the traditional test to assess the equality of medians between two
samples, obtaining results that are fully consistent with those ofTable 6.
17
A list of patents subjected to court trials is provided inWoodcroft (1862, pp. 669–710). Table 6
Fligner–Policello tests of stochastic equality.
DNB Baker Allen“Great Inventor” Allen“Macro Inventor” Entire sample 1617–1841 Fligner–Policello statistic 8.416*** 6.892*** 7.573*** 9.141*** YearN1741 Fligner–Policello statistic 7.787*** 6.877*** 10.542*** 12.469*** YearN1781 Fligner–Policello statistic 6.549*** 5.858*** 10.054*** 9.408*** (removing patent cases)
Fligner–Policello statistic 7.906*** 5.307*** 6.842*** 7.941*** *,**,*** indicate significance levels of 10%, 5%, 1%.
whether the relationship between the quality indicator and the“important patents” is confirmed also for this restricted set of patents depurated by lawsuits.
The results presented inTable 6provide afirst validation for the construction of quality weights based on the Reference Index. In all cases, the hypothesis of stochastic equality is rejected at a significance level of 1%, indicating that the patents belonging to the list of important patents have a higher probability of assuming higher quality scores than patent in the rest of the sample.
The second approach we adopt in order to examine the relationship between“important patents” and the quality index is to consider our lists of“important patents” as a “treatment” and to examine whether patents that receive this type treatment have a higher odds of being in the highest percentiles of the distribution of our quality indicator, WRI*. In particular, we consider three cases: patents with values that are in the top 50%, 10% and 1% percentiles of the distribution of WRI*.18Also in this case we perform
this exercise for different selections of the patent sample. The results are displayed inTable 7. The table shows in all cases odds-ratios that are greater than 1 (an odds-ratio of 1 indicates that the odds of a patent of being in the high percentiles quality group is the same for patents in the“important patents” lists and in the rest of the sample) and all significant at the 1% level. This means that patents that are in the lists of important patents have consistently a much higher probability to appear in the three outcome groups (top 50%, top 10% and top 1%) than patents that are not included in the lists. Note that the value of the odds-ratios are higher when we consider as outcome the inclusion of the patent in the top 1% percentile of the quality distribution.
The positive relationship between“important patents” and the quality indicator is also obtained through multivariate analysis that controls for the possible influence of other factors. In this case, our dependent variable is the number of references listed for each patent in Woodcroft's Reference Index. As we have mentioned, WRI is an integer number that can take values between 0 and the maximum number of references. Thus, the appropriate estimation technique is a negative binomial regression. Our covariates are the following:
i) Dummy variables indicating whether the patentee is a DNB inventor, Allen“Great Inventor”, Allen “Macro Inventor” or the patent is in the Baker list.
ii) Engineer: a dummy variable indicating whether the occupation of at least one of the patentees is related with engineering type of trades.
iii) Number of inventors: a variable indicating the number of inventors.
iv) Patent experience: a dummy variable indicating whether at least one of the patentees had already been granted at least a patent before the one in question.
v) Foreign communication: a dummy variable indicating whether the patent is the outcome of a communication from abroad.
18
SeeAgresti (2002, pp. 36–104)for an introduction to the use of odds-ratios in case–control data. Table 7
Odds-Ratios of“important patents” of being in high WRI* percentiles.
Treatment
DNB Baker Allen“Great Inventor” Allen“Macro Inventor” Entire sample 1617–1841 Outcomes Odds-Ratios WRI* (top 50%) 1.625*** 2.909*** 3.964*** 22.846*** WRI* (top 10%) 2.336*** 4.220*** 3.894*** 5.684*** WRI* (top 1%) 4.641*** 12.248*** 13.933** 24.326*** YearN1741 Outcomes Odds-Ratios WRI* (top 50%) 1.525*** 2.774*** 6.334*** 22.729*** WRI* (top 10%) 2.240*** 3.986*** 4.164*** 11.163*** WRI* (top 1%) 5.076*** 12.098*** 13.420*** 33.647*** YearN1781 Outcomes Odds-Ratios WRI* (top 50%) 1.543*** 2.809*** 9.253*** 28.547*** WRI* (top 10%) 1.979*** 3.831*** 4.283*** 9.172*** WRI*(top 1%) 3.697*** 13.919*** 9.269*** 27.181*** (removing patent cases)
Outcomes Odds-Ratios
WRI*(top 50%) 1.543*** 2.528*** 3.853*** 20.317*** WRI* (top 10%) 2.183*** 3.373*** 3.908*** 9.976*** WRI* (top 1%) 14.712*** 64.496*** 62.281*** 40.523*** *,**,*** indicate significance levels of 10%, 5%, 1% (chi-squared test for Odds-Ratios different from 1).
vi) Metropolitan: a dummy variable indicating whether the residence of at least one of the patentees is in a town with more than 50,000 inhabitants.19 Information on patentees' occupations, number of inventors, previous patents, foreign
communication and patentees' addresses were all retrieved from Woodcroft's Chronological Index (Woodcroft, 1854). Information on town sizes was retrieved fromWrigley (1985)andMitchell and Deane (1962).
vii) Insider: a dummy variable indicating whether the invention patented is related with the occupation of the patentee (e.g., a medicine for physician or a plough for a farmer). Note that the variable has been constructed in such a way to consider only the cases in which the inventor was clearly connected with the occupation of the patentee. When this dummy variable takes a value of 0 this does not mean that the inventor in question is an outsider, but simply that it was not possible to establish with full certainty whether he was an insider in relation to the subject matter of the patent in question. Given the degree of uncertainty in the definition of the variable, we should obviously interpret the estimates of this coefficient with caution. On the basis of the description of the invention contained in Woodcroft's Chronological Index (Woodcroft, 1854), we have also classified patents in 21 industries (agriculture, carriages, chemicals, clothing, construction, engines, food, furniture, glass, hardware, instruments, leather, manufacturing, medicines, metallurgy, military, mining, paper, pottery, shipbuilding, textiles).20
This classification is very similar to the one adopted byMoser (2010). We include in the regressions, dummy variables for controlling for industry effects (textiles is the base reference) and we use time dummies for controlling for the rise over time in the number of references per patent. For the time dummies we have adopted the same subperiods used for computing the adjusted index (WRI*). In this case the period 1832–1841 is the base reference.
The results of the negative binomial regressions are reported inTable 8. The coefficients of the dummy variables related to significant patents (DNB, Allen “Great Inventor”, Allen “Macro Inventor”, Baker) are all positive and significant. Furthermore, as one would have expected, the coefficient for Allen's more restricted list of “Great Inventors” is higher than the one for DNB inventors and, in turn, the one for the“Macro Inventors” is higher than the one for Allen's great inventor list. Concerning the other variables, in some specifications the variable “engineer” appears to be positive and significant. This finding is consistent with the literature that pointed to mechanical engineering as the critical innovative sector of thefirst Industrial Revolution (von Tunzelmann, 1995, pp. 104–122). In some specifications, the variable “foreign communication” is significant with a negative sign suggesting that patented inventions that were imported from abroad were not of particularly high quality. Finally, the coefficient of the “insider” variable is negative and significant which seems to indicate that the inventions produced by “insiders” were of somewhat minor quality relatively to the rest. In
19We have also carried out estimations defining the variable “metropolitan” in terms of residence in towns with more than 100,000 inhabitants, obtaining
analogous results.
20In our sample of 9210 patents covering the period 1617-1841, we have not been able to assign only 11 patents to a specific industry due to unclear or
insufficient description of the invention. Table 8
Determinants of Woodcroft Reference Index (1617–1841).
(1) (2) (3) (4) (5) (6) DNB inventor 0.352*** 0.356*** (0.0460) (0.0461) Number of inventors 0.00366 0.00525 0.0143 0.00589 0.00682 0.00275 (0.0290) (0.0291) (0.0289) (0.0287) (0.0291) (0.0291) Previous patents −0.0243 −0.00775 0.00182 0.00867 0.0132 −0.0224 (0.0218) (0.0210) (0.0208) (0.0208) (0.0212) (0.0218) Engineer 0.0184 0.0273 0.0456* 0.0381 0.0481* 0.0244 (0.0264) (0.0268) (0.0264) (0.0262) (0.0265) (0.0262) Foreign Communication −0.0438 −0.0630* −0.0645* −0.0673* −0.0625* −0.0497 (0.0370) (0.0371) (0.0371) (0.0365) (0.0371) (0.0372) Metropolitan −0.0201 −0.0152 −0.0132 −0.0222 −0.0194 −0.0216 (0.0208) (0.0207) (0.0208) (0.0206) (0.0209) (0.0211) Allen“Great Inventor” 1.015***
(0.120)
Allen“Macro Inventor” 1.667*** (0.255) Baker patent 0.894*** (0.107) Insider −0.0391* (0.0211) Constant 0.492*** 0.499*** 0.469*** 0.488*** 0.491*** 0.617*** (0.0508) (0.0503) (0.0501) (0.0505) (0.0510) (0.0389)
Time dummies Yes Yes Yes Yes Yes Yes
Industry dummies Yes Yes Yes Yes Yes No
Observations 9199 9199 9199 9199 9199 9210
Log-likelihood −13852 −13819 −13839 −13816 −13910 −13900 Pseudo R2
0.0836 0.0858 0.0844 0.0860 0.0798 0.0814 Note: negative binomial regressions (dependent variable is WRI), robust standard errors in parenthesis; *,**,*** indicate significance levels of 10%, 5%, 1%.
the modern innovation literature it has been indeed pointed out that radical innovations are frequently made by outsiders, who enjoy the advantage of an“uncommitted mind” and in this way have fresh insights on the possible solutions of specific technological problems (Jewkes et al., 1969). In the period we are considering, consistently with ourfindings,O'Brien et al. (1996)have contended that, in the textile industries, the most important inventions were made by outsiders who had a pre-professional interest (scientific and technological curiosity, fascination for mechanical contrivances, etc.) in invention, whereas the inventive activities of insiders were mostly of incremental nature (on the possible advantages of outsiders as inventors in this period, see alsoO'Brien, 1997). The results ofTable 8are also confirmed when performing the regression analysis on subsets of patents restricted to the periods 1742– 1841 and 1782–1841 (in order to remove the early periods in which the legal status of the specification was not fully developed) and on the subsets excluding the patents disputed in court cases (to limit the analysis only to the subsample of patents less likely to be mentioned in the legal literature). The results of these regressions are reported inAppendix (Tables A.1, A.2, A.3).
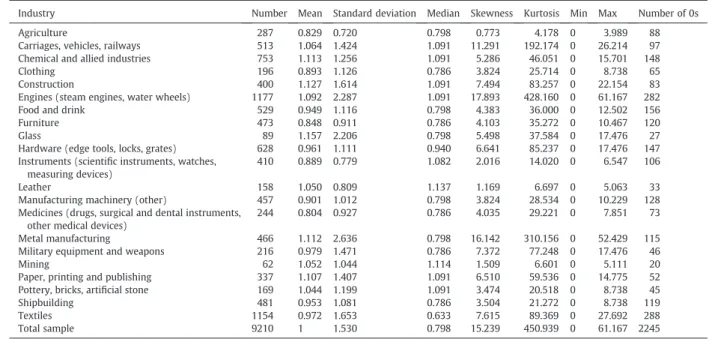
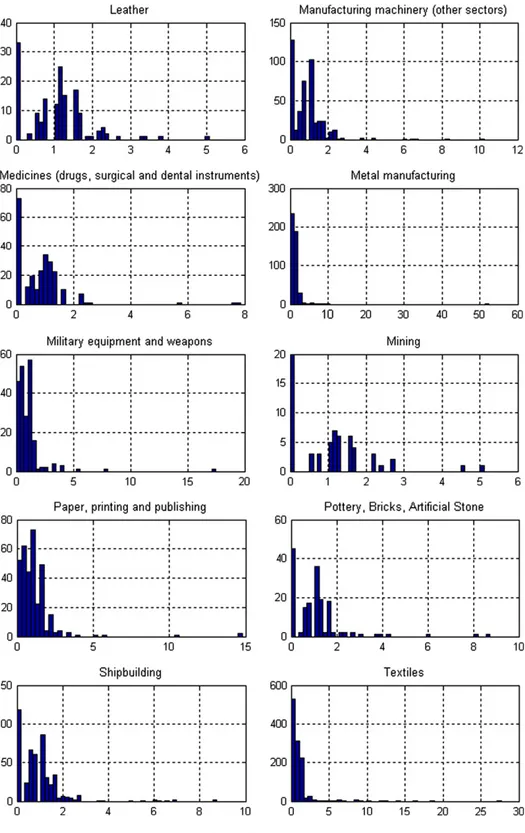
Table 9reports descriptive statistics for WRI*scores across industries.Table 9suggests the existence of systematic differences in WRI* scores across industries. This is particularly evident when looking at the median values and maximum values of the quality distributions.Fig. 3shows the distribution of WRI* across industries using histograms. All the distributions are right-skewed (this also confirmed by the summary statistics reported inTable 9).21This means that the majority of patents tend to be negligible (the
number of patents with WRI* = 0 is indicated in the last column) or of very low value and that only few patents have high quality scores. Further, all industrial sectors seems capable of producing at least some“high quality” patents, although “technological blockbusters” (patents with quality scores that are more than one order of magnitude higher than the time cohort average) are experienced only in a few sectors. This is fully in line with thefindings of the modern literature on the value of patents. All the modern indicators of patent quality (number of citations received, renewal data and survey data based on inventors' self-assessment) have sharply right-skewed distributions similar to those ofFig. 3(seeSilverberg and Verspagen, 2007for a thorough discussion). Notably, this holds also at the level of individual technology fields (Schankerman, 1998). Therefore, in our interpretation, the shape of the distribution of WRI* provides further corroboration of its plausibility as indicator of patent quality. 6. The distribution of high quality patents over time and across industries
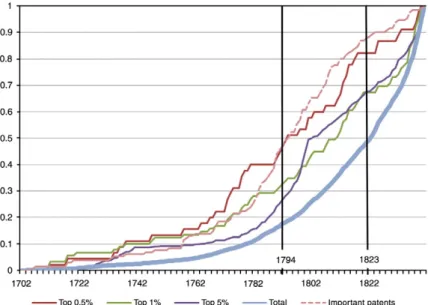
What are the implications of the indicator of patent quality based on Woodcroft's Reference Index for the debate concerning the timing and scope of the Industrial Revolution?Fig. 4charts the cumulative distribution of patents of different quality over time. The thin lines represent the cumulative distribution of patents that are in the top 0.5%, 1% and 5% percentiles in terms of their quality scores measured using WRI*. The thick line represents the cumulative distribution of the total number of patents.Fig. 4 may be interpreted as comparing the evolution over time of the stock of knowledge embodied in patented macroinventions (the top percentiles) and in patented microinventions (the total number of patents). The dotted line represents the cumulative distribution of a set of“important patents” (this set contains all the patents that have been mentioned in at least two lists of important patents used in the previous section: DNB, Allen“Great Inventor”, Allen “Macro Inventor” and Baker). We have plotted
Table 9
Descriptive statistics for WRI* (1617–1841).
Industry Number Mean Standard deviation Median Skewness Kurtosis Min Max Number of 0s Agriculture 287 0.829 0.720 0.798 0.773 4.178 0 3.989 88 Carriages, vehicles, railways 513 1.064 1.424 1.091 11.291 192.174 0 26.214 97 Chemical and allied industries 753 1.113 1.256 1.091 5.286 46.051 0 15.701 148 Clothing 196 0.893 1.126 0.786 3.824 25.714 0 8.738 65 Construction 400 1.127 1.614 1.091 7.494 83.257 0 22.154 83 Engines (steam engines, water wheels) 1177 1.092 2.287 1.091 17.893 428.160 0 61.167 282 Food and drink 529 0.949 1.116 0.798 4.383 36.000 0 12.502 156 Furniture 473 0.848 0.911 0.786 4.103 35.272 0 10.467 120 Glass 89 1.157 2.206 0.798 5.498 37.584 0 17.476 27 Hardware (edge tools, locks, grates) 628 0.961 1.111 0.940 6.641 85.237 0 17.476 147 Instruments (scientific instruments, watches,
measuring devices)
410 0.889 0.779 1.082 2.016 14.020 0 6.547 106 Leather 158 1.050 0.809 1.137 1.169 6.697 0 5.063 33 Manufacturing machinery (other) 457 0.901 1.012 0.798 3.824 28.534 0 10.229 128 Medicines (drugs, surgical and dental instruments,
other medical devices)
244 0.804 0.927 0.786 4.035 29.221 0 7.851 73 Metal manufacturing 466 1.112 2.636 0.798 16.142 310.156 0 52.429 115 Military equipment and weapons 216 0.979 1.471 0.786 7.372 77.248 0 17.476 46 Mining 62 1.052 1.044 1.114 1.509 6.601 0 5.111 20 Paper, printing and publishing 337 1.107 1.407 1.091 6.510 59.536 0 14.775 52 Pottery, bricks, artificial stone 169 1.044 1.199 1.091 3.474 20.518 0 8.738 45 Shipbuilding 481 0.953 1.081 0.786 3.504 21.272 0 8.738 119 Textiles 1154 0.972 1.653 0.633 7.615 89.369 0 27.692 288 Total sample 9210 1 1.530 0.798 15.239 450.939 0 61.167 2245
21
the cumulative distribution of this set of patents in order to compare it with those of the patents in the top percentiles of WRI*. Fig. 4shows that the cumulative distribution of high quality patents tends to“anticipate” the cumulative distribution of the total patents. In particular, the cumulative distribution of the top 0.5% percentile reaches a level of 50% in 1794 (in the same year the cumulative distribution of“important patents” is also reaching a level of 50%), whereas the cumulative distribution of total patents reaches a level of 50% only in 1823, almost thirty years later. It is instructive to compare this time profile with the estimates of productivity growth produced by Crafts and Harley. According to Crafts' most recent estimates, total factor productivity growth was negligible in the period 1760–1780. It increased to 0.3% per year in the period 1780–1831 and from there to 0.75% per year in 1831–1873 (Crafts, 2004, p. 522). It is relatively straightforward to put forward an explanation that can accounts for the temporal patterns ofFig. 4: the classical take-off period (1760–1801) should be regarded as the phase in which several macroinventions in the sense ofMokyr (1990)emerged. In this interpretation, the time profile of the high quality patents inFig. 4(in particular the top 0.5%) is capturing the time dynamics of these macro inventions. However, the impact of these macroinventions on productivity growth became fully manifest only after a stream of microinventions (possibly represented inFig. 4by the cumulative distribution of total patents) improved their technological performance and cost effectiveness. In this way, the distribution over time of high quality patents may be reconciled with the dynamics of productivity growth posited inCrafts and Harley (1992)revisionist account.
Turning our attention to the scope of technical change, it is possible to use the quality indicator to carry out a simple accounting exercise aimed at singling out the relative contribution of different industries to overall technical change during this period. Given the imperfections of our indicator, we should consider this accounting exercise nothing more than a rough back of envelope type of calculation. In particular, since we are going to use the mean of WRI* as a weight for the quality of patents, we will obtain results that are smoothing the impact of radical innovations over many patents, neglecting the distinction between macro and micro innovations. The results of the exercise are reported inTable 10. Thefirst two columns of the table contain the number of a patents in each industry and their average quality (WRI*).22The third column of the table contains the patenting rates calculated byMoser (2010). These patenting rates are computed as the share of British inventions at the Crystal Palace exhibition of 1851 that were patented. The purpose of this column is to provide some indication of the different propensity to patent of different industries. The fourth column reports the share of each sector in total inventive output computed using the number of patents. Thefifth column reports the share of each sector in total inventive output computed as number of patents weighted by their average quality. The sixth column reports the shares in inventive output weighted by average quality when we use the patenting rates ofMoser (2010)for trying to adjust for the different patent propensity of the sectors. This adjustment consists in dividing the number of patents in each sector for the patenting rate.23The results ofTable 10seems to point to a
pattern of technical change that is widespread and not localized in few sectors (although, it is interesting to note that, for all our three approaches to measurement, three industries such as textiles, engines and chemicals account for more than 30% of inventive output). The adjustment for the average quality of patents does not seem to have a major effect the industrial concentration of inventive output and as such these results are broadly consistent with those obtained bySullivan (1990)who has used simple patent counts for measuring inventive output. Interestingly enough, the adjustment for the propensity to patent has instead a much stronger effect on the shares of inventive output. In particular, when adjusted for patenting propensity, the share of the paper industry becomes much larger. In fact, the paper industry was an industry witnessing important technical changes, but characterized by a very low patent propensity (Moser, 2010). However, even after adjusting for the propensity to patent, inventive output remains fairly widespread across industries.
However, the sharply skewed nature of the distribution of the quality of patents discussed in the previous section, suggests that, in order to shed light on the nature of technical change, is probably more revealing to consider the distribution across industries of the patents in the top percentiles of the quality scores. In this case, our underlying assumption is that is the restricted group of macroinventions situated in the tails of the quality distributions that are critical for productivity growth.Table 11shows the concentration of patents of different quality across industries over the period 1702–1841 measured using the Herfindahl index and concentration ratios.24Patents in the top percentiles of the quality scores (top 0.5%, top 1%) exhibit a remarkably higher
degree of concentration than patents of lower quality (top 50% and the total patent sample). InTable 11we have also displayed the degree of industrial concentration for the set of important patents (defined as inFig. 4as the set of patents that have been mentioned simultaneously in at least two lists of“important patents”). The level of concentration for this set of patents is similar to that of the top 0.5% percentile. Overall,Table 11suggests that, although total patents were relatively widespread across industries as pointed out bySullivan (1990),25technological blockbusters (patents of very high quality) were remarkably more localized.
This result, in our view, provides an interesting hint for reconciling the Crafts–Harvey view with the patent evidence. 7. Concluding remarks
In this paper we have proposed a new indicator (WRI*) of the quality of English patents in the period 1617–1852 based on Woodcroft's Reference Index. We have also explored the properties of this indicator and our preliminary results appear quite encouraging. We have established that the quality indicator is positively correlated with four different lists of“important patents” (patentees included in the
22
Note that since we have used the average number of references to benchmark the quality of patents, the average patent quality at the level of the total sample is equal to 1.
23
For the sectors for which patenting rates were not available we have used the aggregate patenting rate of 0.12.
24The Herfindahl index was computed as H=∑s i 2
where siis the share of patents of given quality in industry i. The higher the value of H the higher the degree
of concentration: in this formulation, the index ranges from 1/21 (≅0.048) when patents are evenly distributed across industries, to 1 when all patents are concentrated in one single industry. It is also instructive to consider the equivalent number (1/H) that indicates the number of industries with equal size corresponding to the level H of concentration. The C3 concentration ratio is the sum of the shares of the three industries with the largest shares.
25
DNB, in the two lists of“great inventors” recently compiled byAllen (2009)and in the list of significant patents constructed byBaker (1976)). One of the merits of the WRI* indicator in comparison with the“great inventors” approach is that it provides a proxy for quality at the invention rather than at the inventor level. One further advantage (in comparison both to the great inventor lists and to Baker's list of significant patents) is that WRI* index can be calculated for all patents. Instead one of the obvious limitations of the adjusted WRI* index in comparison with“great inventors” approach is that the former is restricted to patented inventions, whereas the latter can include also