Bridge Failures Case Studies in India
(2016-2019)
By
Raghavendra Rajendran
A thesis submitted in partial fulfilment of the requirements for the
Master of science in Civil Engineering
School of Civil, Environmental and Land Management Engineering
ACKNOWLEDGEMENTS
I would first like to thank my thesis advisor Prof. Pier Giorgio Malerba of the School of Civil, Environmental and Land Management Engineering at Politecnico di Milano. The door to Prof. Malerba office was always open whenever I ran into a trouble spot or had a question about my research or writing. He consistently allowed this paper to be my own work but steered me in the right the direction whenever he thought I needed it.
I would like to thank all the professors for their continual support of my academic advancement throughout the graduate program at Politecnico di Milano.
I would like to thank my parents whose love and guidance are with me in whatever I pursue. They are the ultimate role models. I would like to sincerely thank my brother and sisters, for their encouragement through my formal educational endeavors. I feel happy to be the First graduate in my heritage.
I would also like to thank my friends for their continual support of my academic advancement throughout the graduate program at Politecnico di Milano.
I feel proud to be the graduate of Politecnico di Milano and it serves the foundation for achieving the highest standards and provide myself with the opportunity to work with the best minds in the field of Structural Engineering.
ABSTRACT
When discussing about the infrastructure in India, and more specifically, the problems facing India’s infrastructure, bridge failures have been one of the leading problems facing India’s infrastructure.
Bridge failures often are costly in the commerce foregone, lives lost, and replacement funds required to rebuild the failed bridge.
Infrastructure is the growth driver of the economy. India will invest as much as Rs 5.97 trillion (USD 84.84 Billion) in creating and upgrading infrastructure in the next financial year, finance minister Arun Jaitley said in his budget. The budgetary allocation for the Ministry of Road Transport and Highways has been increased to Rs 71,000 crore for 2018-19 from Rs 64,900 crore in the ongoing fiscal.
Experience can be an expensive teacher, and it is usually the best teacher. In reviewing the past bridge failures, it is natural, or manmade that with greatest loss of life and directly affects the individuals as well as country economy. From this point it is necessary to study the past failure to strengthen the future construction.
There are many failures which occur and are never heard about by the general public. They may be listed and described. Some may be settled out of court with respect to responsibility, or the person responsibly chooses to keep the failure secret to protect his/company reputation. Many failures are learned through technical papers and magazines, particularly failures of a minor nature. Thus, only technical people become aware of them, although the technical person must realize that all types of past failures must be given equal considerations.
Ongoing studies of following case study about bridge failures has been an important undertaking, which can greatly enhance the ability for engineers to predict and avoid the great costs associated with a bridge failure.
A large part of the technical knowledge connected with the bridge engineering today is based on the past failures of bridges. The purpose of the study is to make clear idea about past bridge failures and its summary to future awareness. The intent is to eliminate error in design, Maintenance and proper communication. At the same time 100% accuracy is not possible but we can minimize the failure which we can.
The findings of this Thesis will help better understanding which precautions should be taken while designing, constructing, and maintaining a bridge, as well as the factors that can help contribute to bridge failure, both distress and collapse.
The scope of the study is to investigate the causes of failure of bridges and factors that greatly increase the probability of these bridges failing by summarizing a bridge failure database of bridges within the Indian States. This thesis will also discuss these bridge failures and the lessons that can be learned as a result of them.
The goal of this thesis work is to learn from failures. This study will be conducted to help analyze why bridges fail and minimize the failures.
This Thesis is written in the hope that by contributing to the better understanding of cause of failures and a knowledge of bridge failures and types of bridge failures in the past, the future failures of this type may be reduced greatly.
TABLE OF CONTENTS
Contents
CHAPTER INTRODUCTION ... 1 1.1 General Introduction ... 1 1.2 Intent of Study ... 1 1.3 Objectives... 2 1.4 Scope ... 2 1.5 Research Benefits ... 2 1.6 Legal Responsibilities ... 2 1.7 Conclusion ... 3CHAPTER 2: BACKGROUND INFORMATION ... 4
2.1 Introduction ... 4
2.2 Principal Causes of Failure ... 6
2.3 Enabling Causes of Failure ... 7
2.4 Triggering Causes of Failure ... 7
2.5 Collapse ... 8
2.6 Conclusion ... 8
CHAPTER 3. BRIDGE SCOUR ... 9
3.1 Introduction ... 9
3.1.1 General Scour ... 9
3.1.2 Contraction Scour ... 10
3.1.3 Scour in Different Conditions of Transport ... 10
3.1.4 Clear-Water Scour ... 11
3.1.5 Live Bed Scour ... 12
3.2 Local Scour ... 14
3.2.1 Types of Scour ... 14
3.3 Local scour - bridge piers ... 15
3.4 Local scour - bridge abutments ... 16
3.3 LOCAL SCOUR MECHANISM AROUND BRIDGE PIERS ... 17
3.3.1 General Information ... 17
3.3.2 LOCAL PIER SCOUR EQUATION ... 17
3.4.1 Characteristic of CAHDOORA BRIDGE ... 20
3.4.2 Description of the collapse ... 20
3.4.3 Lesson... 21
3.4.4 Summary ... 21
3.5 CASE 2 ... 22
3.5.1 Characteristic of LANGI DURG ROAD BRIDGE ... 22
3.5.2 Description of the collapse ... 22
3.5.3 Lesson... 23
3.5.4 Summary ... 23
3.6 CASE 3 ... 24
3.6.1 Characteristic of JAHU BRIDGE ... 24
3.6.2 Description of the collapse ... 24
3.6.3 Lesson... 25
3.6.4 Summary ... 26
CHAPTER 4: FAILURES DUE TO GENERAL COLLAPSE ... 27
4.1 General Collapse ... 27
4.1.1 Member Failure... 27
4.1.2 Lack of attraction to critical details ... 27
4.1.3 Corrosion ... 27
4.2 FAILURES DUE TO CORROSION ... 28
4.2.1 Corrosion in Concrete ... 28
4.2.2 Corrosion Mechanism ... 28
4.2.3 Damages to concrete ... 29
4.2.3.1 Corrosion Deterioration in RC Structures ... 29
4.2.3.2 Structural Effects ... 31
4.2.4 Causes and Parameter of corrosion ... 32
4.2.4.1 Carbonation ... 32
4.2.4.2 Chloride attack ... 32
4.2.4.3 Surface Corrosion ... 34
4.2.4.4 Stress Corrosion Cracking ... 34
4.6 Corrosion prevention ... 35
4.3 CASE 1 ... 36
4.3.2 Description of the collapse ... 36
4.3.3 Lesson... 37
4.3.4 Summary ... 37
CHAPTER 5: FAILURES DUE TO BUCKLING ... 38
5.1 Types of Buckling in Structural Members ... 38
5.1.1 Flexural Buckling ... 38
5.1.2 Torsional and Flexural-Torsional Buckling ... 39
5.1.3 Lateral Torsional Buckling ... 39
5.1.4 Distortional Buckling ... 39
5.2 Design of Member Subjected to Buckling ... 40
5.2.1 Introduction ... 40
5.2.2 Flexural Buckling ... 40
5.3 Erection Procedure ... 42
5.3.1 Design Error and Construction Error ... 42
5.4 Proof Checking and Dual Authority ... 42
5.5 CASE 1 ... 43
5.5.1 Characteristic of Charus Bridge ... 43
5.5.2 Description of the collapse ... 43
5.5.3 Lesson... 45
5.5.4 Summary ... 45
5.6 CASE 2 ... 46
5.6.1 Characteristic of Kolkata Flyover Bridge ... 46
5.6.2 Description of the collapse ... 46
5.6.3 Lesson... 48
5.6.4 Summary ... 49
CHAPTER 7: LESSONS FOR THE PRACTICE ... 50
7.1 General observation... 50
7.2 Design ... 50
7.2.1 Organization: Coordination, delegation, exchange of information ... 50
7.2.2 Verification of Structural Safety ... 50
7.2.2.1 Scope, Summary, Form ... 50
7.2.2.2 Various aspects of Calculation ... 51
7.3.1 Precautionary measures ... 51
CHAPTER 8: MY OWN SUMMARY ... 52
8.1 Sequence of Construction process... 52
8.2 Design ... 52
8.3 Verification of Structural safety ... 52
8.4 Construction Management ... 52
CHAPTER 9: CONCLUSIONS ... 53
LIST OF TABLES
Table 1 Listed bridge failures occur after year 2000... 5 Table 2 Enabling Causes (Wardhana and Hadipriono 2003)... 7 Table 3 Triggering Causes (Wardhana and Hadipriono 2003) ... 7
LIST OF FIGURES
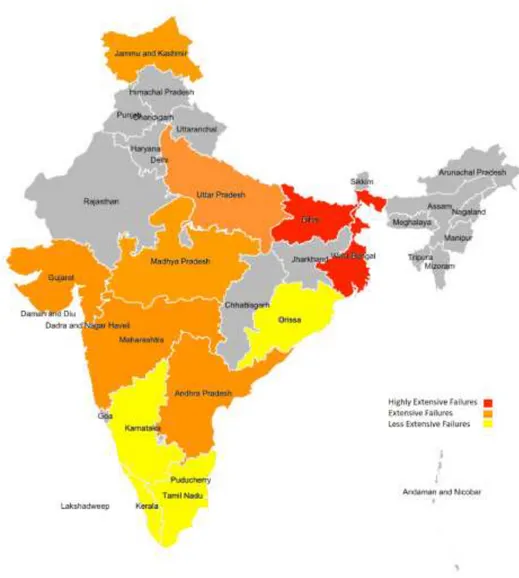
Figure 1 Map of Severity of bridge failures statewise ... 6
Figure 2 The types of scour that can occur at a bridge (Melville and Coleman, 2000) ... 9
Figure 3 Contraction scour and high-risk locations (State of Queensland -Bridge scour manual 2013) .... 10
Figure 4 Variation of scour depth under clear-water scour and live bed scour conditions as a function of time (State of Queensland - Bridge scour manual 2013) ... 11
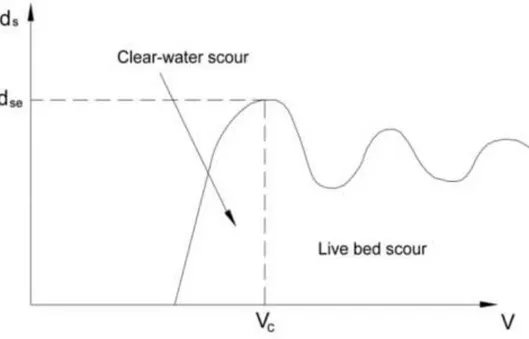
Figure 5 Variation of scour depth with approach flow velocity (Yanmaz, 2002) ... 13
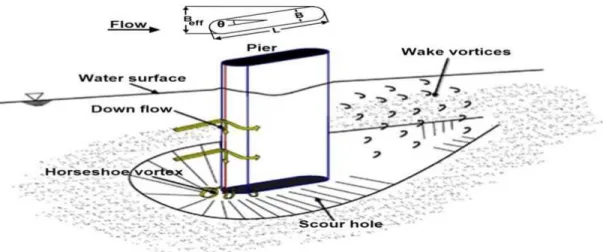
Figure 6 Scour at a bridge pier (HEC-18, 2012) ... 14
Figure 7 Scour at a bridge abutment (HEC-18, 2012) ... 15
Figure 8 Schematic vortex structures around circular pier (Mojtaba Karimaei Tabarestani 2017) ... 16
Figure 9 Flow structure generated by floodplain/main channel flow interaction (NCHRP 2011b) ... 17
Figure 10 Chadoora Bridge taken after floods ( Azmat Hussain 2016) ... 20
Figure 11 The detailed site plan of the bridge (Azmat Hussain & Sumaira Jan 2016) ... 21
Figure 12 Langi Durg Road Bridge (Pier Failure of Bridge and Geotechnical J. K. Jain 1998) ... 22
Figure 13 Showing no damage signs in abutment and wings (Pier Failure of Bridge and Geotechnical Investigation – J.K. Jain, 1998) ... 23
Figure 14 Collapse of Jahu Bridge – (Jahu Bridge, Pankaj, 2018) ... 24
Figure 15 Plan of Seer Khadd Showing Damaged Portion – (Jahu Bridge, Pankaj, 2018) ... 25
Figure 16 Schematic Illustration of Corrosion of Reinforcement Steel in Concrete as an Electrochemical Process (Ahmad 2003) ... 29
Figure 17 Corrosion Pattern under Natural Chloride-Induced Corrosion (Zhang et al. 2010) ... 30
Figure 18 Reduced service life of reinforced concrete (Wryers et al. 1993). ... 31
Figure 19 Causes of corrosion of steel in concrete(Wryers et al. 1993). ... 33
Figure 20 Start of stress corrosion cracking. (Kamnik, April 2008) ... 35
Figure 21 Structural steel elements subject to corrosion (Kamnik, April 2008) ... 35
Figure 22 Andheri Bridge – (economictimes,2018) ... 36
Figure 23 Failure due to corrosion – (economictimes,2018) ... 37
Figure 24 Types of Buckling in Structural Members – (Krisda Piyawat & Thomas H.-K. Kang 2012) ... 38
Figure 25 Flexural Failure – (Determining the buckling resistance of steel and composite bridge structures, D C ILES, 2012) ... 39 Figure 26 Distortional buckling (hogging region of continuous composite deck) – (Determining the
Figure 27 Flexural Buckling – (Determining the buckling resistance of steel and composite bridge
structures, D C ILES, 2012) ... 40 Figure 28 Flexural Buckling – (Determining the buckling resistance of steel and composite bridge
structures, D C ILES, 2012) ... 41 Figure 29 Chauras Bridge – Plan View (Failure of Chauras bridge Harshad, pabitra rajan, Pramod kumar, 2014) ... 43 Figure 30 Chauras Bridge after failure (Failure of Chauras bridge Harshad, pabitra rajan, Pramod kumar, 2014) ... 44 Figure 31 Joints U13 and U14 and buckled member U13U14 (Failure of Chauras bridge Harshad, pabitra rajan, Pramod kumar, 2014) ... 44 Figure 32 Intact gusset plat at joint U13 and U14 (Failure of Chauras bridge Harshad, pabitra rajan, Pramod kumar, 2014) ... 45 Figure 33 Part plan of Kolkata Flyover at the point of collapse (Collapse of Kolkata flyover N.Prabhakar & N.Subramanian, 2017) ... 46 Figure 34 Close view of Pier Cap (Collapse of Kolkata flyover N.Prabhakar & N.Subramanian, 2017) ... 47 Figure 35 After failure, Concrete Deck Slab had been Laid on one Cantilever Side only (Collapse of
Kolkata flyover N.Prabhakar & N.Subramanian, 2017)... 47 Figure 36 (Kolkata flyover collapse, Nirmalendu Bandyopadhyay, April 2016) ... 48 Figure 37 Collapse of the two cantilever girder (Collapse of Kolkata flyover N.Prabhakar &
N.Subramanian, 2014) ... 48 Figure 38 Combination of failure mode ... 49
LIST OF SYMBOLS
(y_ms^ )c : Average equilibrium depth in the contracted section after contraction scour, (m) ... 12
a : Pier width, m (ft) ... 18
A, B : Parameters determined from the analysis of experimental data and its random variables... 34
C : Average corrosion penetration in µm ... 34
ds : Depth of scour, m ... 13
Dx : Grain size for which x percent of the bed material is finer, m (ft) ... 19
E : Modulus of Elasticity ... 41
e0 : Initial out of straight ... 40
E1 : Construction Issues ... 7
E2 : Design Issues ... 7
E3 : Maintenance Issues ... 7
E4 : Material Issues ... 7
Fr1 : Froude Number directly upstream of the pier ... 18
g : Acceleration of gravity (9.81 m/S^2) (32.2 ft/S^2) ... 18
G : shear modulus ... 41
I : Second moment of area of the member about the minor axis ... 41
IT : St Venant torsional constant ... 41
Iw : warping constant ... 42
Iz : second moment of area about the minor axis ... 41
k(CO2) : Carbonation factor of the concrete ... 32
K_u. : 11.17 English Units ... 19
k1 : {█(Exponent = 0.59 if V*/w < 0.5 (mostly contact-bed transport to mostly suspended-bed material transport @Exponent = 0.64 if V*/w= 0.5-2.0 ( some suspended-bed material transport)@Exponent = 0.69 if V*/w > 2.0 (mostly suspended-bed material transport))┤ ... 13
k2 : Correction factor for angle of attack of flow ... 18
k3 : Correction factor for bed condition ... 18
k4 : Correction factor for armoring by bed material size ... 18
Ku : 6.19 SI Units ... 19
L : Length of pier, m (ft) ... 18
L. : beam length between points which have lateral restraint ... 42
Nc : Elastic Critical force for flexural Buckling (Euler Load) ... 40
Q1m : flow rate in the approach main channel transporting sediment m3/s ... 13
Q2 : Total flow rate through the contracted section ... 13
t : Time ... 32 t. : Number of years ... 34 T1 : Hydraulic – scour/Flood ... 7 T2 : Deterioration ... 7 T3 : Detailing ... 7 T4 : Collision ... 7 T5 : Overload ... 7
V_(c Dx) : the critical velocity (m/s or ft/s) for incipient motion for the grain size 𝐷𝑥 (m or ft) ... 19
V1 : Mean velocity of flow directly upstream of the pier, m/s (ft/s) ... 18
V1 : Velocity of the approach flow just upstream of the pier, m/s (ft/s) ... 19
W1: Bottom width of the approach channel, m ... 13
W2 : Bottom width of the contracted channel, m ... 13
x : Carbonation depth ... 32
y_(1.) : Depth of flow just upstream of the pier, excluding local scour, m (ft) ... 19
y_ms : Average depth in the upstream main channel, (m) ... 12
y0 : Average existing depth in contracted section, (m) ... 13
y1 : Flow depth directly upstream of the pier, m (ft) ... 17
ys : Scour depth, m (ft) ... 17
CHAPTER INTRODUCTION
1.1 General Introduction
India is emerging to become a developed country equivalent to other developed countries. The main thrust to achieve is the infrastructure of the country. The road network including the bridges connecting the shores across the many rivers across the nation, are the veins to the economic development which in turn contributes to the infrastructure. India follows the United States of America in close heels with the second largest road network in the world.
Infrastructure is the growth driver of the economy. India will invest as much as Rs 5.97 trillion (USD 84.84 Billion) in creating and upgrading infrastructure in the next financial year, finance minister Arun Jaitley said in his budget. The budgetary allocation for the Ministry of Road Transport and Highways has been increased to Rs 71,000 crore for 2018-19 from Rs 64,900 crore in the ongoing fiscal.
Experience can be an expensive teacher, and it is usually the best teacher. In reviewing the past bridge failures, it is natural, or manmade that with greatest loss of life and directly affects the individuals as well as country economy. From this point it is necessary to study the past failure to strengthen the future construction.
There are many failures which occur and are never heard about by the general public. They may be listed and described. Some may be settled out of court with respect to responsibility, or the person responsibly chooses to keep the failure secret to protect his/company reputation. Many failures are learned through technical papers and magazines, particularly failures of a minor nature. Thus, only technical people become aware of them, although the technical person must realize that all types of past failures must be given equal considerations.
The bridge failures summarized in this report are grouped under headings listing the type of failure. It is unfortunate that there is one cause of failure which exists probably more often than any other carelessness during construction which is an error which may always be present. Ignorance, however, may be a factor and there are times when the economics of the construction sacrifices many lives. The most critical period in the, life of a structure is often during the construction period. There is a critical stage during construction, and after this stage the engineer can partially relax and be satisfied that his design is stable. Of course, there are other tests which the structure must also face during its early performance. But after construction is satisfactorily completed, a very Large part of the battle is won. Failures resulting not from insufficiencies of the structural design of the completed work but from unexpected movements and loadings during construction are, in the pub lie mind, not distinguished from structural design failures. Such incidents occur quite often near the completion of a job when progress is at the maximum scheduled rate and manpower is not enough to provide all the necessary precautions against failure.
1.2 Intent of Study
A large part of the technical knowledge connected with the bridge engineering today is based on the past failures of bridges. The purpose of the study is to make clear idea about past bridge failures and its summary to future awareness. The intent is to eliminate error in design, Maintenance and proper communication. At the same time 100% accuracy is not possible but we can minimize the failure which we can.
1.3 Objectives
Lessons have been learned from many failures and will yet continue to be learned. By giving an outline from the past failures of bridges and the cause of the failures, hoped that the same type of failures will not occur. It is, However, most of the failures are caused by same effect. All the Indian states are considered for past bridge failures and west of Indian states are needing to be considered when compared with the south Indian states.
The goal of this thesis work is to learn from failures. This study will be conducted to help analyze why bridges fail and minimize the failures.
This Thesis is written in the hope that by contributing to the better understanding of cause of failures and a knowledge of bridge failures and types of bridge failures in the past, the future failures of this type may be reduced greatly.
1.4 Scope
The scope of the study is to investigate the causes of failure of bridges and factors that greatly increase the probability of these bridges failing by summarizing a bridge failure database of bridges within the Indian States. This thesis will also discuss these bridge failures and the lessons that can be learned as a result of them.
1.5 Research Benefits
The damaged bridges are studied keenly, and their cause of the failure is studied. During my search there is no such topic like bridge failures case study in India. But a case study about bridge or Bridge failures Indian States or Particular Cause of failure is available. From the search, it is noted that insufficient in the field of case study for both major and minor bridges failures. It is also one of the reasons for inadequate knowledge in this filed. The findings of this Thesis will help better understanding which precautions should be taken while designing, constructing, and maintaining a bridge, as well as the factors that can help contribute to bridge failure, both distress and collapse.
1.6 Legal Responsibilities
There is a well-known phrase -- "A medica1 doctor buries his mistakes, an architect covers his mistakes with ivy, and the engineer must write a long report on his mistake."
Every time a failure occurs a single authority should take full responsibility for the lives and damages due to failures instead of fingering someone. It is not the intension of this summary to figure anyone, but only to intense the reader with the failures in some details along with the causes and lessons learned. It is the crucial requirement for the government to take notice importance of this situation and take necessary steps towards rectifying the issues. In present the administration of the national highways, state highways, and minor roads in the country are vested with different authorities.
If the administration is vested with one central authority then not only will it help in expediting the construction of roads and bridges and refurbishment of the old ones, but the quality will also improve as there would be no blame game with one administration accountable and responsible for the output.
1.7 Conclusion
The above-mentioned principle cause of failures is the primary cause of a Bridge failures, but there are the results of the two subcategories namely enabling and triggering causes. concurrently. Enabling and triggering causes are the means by which a bridge can fail, where enabling causes are generally internal to the bridge structure and triggering causes are external to the bridge; for an example enabling cause and a triggering cause could be inspection errors and tornado damage respectively. These causes can create a situation, where a total collapse or a partial collapse is probable; a total collapse is the situation where the traffic is no longer serviceable. Bridge Scour is one of the major failures of about 60 percent of total failure. Most of the bridge scour failure due to inadequate maintenances and complied database is listed in table. Second most failures occur during construction process due to improper management and in construction sequence and poor communication. In this work we discussed about this kind of failures in the section buckling failures.
In this thesis work the summary of the most common types of failures are presented. Each bridge failures due to different types of causes and some are major, and some are minor. From the case study it is clearly known that the failures are due to structural deficiency, improper management, Design error, Construction Sequence issues and careless. It is highly recommended to create a group of members responsible for the bridges, one authority and one responsible.
From the search, it is noted that insufficient in the field of case study for both major and minor bridges failures. It is also one of the reasons for inadequate knowledge in this filed. Engineers are not only responsible for design, construction…etc. but also for creating and shaping our society and improve the way we work and live. They should aware the responsibilities connected to the society and people’s life. The minimum qualification for doing practicing should be master’s degree is my own suggestion from this case study. There is a lag in this field of study, and I would like to invite future scholar and students to explore this filed and it greatly reduce the failures in India.
CHAPTER 2: BACKGROUND INFORMATION
2.1 Introduction
Engineers have studied many bridge failures, seeking to learn from them and the reasons for the structure’s demise, hoping to gain insight and avoid costly mistakes in the future.
When a bridge experiences failure, a cause of failure is usually reported as to why the bridge failed, which is a principal cause; of this principal cause, there are two subcategories of failure causes which are enabling and triggering causes.
From these causes, a bridge may experience either partial collapse or total collapse, which are both forms of bridge failure.
A principal cause can be broken into two distinctly different causes of failure; enabling causes and triggering causes. These are both subcategories of failure.
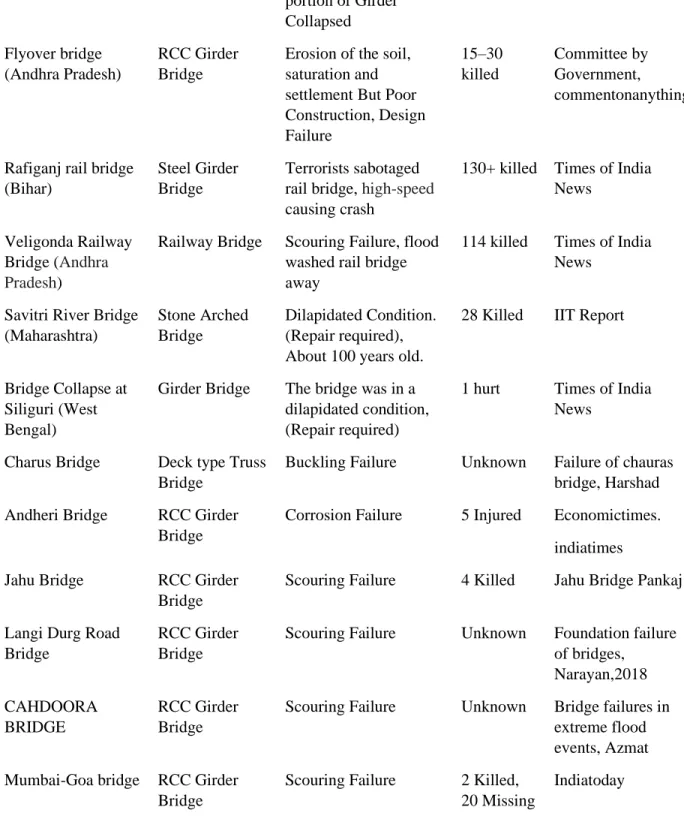
The listed bridge failures occur after year 2000
Bridge Type Year, Cause Casualties Sources
Bhagalpur
Pedestrian bridge (Bihar)
Arch bridge collapsed onto a railway train as it was passing underneath Due to unstable arch
At least 30 killed
The Hindu News
Kota Chambal Bridge (Rajasthan) Cable stayed Bridge During Construction, the construction sequence was not followed Claimed 48 lives Reported by Road transport and highways ministry
Kadalundi River rail bridge (Kerala)
Girder Bridge Scouring, Pier Unstable (Repair needed) At least 57 killed Reported by government investigators, Outlook India, Mapofindia. Majerhat Bridge collapse (West Bengal) RCC Girder Bridge Mid-span failure of RCC Girder, (Repair required) AT least 3 Killed Reported by RVNL chief project manager Vivekananda Flyover Bridge (West Bengal) Steel girder, flyover bridge Buckling Failure, Design error on Cantilever Beam AT least 27 Killed Collapse Of Kolkata Flyover-Practitioner's Perspective by N. Prabhakar & Dr. N.Subramanian Sanvordem River Bridge (Goa) footbridge made of steel
The bridge was closed for use but Overload a
portion of Girder Collapsed Flyover bridge (Andhra Pradesh) RCC Girder Bridge
Erosion of the soil, saturation and settlement But Poor Construction, Design Failure 15–30 killed Committee by Government, commentonanything
Rafiganj rail bridge (Bihar)
Steel Girder Bridge
Terrorists sabotaged rail bridge, high-speed causing crash
130+ killed Times of India News
Veligonda Railway Bridge (Andhra Pradesh)
Railway Bridge Scouring Failure, flood washed rail bridge away
114 killed Times of India News
Savitri River Bridge (Maharashtra)
Stone Arched Bridge
Dilapidated Condition. (Repair required), About 100 years old.
28 Killed IIT Report
Bridge Collapse at Siliguri (West Bengal)
Girder Bridge The bridge was in a dilapidated condition, (Repair required)
1 hurt Times of India News
Charus Bridge Deck type Truss Bridge
Buckling Failure Unknown Failure of chauras bridge, Harshad Andheri Bridge RCC Girder
Bridge
Corrosion Failure 5 Injured Economictimes. indiatimes
Jahu Bridge RCC Girder
Bridge
Scouring Failure 4 Killed Jahu Bridge Pankaj
Langi Durg Road Bridge
RCC Girder Bridge
Scouring Failure Unknown Foundation failure of bridges, Narayan,2018 CAHDOORA BRIDGE RCC Girder Bridge
Scouring Failure Unknown Bridge failures in extreme flood events, Azmat Mumbai-Goa bridge RCC Girder
Bridge
Scouring Failure 2 Killed, 20 Missing
Indiatoday
Figure 1 Map of Severity of bridge failures statewise
2.2 Principal Causes of Failure
Principal cause of failure for this study are defined as, detailing, or construction, errors in design, floods, the use of improper materials, unanticipated effects of stress concentrations, lack of proper maintenances, unexpected events, Accidents, Design flaws and manufacturing errors, Fires, Earthquakes. Unexpected events are generally referring to either severe partial collapse of the bridge, which would require partial or total replacement of the bridge components. Cause of failure can be any or combination of the above all, which could bring the bridge down catastrophically or induce distress into the structure.
Of all principal causes of failure, Wardhana and Hadipriono (2003) found that unintended external events were found to contribute the highest amount of bridge failures in past analysis of bridge failures, overall,
followed secondly by maintenance issues. The study found external causes to lead to the most collapses, followed by maintenance and during construction.
2.3 Enabling Causes of Failure
An enabling cause as any issue with the bridge that can be identified as an internal weakness or deficiency that leaves the structure vulnerable to failure in their most recent study on bridge failures (Wardhana and Hadipriono 2003).
This can be due to many reasons such as material deficiencies, construction faults, design error or anything internal to the structure which can lead to failures. It can be prevented by many methods, but it may be hard to catch before the problem has been made known through observed defects construction or in progress. It can be avoided by proper communication between designer and supervisor, following standard quality materials, increased care and diligence in both the design and construction phases.
Symbol Enabling Causes
E1 Construction Issues
E2 Design Issues
E3 Maintenance Issues
E4 Material Issues
Table 2 Enabling Causes (Wardhana and Hadipriono 2003)
2.4 Triggering Causes of Failure
Triggering causes are those which are external to the bridge. These are usually hard to predict and are much more wide-ranging than enabling causes, and can include: wind, hurricanes, flooding, terrorism, and any other external cause (Wardhana and Hadipriono 2003).
This type of causes is more difficult to predict and much more likely to result in full or partial collapse. Because since that are externally controlled or the impact of external action but must be accounted for during the design phase as accurately as possible, using factors of safety while avoiding overdesign of the bridge.
Symbol Triggering Cause
T1 Hydraulic – scour/Flood
T2 Deterioration
T3 Detailing
T4 Collision
T5 Overload
2.5 Collapse
In a bridge’s service to the traveling public, collapse is often an engineer’s greatest fear, but needs to be discussed when studying failure. Two types of collapse will be investigated in the study; total collapse and partial collapse. Partial collapse refers to an incident where the bridge undergoes some deformation or section loss but still can remain serviceable, whereas total collapse refers to an incident where the bridge is unable to service traffic flows. An example for each would be locked bearings and pier collapse, respectfully.
2.6 Conclusion
The above-mentioned principle cause of failures is the primary cause of a Bridge failures, but there are the results of the two subcategories namely enabling and triggering causes. concurrently. Enabling and triggering causes are the means by which a bridge can fail, where enabling causes are generally internal to the bridge structure and triggering causes are external to the bridge; for an example enabling cause and a triggering cause could be inspection errors and tornado damage respectively. These causes can create a situation, a total collapse or a partial collapse is probable; a total collapse where traffic is no longer serviceable. Bridge Scour is a major failure of about 60 percent of total failure.
In this thesis work the summary of the most common types of failures are presented. Each bridge failures due to different types of causes and some are major, and some are minor. From the case study it is clearly known that the failures are due to structural deficiency, improper management, Design error, Construction Sequence issues and careless. It is highly recommended to create a group of members responsible for the bridges, one authority and one responsible. From the search, it is noted that insufficient in the field of case study for both major and minor bridges failures. It is also one of the reasons for inadequate knowledge in this filed. Engineers are not only responsible for design, construction…etc. but also for creating and shaping our society and improve the way we work and live. They should aware the responsibilities connected to the society and people’s life. The minimum qualification for doing practicing should be master’s degree.
CHAPTER 3. BRIDGE SCOUR
3.1 Introduction
The flow of water in rivers and streams excavates and moves material from bed and banks of streams and from around the bridge piers and abutments. Correspondingly, foundations of the structures are undermined by this erosive action of the flowing water, which is named as scour. Past observations show that scouring is a noteworthy problem in bridge hydraulics topic. When hydraulic and structural interaction is not evaluated accurately, during the high floods scour can give rise to destruction of structure, loss of life and property.
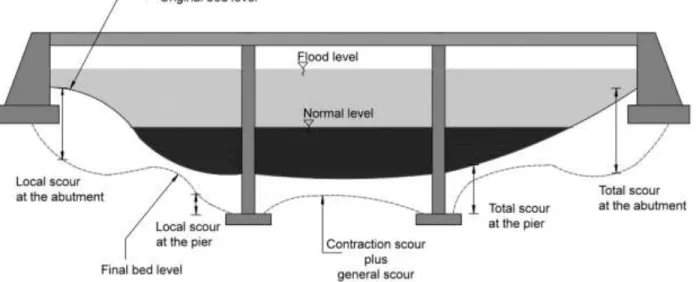
The addition of these components presents the total scour. The types of scour that can occur at a bridge are illustrated in Figure. It is assumed that each of them occurs independently.
Figure 2 The types of scour that can occur at a bridge (Melville and Coleman, 2000)
3.1.1 General Scour
General scour forms as a result of natural processes whether there is a bridge or not at the cross section. It can be referred as bed aggradation/degradation and categorized as short-term scour and long-term scour according to the time it takes to reach the scour. Short-term general scour occurs during single or sequential floods (daily, weekly, monthly or seasonally). Scour at channel confluences, scour at bends, scour arising from a shift in the channel thalweg and bed-form migration are included in short-term general scour (Coleman and Melville, 2001). Because formation of contraction scour and local scour dominate over that of short-term scour, it is very hard to anticipate it at structure, hence short-term scour is not included in the design computations. Long-term general scour forms naturally or develops with some modifications at watershed and stream and undoubtedly occurs over the years and has a relatively longer time scale. Human causes of long-term general scour are channel alterations, streambed mining and dam/reservoir construction. In addition; channel straightening, tectonic activities, fire and climate change develop long-term scour naturally. The engineer has to specify the present condition of stream and watershed and estimate the future streambed changes (Melville and Coleman, 2000).
3.1.2 Contraction Scour
Contraction scour is the result of reduction in the flow area of a stream either by natural contraction i.e. this can occur naturally between rock outcrops preventing the stream from migrating or by a bridge or when overbank flow is confined by roadway embankments. From the continuity principle, flow area inversely proportional to the average velocity and bed shear stress. From this, increase in erosive forces leads to more bed material removed from the contracted section than transported to the section. Bed elevation is lowered, average velocity and bed stress decrease at the reach until the equilibrium is reached. The amount of the bed material removed from the reach becomes equal to that of bed material transported to the reach.
Figure 3 Contraction scour and high-risk locations (State of Queensland -Bridge scour manual 2013)
3.1.3 Scour in Different Conditions of Transport
In bridge hydraulics,
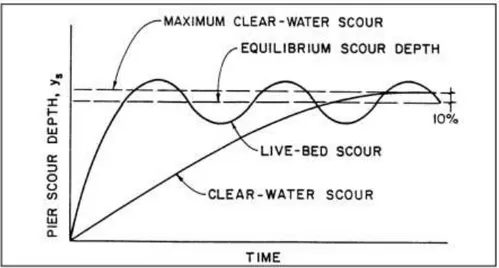
Bed materials transportation is considering to be the greater effect because the foundation design of the river structure is affected by it. According to the conditions of transport, Clear-water scour, and live-bed scour are divided, which will be explained in following sections. Variation of scour depth under clear water scour and live bed scour conditions as a function of time is shown below,
Figure 4 Variation of scour depth under clear-water scour and live bed scour conditions as a function of time (State of Queensland - Bridge scour manual 2013)
3.1.4 Clear-Water Scour
Clear-water scour occurs when the bed material at the upstream is not transported to the downstream reach or the bed material at the upstream of the bridge structure has no motion. In this condition, the velocity of the river is less than the critical velocity of the bed material in the river (i.e. V/𝑣𝑐 <1). The shear stress
created by flow of water at the bed should be smaller than the critical shear stress. The maximum local scour depth is reached when the flow can no longer remove bed material from the scour area.
The flow properties in scour hole are affected by pier geometry and inertia of flow. Under clear-water conditions, the area of the contracted section increases until, in the limit, the velocity of the flow (V) or the shear stress (𝜏0 ) on the bed is equal to the critical velocity (𝑣𝑐) or the critical shear stress (𝜏𝑐) of a certain
particle size (D) in the bed material.
Past researchers have studied the hydraulic conditions necessary for the start of clear-water scour. Shen et al. (1969) recommends that clear-water scour starts when the mean approach velocity (𝑣0) reaches half of
the critical shear velocity value (𝑣∗𝑐 ) . Raudkivi (1986) proposes a different relationship, which tells that
the clear-water scour begins when mean flow velocity (V) approaches 50% of mean critical velocity (𝑣𝑐).
Additionally, Chiew (1995) states that shear velocity (𝑣∗) must be at least 30% of the critical shear velocity
(𝑣∗𝑐) to initiate the clear-water scour.
Critical Velocity
𝑣
𝑐= 6.19𝑦
𝑚𝑠 1/6𝐷
50 1/3 The recommended clear-water contraction scour equation is:(𝑦
𝑚𝑠)
𝑐= [
0.025𝑄2𝐷𝑚 2/3𝑊2
]
3/7
V/𝑣𝑐 <1
𝑦
𝑠= (𝑦
𝑚𝑠)
𝑐− 𝑦
0𝐷
𝑚= 1.25𝐷
50.
3.1.5 Live Bed Scour
Bed material sedimentation transport occurs from the upstream reach into the bridge cross section. When flow intensity increases until bed shear stresses at the upstream exceed the critical shear stress, bed load transport in the flow direction is developed. The stream velocity is higher than the critical velocity of the bed materials (i.e. V/𝑣𝑐 >1).
Live-bed contraction scour depths restrained by large sediment particles in the bed material. Under this condition we can calculate depth of live bed scour using the smaller depth between live bed scour and clear water scour equation. Development of scour hole depends on the flow in the scour hole and flow conditions in the upstream together. Scour hole development rate rapidly increases at first, then decreases in time. Scour with the bed material sediment transport (live bed scour) takes place when flow initiates the general sediment transport by the river. When flow intensity increases until bed shear stresses at the upstream exceed the critical shear stress, bed load transport in the flow direction is developed. The equilibrium condition is reached when the rate of sediment entering the scour hole becomes equal to the rate being taken out.
Different from the clear-water conditions, under live bed conditions, an average equilibrium scour depth, an average maximum scour depth and an average minimum equilibrium scour depth are defined (Raudkivi 1991). Variation of scour depths with mean approach velocity for clear-water and live bed conditions. A modified version of Laursen's 1960 equation for live-bed scour at a long contraction recommended to predict the depth of scour in a contracted section (Laursen 1960). The e assumes that bed material is being transported from the upstream section.
Live-Bed Conditions 0.59 <
𝑘
1 > 0.69V/𝑣𝑐≥ 1 mostly contact-be transport to mostly
Richardso 1995 modified suspended-bed material transport from Laursen 1960
(𝑦
𝑚𝑠)
𝑐𝑦
𝑚𝑠= [
𝑄
2𝑄
1𝑚]
6/7[
𝑊
1𝑊
2]
𝑘1𝑑
𝑠= 𝑦
0− (𝑦
𝑚𝑠)
𝑐Where,
(𝑦𝑚𝑠)𝑐 = Average equilibrium depth in the contracted section after contraction scour, (m)
𝑄2 = Total flow rate through the contracted section, 𝑚3/𝑠, 𝑄2 = 𝑄1𝑚 X % area open through
bridge
𝑄1𝑚 = flow rate in the approach main channel transporting sediment 𝑚3/𝑠
𝑊1 = Bottom width of the approach channel, m
𝑊2 = Bottom width of the contracted channel, m
W = Bottom width of the contracted channel less pier width (s), m
𝑘1 = { 𝐸𝑥𝑝𝑜𝑛𝑒𝑛𝑡 = 0.59 𝑖𝑓 𝑉 ∗/𝑤 < 0.5 (𝑚𝑜𝑠𝑡𝑙𝑦 𝑐𝑜𝑛𝑡𝑎𝑐𝑡 − 𝑏𝑒𝑑 𝑡𝑟𝑎𝑛𝑠𝑝𝑜𝑟𝑡 𝑡𝑜 𝑚𝑜𝑠𝑡𝑙𝑦 𝑠𝑢𝑠𝑝𝑒𝑛𝑑𝑒𝑑 − 𝑏𝑒𝑑 𝑚𝑎𝑡𝑒𝑟𝑖𝑎𝑙 𝑡𝑟𝑎𝑛𝑠𝑝𝑜𝑟𝑡 𝐸𝑥𝑝𝑜𝑛𝑒𝑛𝑡 = 0.64 𝑖𝑓 𝑉 ∗/𝑤 = 0.5 − 2.0 ( 𝑠𝑜𝑚𝑒 𝑠𝑢𝑠𝑝𝑒𝑛𝑑𝑒𝑑 − 𝑏𝑒𝑑 𝑚𝑎𝑡𝑒𝑟𝑖𝑎𝑙 𝑡𝑟𝑎𝑛𝑠𝑝𝑜𝑟𝑡) 𝐸𝑥𝑝𝑜𝑛𝑒𝑛𝑡 = 0.69 𝑖𝑓 𝑉 ∗/𝑤 > 2.0 (𝑚𝑜𝑠𝑡𝑙𝑦 𝑠𝑢𝑠𝑝𝑒𝑛𝑑𝑒𝑑 − 𝑏𝑒𝑑 𝑚𝑎𝑡𝑒𝑟𝑖𝑎𝑙 𝑡𝑟𝑎𝑛𝑠𝑝𝑜𝑟𝑡) 𝑑𝑠 = Depth of scour, m
𝑦0 = Average existing depth in contracted section, (m)
3.2 Local Scour
3.2.1 Types of Scour
There are 3 main components of total scour: 1. General scour of the riverbed
2. Contraction scour at the bridge cross section 3. Local scour around bridge piers and abutments
Local scour is removal of sediments from around bridge structures like piers, abutments, spurs, and embarkments. The formation of vortices is the basic mechanism causing local scour at piers or abutments. Disturbances to fluid flows will alter the velocity and pressure distributions around and downstream of the obstruction.
The transport rate into the region is smaller than the transport rate of sediment away from the base region, and, consequently, a scour hole develops. As increases in depth of scour, the strength of the horseshoe vortex is reduced, thereby reducing the transport rate from the base region. Eventually, for live-bed local scour, equilibrium is reestablished and scouring ceases. For clear-water scour, scouring ceases when the shear stress caused by the horseshoe vortex equals the critical shear stress of the sediment particles at the bottom of the scour hole.
Figure 6 Scour at a bridge pier (HEC-18, 2012)
Show the processes behind localized scour at piers and abutments. Vortices form upstream and downstream of pier and abutment.
Figure 7 Scour at a bridge abutment (HEC-18, 2012)
Factors which affect the magnitude of local scour at piers and abutments are (1) width of the pier, (2) discharge intercepted by the abutment and returned to the main channel at the abutment (in laboratory flumes this discharge is a function of projected length of an abutment into the flow), (3) length of the pier if skewed to flow, (4) depth of flow, (5) velocity of the approach flow, (6) size and gradation of bed material, (7) angle of attack of the approach flow to a pier or abutment, (8) shape of a pier or abutment, (9) bed configuration, (10) ice formation or jams, and (11) debris
3.3 Local scour - bridge piers
The design and configuration of a bridge substructure will impact on scour development at the bridge piers and abutments. Local scour at piers can lead to severe damage to footings as shown in Figure. The shape of the piers and the footing type alter the flow pattern around the pier. While pier design is dependent on-site specific factors such as the superstructure, soil conditions and construction procedures, the pier’s influence on the flow should also be considered.
Hydrodynamically shaped piers help reduce the generation of turbulent flow. Flow alignment will contribute to increased erosion. A river will respond to alterations to flow conditions through erosion until an equilibrium state is reached.
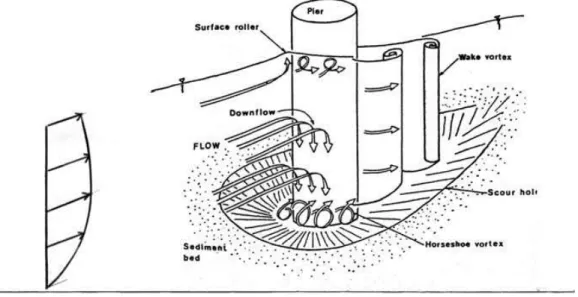
Figure 8 Schematic vortex structures around circular pier (Mojtaba Karimaei Tabarestani 2017)
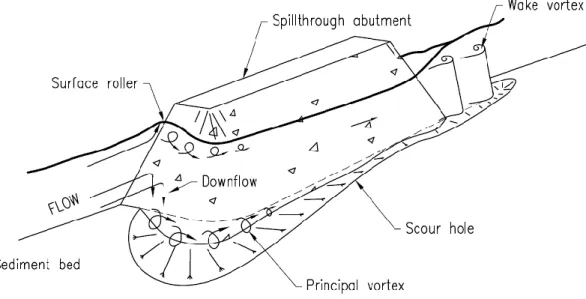
3.4 Local scour - bridge abutments
Scour occurs at abutments when the abutment and roadway embankment obstruct flow. Several causes of abutment failures during post-flood field inspections of bridge sites have been documented.
These failures were due to:
overtopping of abutments or approach embankments; lateral channel migration or stream widening processes; contraction scour; and/or,
local scour at one or both abutments
Flow through a bridge waterway narrowed by a bridge abutment is essentially flow around a short streamwise contraction. The characteristic flow features and the link between the contraction and the formation of a complex flow field around the abutments.
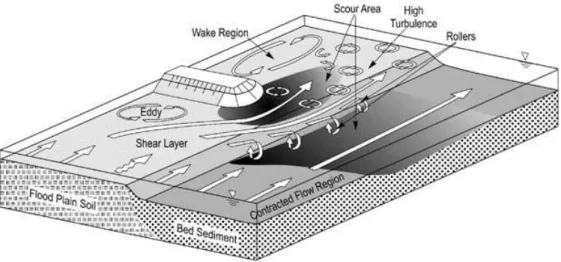
Abutment scour depends on the interaction of the flow obstructed by the approach and the flow in the main channel. The discharge returned to the main channel at the abutment is not simply a function of the abutment and roadway length. Abutment scour depth depends on abutment shape, flow in the main channel, flow intercepted by the abutment and directed to the main channel, sediment characteristics, cross-sectional shape of the main channel (especially the depth of flow in the main channel and depth of the overbank flow at the abutment), and alignment. In addition, field conditions may have tree-lined or vegetated banks, low velocities, and shallow depths upstream of the abutment. Most of the early laboratory research failed to replicate these field conditions.
Figure 9 Flow structure generated by floodplain/main channel flow interaction (NCHRP 2011b)
3.3 LOCAL SCOUR MECHANISM AROUND BRIDGE PIERS
3.3.1 General Information
Local scour is the erosive action of accelerated flow due to the presence of an obstacle (pier) in rivers and streams. As the flow passes the pier, mean flow velocity increases and vortices are formed at piers face. The formation of this flow pattern adjacent to a cylinder causes the scour.
3.3.2 LOCAL PIER SCOUR EQUATION
To determine pier scour, an equation based on the CSU equation is recommended for both live-bed and clear-water pier scour. The equation is:
𝑦
𝑠𝑦
1= 2.0 𝑘
1𝑘
2𝑘
3𝑘
4[
𝑎
𝑦
1]
0.65𝐹𝑟
1 0.43As a Rule of Thumb, the maximum scour depth for round nose piers aligned with the flow is: 𝑦𝑠 ≤ 2.4 times the pier width (a) for Fr ≤ 0.8
𝑦𝑠 ≤ 3.0 times the pier width (a) for Fr > 0.8
In terms of
𝑦
𝑠/a, Equation 6.1 is:𝑦
𝑠𝑎
= 2.0 𝑘
1𝑘
2𝑘
3𝑘
4[
𝑎
𝑦
1]
0.65𝐹𝑟
1 0.43 𝑦𝑠 = Scour depth, m (ft)𝑘1 = Correction factor for pier nose shape
𝑘2 = Correction factor for angle of attack of flow
𝑘3 = Correction factor for bed condition
𝑘4 = Correction factor for armoring by bed material size
a = Pier width, m (ft) L = Length of pier, m (ft)
𝐹𝑟1 = Froude Number directly upstream of the pier = 𝑉1/ (g∗ 𝑦1)1/2
𝑉1 = Mean velocity of flow directly upstream of the pier, m/s (ft/s)
g = Acceleration of gravity (9.81 m/𝑆2) (32.2 ft/𝑆2)
The correction factor, K2, for angle of attack of the flow, θ, is calculated using the following equation: K= (Cos θ + L/a Sin θ)0.65.
If L/a is larger than 12, use L/a = 12 as a maximum in Equation Notes:
1.) The correction factor K1 for pier nose shape should be determined using for angles of attack up to 5 degrees. For greater angles, K2 dominates and K1 should be considered as 1.0. If L/a is larger than 12, use the values for L/a = 12 as a maximum.
2.) The values of the correction factor K2 should be applied only when the field conditions are such that the entire length of the pier is subjected to the angle of attack of the flow. Use of this factor will result in a significant over-prediction of scour if (1) a portion of the pier is shielded from the direct impingement of the flow by an abutment or another pier; or (2) an abutment or another pier redirects the flow in a direction parallel to the pier. For such cases, judgment must be exercised to reduce the value of the K2 factor by selecting the effective length of the pier subjected to the angle of attack of the flow. Equation should be used for evaluation and design
3.) The correction factor K3 results from the fact that for plane-bed conditions, which is typical of most bridge sites for the flood frequencies employed in scour design, the maximum scour may be 10 percent greater than computed. In the unusual situation where a dune bed configuration with large dunes exists at a site during flood flow, the maximum pier scour may be 30 percent greater than the predicted equation value. This may occur on very large rivers, such as the Mississippi. For smaller streams that have a dune bed configuration at flood flow, the dunes will be smaller, and the maximum scour may be only 10 to 20 percent larger than.
4.) Piers set close to abutments (for example at the toe of a spill through abutment) must be carefully evaluated for the angle of attack and velocity of the flow coming around the abutment.
The correction factor K4 decreases scour depths for armoring of the scour hole for bed materials that have a D50 equal to or larger than 2.0 mm and D95 equal to or larger than 20 mm. The correction factor results from recent research by Molinas and Mueller. Molinass research for FHWA showed that when the approach velocity (V1) is less than the critical velocity (Vc90) of the D90 size of the bed material and there is a gradation in sizes in the bed material, the D90 will limit the scour depth.(30, 52) Mueller and Jones developed a K4 correction coefficient from a study of 384 field measurements of scour at bridges. The equation developed by Jones given in HEC-18 Third Edition should be replaced with the following:
- If 𝐷50 < 2 mm or 𝐷95 < 20 mm, then 𝑘4 = 1 - If 𝐷50 ≥ 2 mm and 𝐷95 ≥ 20 mm then:
𝑘
4= 0.4(𝑉
𝑅)0.15 Where,𝑉
𝑅=
𝑉1− 𝑉𝑖𝑐 𝐷50 𝑉𝑐 𝐷50− 𝑉𝑖𝑐 𝐷95> 0
and:𝑉𝑖𝑐 𝐷95 = the approach velocity (m/s or ft/sec) required to initiate scour at the pier for the grain size 𝐷𝑥 (m or ft)
𝑉
𝑖𝑐 𝐷95= 0.645 [
𝐷
𝑥𝑎
]
0.053
𝑉
𝑐 𝐷𝑥𝑉𝑐 𝐷𝑥 =the critical velocity (m/s or ft/s) for incipient motion for the grain size 𝐷𝑥 (m or ft)
𝑉𝑐 𝐷𝑥 = 𝐾𝑢 𝑦1 1/6
𝐷𝑥 1/3
𝑦1. = Depth of flow just upstream of the pier, excluding local scour, m (ft)
𝑉1 = Velocity of the approach flow just upstream of the pier, m/s (ft/s)
𝐷𝑥 = Grain size for which x percent of the bed material is finer, m (ft)
𝐾𝑢 = 6.19 SI Units
𝐾𝑢. = 11.17 English Units
While 𝑘4 provides a good fit with the field data the velocity ratio terms are so formed that if 𝐷50 is held
constant and 𝐷95 increases, the value of 𝑘4 increases rather than decreases.(53) For field data an
increase in 𝐷95 was always accompanied with an increase in 𝐷50. The minimum value of 𝑘4 is 0.4 and
3.4 CASE 1
3.4.1 Characteristic of CAHDOORA BRIDGE
The Chadoora Bridge is located at tehsil chadoora in budgam district Kashmir, India. This bridge connects the two important tehsils. The trade, communication and public transport fully depend on this bridge. It was constructed by R and B division Kashmir in the 2001 – 2002, the bridge is a balanced cantilever bridge with Total length of the bridge is 108.3mtr. It consists of 2 Dummy abutments and Solid wall type piers RCC with circular ends having open foundation. Two Balanced Cantilever bridges each supported on two piers formed by four longitudinal precast prestressed girders with 7.5mtr carriage way.
Figure 10 Chadoora Bridge taken after floods ( Azmat Hussain 2016)
The description of the substructure and superstructure of this bridge is listed below
The total length of the bridge deck system is 108.3mtrs and was supported by four piers in river section as Two Dummy abutment structures placed behind major deep drains located apart both riverbanks. The piers were solid wall type Reinforced concrete construction with circular ends having open foundation. The Dummy abutment structures are located on the bank of the river.
The bridge superstructure was consisting of 2 Balanced Cantilever type deck units each supported on two piers, formed by four longitudinal precast prestressed girders in tandem with cast in situ RCC diaphragms and deck slab forming the composite girder system. The cantilever arms of these units with articulation provision support shore span on one end and central suspended span on the other end. POT bearings are used at seating of girders of central span. At ends of the bridge deck, Strip seal movement joints are provided and at one end of the central suspended span only and all other three joints were hinged/rotation joints only for improved riding comfort.
3.4.2 Description of the collapse
The bridge is located at chadoora area on doodganga nallah, Jammu & Kashmir. The source of the doodganga Nallah is pir Panchal catchment. Bed grade of the Nallah is 1 in 39. Longitudinal slope of the Nallah is 1 in 1659. Catchment area is 300 to 630sqkm. Most common cause of failure of the bridges on river is scour. Scour is the result of the erosive action of the running water, excavating and carrying away material from stream beds and banks. Scour or soil erosion at a bridge is caused by the dynamic effects of the water in motion. The length of this bridge is 108.3metre long before flooding.
The main cause of the failure of this bridge is scour type failure. According to the reports, the discharge which was recorded earlier on 1973 was 5000 cusecs. But during the floods on 9 September 2014, it was 9504 cusecs. This high discharge is hardly a criterion for the failure of the Chadoora Bridge. The length of the bridge is 108.3mtrs, but during floods the linear waterway was recorded only 36.6mtrs which is negligible for such a major bridge. This waterway of the bridge was not enough to counteract the flood water. The flow of the water has been restricted to 36.6 meter with concentration of flow in only 27.8mtrs width while the bridge is about 108.3mtr in length with four piers in between and two side abutments. The waterway was grossly inadequate.
Debris changes both the geotechnical and hydraulic characteristics of a bridge. Debris accumulation in the bridge may result in substantial block in bridge opening, the waterway opening area is considerably reduced. With reduced waterway, velocity would increase, and greater scour depths would be involved, requiring deeper foundations. But after constructing the bridge, these things became negligible and lead to the failure of the bridges. Scouring around the foundation was taken place removed the fines from sand, gravel, boulder matrix. The scouring was predominant on upstream side and slightly less on the downstream side. That is why the pier first tilted towards upstream side and settled by about 30 – 40 cm. The scouring of the bridge has also taken place due to massive slides on river side of left abutment. The obvious cause of the scouring has been encroachment of almost 75% of total waterway, both on upstream and downstream side by the way of the creation of the eidgah and sumo stand respectively. The width of the eidgah and sumo stand is 71.7 mtrs. So, the total waterway was 36.6 meter only. This cause the scour of the pier.
Figure 11 The detailed site plan of the bridge (Azmat Hussain & Sumaira Jan 2016)
3.4.3 Lesson
The discharge of 9504 cusecs which should be pass through at least 91.5mtr width, only passed through 36.6m, thereby causing the scour failure of the bridge.
The construction of the shed, taxi stand etc reduced the waterway of the bridge and thereby not giving free and full passage of the flood to pass which lead to scour failure of the bridge.
3.4.4 Summary
By analyzing this failure in the bridges, the future planning can be better. Therefore, the aim should be to design the bridges for all times and for all occasions. Foundation of new bridges, bridges to be widened, replaced shall be designed to resist the scour for 100-year flood criteria, which may create the deepest scour
3.5 CASE 2
3.5.1 Characteristic of LANGI DURG ROAD BRIDGE
This bridge IS situated m Km. 26/6 on Lang Uurg Road near Balaghat district of state of Madhya Pradesh. India. Total length of the bridge is 30.50 mtr. It consists of 2 spans of 15.25 m. c/c. R. C. C. solid slab. C.R. Masonry in cement mortar 1:4 Open foundation in cement concrete 1:2:4. Two Balanced Cantilever bridges each supported on two piers formed by four longitudinal precast prestressed girders with 7.5mtr carriage way with 0.45 wide kerb.
The bridge is situated in Km. 26/6 on Langi Durg Road. It was constructed in the year I 980-81. This bridge has two solid slab spans of 15.25 meters each. The substructure is of solid coarse rubble stone masonry. The base dimensions of pier foundation are 3780 mm. in traffic direction and 10080 mm. in current direction at R.L. 94.00m. The pier foundation is resting on boulder strata.
Figure 12 Langi Durg Road Bridge (Pier Failure of Bridge and Geotechnical J. K. Jain 1998)
3.5.2 Description of the collapse
The foundation was resting on boulders strata about 5m below the lowest bed level. Position of pier is at the center of the stream. It is hilly track, the river flows with high velocity} and thus causing heavy scouring near the pier due to obstruction. The central portion of the stream got disturbed due to construction of pier at the center with the passage of time the binding material of boulders is taken away by the floods during rainy season. This process continued and the boulders so loosened are taken away by the floods and boulders strata below the foundation disturbed during the floods causing uneven settlement. Due to this the masonry pier collapsed. No damage or disturbance is seen in the masonry abutment and wing walls. During flood of 1995, the pier foundation unevenly settled causing collapse of masonry pier up to bed level. Due to this both the deck slab came at the bed level with no damage in them.
Figure 13 Showing no damage signs in abutment and wings (Pier Failure of Bridge and Geotechnical Investigation – J.K. Jain, 1998)
ii) Design Investigations
The foundation of the pier is checked for base pressure with maximum and minimum loads and calculations shows that the foundation sizes provided are adequate. The maximum base pressure at R.L. 94.00 m is 30.68 T/m2 and minimum base pressure is 8.04 T/m2. These base pressures are within maximum permissible limits and no tension on foundation base.
The pier section at R.L. 98.80 m is also checked and maximum stress about this level is 37.75 T/m2 and minimum stress is 11.44 T 1m2 in compression. No tension is observed at this level hence sections provided are adequate.
Hence the failure of pier foundation and pier is not due to the insufficient design requirements
The investigation shows that heavy flood with high velocity caused removal of binding soil between the boulders. The process accelerated due to obstruction at the mid-stream by construction of pier at the center. The floating material and tree logs damaged the masonry leading to failure of pier and consequently the collapse of the complete bridge.
3.5.3 Lesson
In boulders strata it is very difficult to decide the foundation level. As the streams in the hilly track flows with high velocity disturbs the binding soil of the boulders and the strata becomes hollow the foundations get loosened and with passage of time due to uneven settlement such failure takes placed.
3.5.4 Summary
Hence the failure of pier foundation and pier is not due to the insufficient design requirements
The investigation shows that heavy flood with high velocity caused removal of binding soil between the boulders. The process accelerated due to obstruction at the mid-stream by construction of pier at the center. The floating material and tree logs damaged the masonry leading to failure of pier and consequently the collapse of the complete bridge.
3.6 CASE 3
3.6.1 Characteristic of JAHU BRIDGE
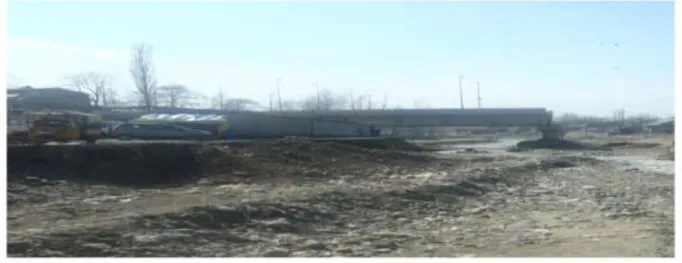
The bridge was located at distance of 460 km from New Delhi and 30 km from District Hamirpur. This is important link road which serves and connect three districts Mandi, Bilaspur and Hamirpur. This Point is considered as the center of Himachal Pradesh. On August 11, 2007 & August 12, 2007 due to heavy rain the concrete bridge got collapsed. Then with in two-year government constructed a new bridge over the site. But on August 14th, 2014 the steel bridge also got collapsed due to soil erosion from foundation. This study is important because bridge collapsed two times due to same reason i.e. scouring of foundation. Local scour around the bridge abutment is one of the most critical causes of bridge failure.
Figure 14 Collapse of Jahu Bridge – (Jahu Bridge, Pankaj, 2018)
The site of bridge is at very critical point where two rivers i.e. Seerkhadd and Jabothi khadd meets each other. During summer these rivers have very low water level. The main source of water is only rain, which fed these rivers during Monsoon. The mean annual precipitation of Jahu (Himachal Pradesh, India) is 1411mm and the mean annual temperature is 21.9°𝐶. The site includes clay and loose rocky strata with boulder deposits.
Bridge type Concrete bridge (arch bridge) Span 56.30m Damaged Portion of bridge 30.72m Total damaged portion with surrounding 92m Construction era 1961-1966 Foundation Shallow foundation.
The construction of Jahu bridge was during third five-year plan (1961-1966). The span of bridge was 56.30m and damaged portion of bridge due to vented causeway was 30.72 m. The bridge was resting over two abutment and pier was located at the center. Load is transferring between pier and abutment is by mean of arch.
3.6.2 Description of the collapse
Scouring of foundation is considered primary causes of failure as it occupies around 60% of total bridge failure together with other hydraulic causes. This bridge collapsed mainly due to scouring of soil below the foundation. Scouring of foundation can occur all over the year, it reaches peak when flood comes in water body over which a bridge is spanning. History of bridge failure indicates scouring of streambed around abutments and piers of bridge, led to maximum bridge failures.
Figure 15 Plan of Seer Khadd Showing Damaged Portion – (Jahu Bridge, Pankaj, 2018)
Scour at bridges is a very complex process. Scour and channel instability processes, including local scour at the piers and abutments, contraction scour, channel bed degradation, channel widening, and lateral migration, can occur simultaneously.
The sum and interaction of all these river processes create a very complex phenomenon that has, so far, eluded mathematical modeling. To further complicate a mathematical solution, mitigation measures, such as riprap, grout bags, and gabions, may be in place at the abutments and piers. Any mathematical model would have to account for these structures as well. The interactions of the processes of local scour, contraction scour, channel bed degradation, channel widening, and lateral migration are unknown. The total vertical erosion at the bridge is then simply the sum of the scour and bed degradation. Because no other formation is available, this assumption provides a conservative estimate. Lateral channel instabilities are typically considered separately from scour and bed degradation, and the estimate of their effect on bridge foundations is often based on judgment and experience. The interactions of scour and channel instabilities are very difficult to predict. Certainly, the processes may not be independent but rather related to each other and the resulting impact on the bridge.
3.6.3 Lesson
It became important to under water inspection or instrumentation as a bridge management tool i.e. visual monitoring followed by flood watch and follow-up monitoring of scour for critical bridges. Use of modern techniques: - The use of wireless and remote sensors enables the movements of bridges to be monitored around the clock. This is most desirable in flood situations. Modern sensors, when installed on scour critical bridges, minimize the possibility of collapse and serve as a warning for a bridge to be closed. Depth of foundation is not only preferred according to design some time according to location it may vary. The way of river should be properly cleaned such that to avoid meandering of river. A proactive approach must be made in order to limit any of the effects from concrete spalling. Investigation through non-destructive methods can provide information early on so a preemptive response can be conducted. Examples of non-destructive methods include ground penetrating radar (GPR) and infrared analysis. Ultimately, a regular inspection schedule is crucial for proper care of any bridge structure.
3.6.4 Summary
Poor communication between the various design professionals involved and supervision. Poor communication between fabrications and erectors. This type of bridge requires proper repair and maintenance, so if there is any crack then it must apply grouting operation. But there should not be such operation was made.
CHAPTER 4: FAILURES DUE TO GENERAL COLLAPSE
4.1 General Collapse
Following is a list of causes of failures which are very General: 1. Design
a. Incompetent men in charge of design, construction or inspection
b. Supervision and maintenance by men without necessary knowledge or experience c. Lack of enough preliminary information
d. Revision of design by persons lacking knowledge of the original requirements 2. Negligence during construction
a. A contractor takes a chance while completely aware of the risks involved
b. An engineer, usually competent and careful, shows negligence in some part of a design c. Lack of coordination in production of plans, construction procedures and inspection 3. Economy
a. Restrictions in initial cost b. Lack of maintenance
4.1.1 Member Failure
Member failure causes dynamic behavior of a truss bridge, and displacement in the dynamic behavior can exceed that in the static behavior. Therefore, dynamic analysis would be relevant for evaluating the behavior of a truss bridge after member failure. Yet dynamic analysis requires much computational time, and the redundancy investigation usually requires a large number of analyses in each of which the failure of a different member is assumed, since the member to fail cannot be singled out in general.
In 2007 a truss bridge in Japan was found to have a severed member due to corrosion. Fortunately, the bridge escaped the complete collapse. In 2010, a concrete bridge in Japan lost one of its bridge piers due to scour, but still held on.
4.1.2 Lack of attraction to critical details
Failure of connections due to overstress from bolt tightening, failure of formwork, local buckling of scaffolding, crane collapse. The stability of girders during stage construction and the deck placement sequence need to be investigated and the temporary bracing provided. Expansion bearings need to be temporarily restrained during erection.
4.1.3 Corrosion
For steel bridges one of the most dominant forms of deterioration is corrosion. The major effect of corrosion is the loss of metal section resulting in a reduction of structural carrying capacity. Three possible changes to a steel girder bridge can be considered; an increase in stress, a change in geometric properties (e.g. decrease of section modulus), and a buildup of corrosion products.