The
Jour
nal
of
P
hysiology
Neuroscience
Short-term monocular deprivation alters early components
of visual evoked potentials
Claudia Lunghi
1,2, Marika Berchicci
3, M. Concetta Morrone
1,4and Francesco Di Russo
3,51Department of Translational Research on New Technologies in Medicine and Surgery, University of Pisa, via Savi 10, 56126, Pisa, Italy 2Institute of Neuroscience, CNR, via Moruzzi 1, 56127, Pisa, Italy
3Department of Movement, Human and Health Sciences, University of Rome ‘Foro Italico’, Piazza Lauro de Bosis 15, 00135 Rome (RM), Italy 4Scientific Institute Stella Maris (IRCSS), Calambrone (Pisa), Italy
5Santa Lucia Foundation IRCCS, via Ardeatina 280, 00144 Rome (RM), Italy
Key points
r
Short-term monocular deprivation in adult humans produces a perceptual boost of thedeprived eye reflecting homeostatic plasticity.
r
Visual evoked potentials (VEPs) to transient stimuli change after 150 min of monoculardeprivation in adult humans.
r
The amplitude of the C1 component of the VEP at a latency of about 100 ms increases for the deprived eye and decreases for the non-deprived eye after deprivation, the two effects being highly negatively correlated.r
Similarly, the evoked alpha rhythm increases after deprivation for the deprived eye and decreases for the non-deprived eye.r
The data demonstrate that primary visual cortex excitability is altered by a short period ofmonocular deprivation, reflecting homeostatic plasticity.
Abstract Very little is known about plasticity in the adult visual cortex. In recent years
psychophysical studies have shown that short-term monocular deprivation alters visual perception in adult humans. Specifically, after 150 min of monocular deprivation the deprived eye strongly dominates the dynamics of binocular rivalry, reflecting homeostatic plasticity. Here we investigate the neural mechanisms underlying this form of short-term visual cortical plasticity by measuring visual evoked potentials (VEPs) on the scalp of adult humans during monocular stimulation before and after 150 min of monocular deprivation. We found that monocular deprivation had opposite effects on the amplitude of the earliest component of the VEP (C1) for the deprived and non-deprived eye stimulation. C1 amplitude increased (+66%) for the deprived eye, while it decreased (−29%) for the non-deprived eye. Source localization analysis confirmed that the C1 originates in the primary visual cortex. We further report that following monocular deprivation, the amplitude of the peak of the evoked alpha spectrum increased on average by 23% for the deprived eye and decreased on average by 10% for the non-deprived eye, indicating a change in cortical excitability. These results indicate that a brief period of monocular deprivation alters interocular balance in the primary visual cortex of adult humans by both boosting the activity of the deprived eye and reducing the activity of the non-deprived eye. This indicates a high level of residual homeostatic plasticity in the adult human primary visual cortex, probably mediated by a change in cortical excitability.
(Resubmitted 16 May 2015; accepted after revision 22 June 2015; first published online 26 June 2015)
Corresponding author F. Di Russo: Department of Movement, Human and Health Sciences, University of Rome ‘Foro
Italico’, Piazza Lauro de Bosis 15, 00135 Rome (RM), Italy. Email: [email protected]
Abbreviations EEG, electroencephalography; ERP, event related potential; TMS, transcranial magnetic stimulation; VEP, visual evoked potential.
Introduction
Neuroplasticity is an intrinsic property of the cerebral cortex that ensures the capability of the organism to adapt to environmental changes through a modification of neural circuitry and is the basis of fundamental processes, such as learning and memory, that are preserved during the lifespan (Pascual-Leone et al. 2005). During development, neuroplasticity plays a crucial role in refining sensory cortical organization. One of the exemplary cases is that of the visual system: within a specific temporal window called the critical period (Wiesel, 1982; Berardi et al. 2000; Hensch, 2005), neuroplasticity enables the shaping of the immature visual cortex by visual experience, so that the developing visual cortex is vulnerable even to short periods of abnormal visual experience (such as mono-cular deprivation: Wiesel & Hubel, 1963b; Hubel et al. 1977; Blakemore et al. 1978). While experience-dependent plasticity is reduced after the closure of the critical period, a growing body of evidence has demonstrated a residual plastic potential of adult visual cortex (Blakemore et al. 1978; Issa et al. 1999; Sawtell et al. 2003; Pham et al. 2004; Tagawa et al. 2005). In humans, recent studies show that manipulating visual experience even for short peri-ods of time profoundly alters the visual perception of adults (Kwon et al. 2009; Klink et al. 2010; Lunghi et al. 2011, 2013; Bao & Engel, 2012; Zhou et al. 2013a,b). In particular, Lunghi et al. (2011) have reported that a short period of monocular deprivation unexpectedly boosts the deprived eye responses for a period longer than the deprivation itself, increasing dramatically the perceptual dominance duration of visual stimuli presented to the deprived eye during binocular rivalry (Lunghi et al. 2011). The perceptual boost of the deprived eye was measurable up to 180 min after re-exposure to binocular vision (Lunghi et al. 2013), but was not observed after 30 min of monocular deprivation (Lunghi et al. 2013), pointing to a cortical origin of the effect. Even though the results of Lunghi et al. (2011, 2013) clearly indicated a potentiation of the deprived compared to non-deprived eye responses after monocular deprivation, the psychophysical measurements could not disentangle the contribution of the two eyes to the observed effect or the contribution of different stages of visual processing (lower vs. higher visual areas).
Here, we performed an electrophysiological experiment to investigate the modulation of pattern-onset visual evoked potentials (VEPs) during independent visual
stimulation of the two eyes before and after 150 min of monocular deprivation in adult humans. The earliest (peaking between 60 and 100 ms post-stimulus) VEP component, named C1 (Jeffreys & Axford, 1972), has been related to the cortical activity produced by retinotopic visual areas of the primary visual cortex, V1 (for a review see Di Russo & Pitzalis, 2014). Three typical components of VEP, the P1, the N1 and the P2, with onset later than C1, reflect the combined sum of the activity of several visual areas. The P1 source has been localized in areas V3A and V4 in the 105–140 ms time window; the N1 (150–180 ms) probably originates in parietal areas and in V3A (Di Russo et al. 2002); the P2 (200–250 ms) seems to mainly represent re-entrant feedback activity in area V1 (Di Russo et al. 2002, 2003).
Important information about the neural mechanisms involved in visual plasticity can be obtained from the analysis of brain rhythms, which are thought to originate from neuronal synchronization and are strictly related to GABAergic interneuron activity (Klimesch et al. 2007; Muthukumaraswamy et al. 2013). In fact, one of the crucial neural mechanisms regulating neuroplasticity is the balance between intracortical excitation and inhibition. The development of GABAergic inhibition is necessary to trigger ocular dominance plasticity (Hensch et al. 1998; Fagiolini & Hensch, 2000), and changing the balance between excitation and inhibition in the primary visual cortex (directly or indirectly) can restore ocular dominance plasticity in adult animals (Pizzorusso et al. 2002; Sale et al. 2007; Maya Vetencourt et al. 2008; Harauzov et al. 2010; Morishita et al. 2010).
On the basis of the eye deprivation and VEP literature, we predict that the monocular deprivation should mainly affect the earliest visual processing in V1 represented by the C1; however, modulation of the P2 cannot be excluded, as this component has been shown to represent a second, later activation of V1, probably driven by a combination of feed-forward and feedback activity (Di Russo et al. 2002, 2003).
Methods
Participants
A total of 21 subjects (11 female; mean age ± SD: 24.6 ± 3.85 years) participated in this study. However, the data from four subjects were discarded from all analyses due to ocular artifacts (excessive eye blinking),
the data from two subjects were discarded because of a low signal-to-noise ratio in the electroencephalography (EEG) signal, and the data from a further two subjects were discarded because of sight problems (amblyopia and detached retina in one eye) that were communicated to the experimenters only after the experiment. Thirteen subjects remained (6 female; mean age± SD: 23.67 ± 3.27 years). Exclusion criteria consisted of any current major neurological illness, or current or historic incidence of psychiatric illness. All subjects had normal or corrected-to-normal vision. The experimental protocol was approved by the Tuscany regional ethics committee of the Azienda Ospedaliero-Universitario Meyer and was performed in accordance with the Declaration of Helsinki. All of the participants gave written informed consent.
Apparatus and stimuli
The experiment took place in a dimly lit and quiet room. Visual stimuli were generated by a VSG 2/5 (Cambridge Research Systems, Rochester, UK), connected to a PC (Dell) and controlled by MATLAB programs. The visual stimuli were presented on a linearized 21 inch monitor (Philips 201B; resolution 944 pixels× 728 pixels, refresh rate 120 Hz) and the viewing distance was set at 57 cm. Visual stimuli consisted of horizontal sinusoidal gratings (size 4 deg of visual angle, spatial frequency 2 cycles deg−1, contrast 64%). A fixation dot (diameter 0.3 deg of visual angle) was constantly presented at the centre of the screen. The colour of the fixation dot was varied from black to red for 100 ms every 3–6 s. The visual stimuli were transiently displayed (presentation duration 100 ms) on the upper visual field in central vision (the centre of the stimulus was 3 deg above the fixation dot) at a rate randomly varying from 1 to 2 Hz (inter-stimulus interval ranging from 0.5 to 1 s). The visual stimuli were presented on a uniform grey background (luminance 22 cd m−2).
Procedure
The participants were individually tested after a 64-channel EEG active-cap was mounted on their scalp. Participants were first measured for their eye dominance using the Porta test. The delivery of visual stimuli (i.e. stimulation) was always monocular. Two experimental sessions were performed, one before and one after 150 min of monocular deprivation; every session was divided into two parts in which each eye was stimulated separately while the other eye was patched. Before monocular deprivation, the deprived eye was stimulated first, so that the second part of the session corresponded with the beginning of the 150 min deprivation. Afterwards, the second experimental session started with the stimulation of the non-dominant eye, so that the second part of the session coincided with
the end of deprivation. Each experimental session (pre-and post-deprivation) consisted of four runs (each one consisting of 400 stimulus presentations and lasting about 5 min) in order to deliver 800 stimuli to each eye. During the experimental session, participants were instructed to maintain a stable fixation on the central dot. In order to be sure that participants were directing their attention to the fixation dot, at the end of each run participants were asked how many times the dot changed in colour. If the number of dot changes reported by the participant was largely different (±10 dot count) from the actual number of changes, the session was discarded. During the 150 min of monocular deprivation, the dominant eye was occluded by a translucent eye-patch, which allowed light to reach the retina (15% attenuation), but no pattern information. Participants were asked to keep the EEG cap on their scalp to avoid electrode displacement between the two experimental sessions; for this reason participants spent the 150 min of monocular deprivation in the lab.
Electrophysiological recording and data analysis The continuous EEG was recorded using the Brain-Vision system with 64 active (ActiCap) electrodes (BrainProducts GmbH, Munich, Germany), which were mounted according to the International 10–10 system and referenced to the left mastoid (M1). Horizontal eye movements were monitored from electrodes at the left and right outer canthi. Blinks and vertical eye movements were recorded with an electrode below the left eye, which was referenced to the Fp1 site. The EEG recording was digitized at 250 Hz with an amplifier band-pass (0.01–100 Hz), including a 50 Hz notch filter, and was stored for off-line averaging.
Offline analysis was performed using the BrainVision Analyser 2.0.1 software (Brain Products GmbH). The EEG signal was separately segmented into 600 ms epochs (from 100 ms before, to 500 ms after, stimulus onset) for the dominant and non-dominant eye. Raw EEG data were visually inspected to identify and discard epochs contaminated with artifacts prior to the signal averaging. The trials with artifacts (e.g. blinks or gross movements) and amplitude exceeding the threshold of± 90 μV were automatically excluded from the averaging, whereas eye movement artifacts were processed using the Gratton and Coles algorithm (Gratton et al. 1983). To further reduce high- and low-frequency noise, the group-averaged event related potentials (ERPs) were band-pass filtered (1–30 Hz).
Peaks amplitude (measured with respect to the 100 ms pre-stimulus baseline) and latency of the major VEP components were calculated for each subject in the following standard time windows: the C1 (70–120 ms), the P1 (80–150 ms), the N1 (130–200 ms) and the P2
(180–300 ms). The components’ identification was also guided by their polarity and topography as described elsewhere (Di Russo et al. 2006, 2010; Di Russo & Pitzalis, 2014). The electrodes used for the analyses were selected based on the individual peak for each component (e.g. the C1 on Cz/Pz/POz; the P1, N1 and P2 on the POz/Oz/PO7/PO8 sites).
The EEG signal was also separately segmented into 700 ms epochs (from 300 to 1000 ms after stimulus onset) for the deprived and non-deprived eye to analyse the data in the frequency domain. After performing the artifact rejection following the procedure reported for the ERP analyses, a digital fast Fourier transform (FFT)-based amplitude spectrum analysis (Hanning window function 10%, no phase shift) with 1 Hz frequency resolution was computed. The alpha (8–13 Hz) frequency band was studied. The choice of fixed EEG band did not account for individual alpha frequency (IAF) peak, defined as the frequency associated with the strongest EEG amplitude at the extended alpha range (Klimesch, 1999).
To visualize the voltage topography of the EEG components, spline interpolated 3-D maps were constructed using the BESA 2000 software (MEGIS Software GmbH, Gr¨afelfing, Germany).
Source localization
Estimation of dipolar sources of the C1 component was carried out using BESA version 5.1.8 (MEGIS Software GmbH). The spatiotemporal dipole analysis of BESA estimates the location and orientation, as well as the time course, of multiple equivalent dipolar sources by calculating the scalp distribution, which is obtained for any given source model (forward solution) and comparing it with the actual VEP distribution. Interactive changes in the location and orientation of dipole sources lead to the minimization of residual variance (RV) between the model and the observed spatiotemporal distribution of the component. The goodness of the dipole model was evaluated by measuring its RV as a percentage of the signal variance, as described by the model, and by applying residual orthogonality tests (ROTs, e.g. Bocker et al. 1994). The 3-D coordinates for each dipole of the BESA model were determined with respect to the Talairach axes and scaled according to the brain size. In these calculations, BESA utilized a realistic approximation of the head (which was based on magnetic resonance imaging (MRI) of 24 subjects), and the radius was obtained from the group average (86 mm). To limit the number of parameters to be estimated, a single dipole was fitted in a given latency range (70–90 ms) to correspond with the distinctive component in the waveform (for further details see Di Russo et al. 2002). All t statistics were evaluated for significance at the 5% level.
Analyses
To evaluate statistically the time windows in which the averaged activity was different from baseline signal, a t test against zero (baseline) was preliminarily performed for the relevant electrodes. Afterwards, a repeated measures ANOVA and paired-samples t tests were separately performed for each of the components and the relevant electrodes across EYE (deprived vs. non-deprived) and TIME (pre- vs. post-deprivation). The overallα level was fixed at 0.05.
Results
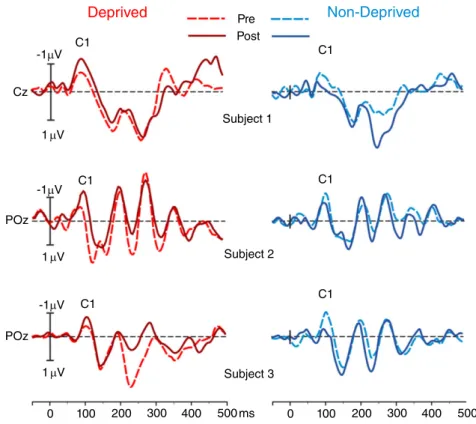
The individual pre- and post-deprivation waveforms for both deprived (red lines) and non-deprived (blue lines) eyes from three representative participants are displayed in Fig. 1. The pre-deprivation (dashed lines) and the post-deprivation (continuous lines) experimental sessions are superimposed for each eye. The C1 component, peaking at about 100 ms (average latencies are reported in Table 1), is reported in the figure for the individual peak electrode, because of the variability in the anatomy of the calcarine sulcus (Hinds et al. 2009) and consequently the source orientation (Di Russo et al. 2003). The same variability could explain the impossibility to localize the C1 component in the averaged waveforms of one subject whose data were then excluded from the analyses on this component. We found that monocular deprivation had opposite effects on the amplitudes of the C1 component for the two eyes: after deprivation, the C1 amplitude increased on average by 66% for the deprived eye, while it decreased on average by 29% for the non-deprived eye.
Individual subjects’ and average C1 amplitudes for the two eyes acquired pre- and post-deprivation are reported in Fig. 2A. A 2 × 2 repeated measures ANOVA revealed a significant interaction (F(11,1)= 28.61, P < 0.001) between the factors EYE (deprived and non-deprived) and TIME (pre- and post-deprivation). A post hoc test (Bonferroni) for pairwise comparisons revealed a significant difference in the C1 amplitude between pre- and post-deprivation both for the deprived (deprived eye C1 amplitude: pre-deprivation, mean ± SEM = −1.06 ± 0.18 μV; post-deprivation, mean± SEM = −1.76 ± 0.23 μV, t(11)= 5.3, P = 0.0015) and non-deprived eye (non-deprived eye C1 amplitude: pre-deprivation, mean ± SEM = −1.67 ± 0.25 μV; post-deprivation, mean ± SEM = −1.19 ± 0.21 μV, t(11) = 3.64, P = 0.023). A significant difference in the C1 amplitude between the deprived and non-deprived eye was found both for pre- (deprived eye < non-deprived eye, t(11) = 4.62, P = 0.004) and post-deprivation measurements (deprived eye > non-deprived eye, t(11) = 4.32, P = 0.007). No significant differences were
found regarding the C1 latency. Interestingly, we also found that the changes in C1 amplitude for the deprived and non-deprived eye were highly correlated across sub-jects (Fig. 2B, Spearman’s rank correlation coefficient ρ = 0.63, two-tailed exact permutation test P = 0.033, 95% confidence intervals: upper 0.884, lower 0.088), so that participants whose C1 amplitude for the deprived eye increased the most after monocular deprivation also showed the greatest decrease in C1 amplitude for the non-deprived eye.
Figure 3A shows the grand-averaged waveforms of the VEP for both the deprived (red lines; upper panel) and the non-deprived (blue lines; lower panel) eye. The C1 component is shown in the figure for Cz. Figure 3B shows the scalp topography of the C1 component. Given the well-known lack of differences across eye and time, the VEP topography is obtained collapsing all the data. We ran the source localization analysis on the C1, confirming that this component actually originates in V1. As shown in Fig. 3C, the localization and the orientation of the C1 is displayed on a 3-D realistic brain template, with a red circle showing its position in the calcarine cortex in the lower bank of area V1 (Talairach coordinates:−10, −90, −6, Brodmann area 17). The source orientation (red vector), pointing dorsally well explains the scalp topography. This model explained more than the 95% of the VEP variance in the 70–90 ms interval leaving a RV of 4.85%.
A significant interaction between the factors EYE (deprived and non-deprived) and TIME (pre- and post-deprivation) was found for the peak amplitude of both the P1 (F(11,1) = 9.28, P = 0.011) and P2 (F(12,1) = 6.02, P = 0.03) components, indicating a propagation of the effect observed for the C1 component to higher-order visual areas. A post hoc test (Bonferroni) for pairwise comparisons revealed a significant difference in the P1 amplitude between the deprived and non-deprived eye for pre-deprivation measurements (deprived eye P1 amplitude, mean± SEM = 3.16 ± 0.43μV; non-deprived eye P1 amplitude, mean ± SEM = 2.2 ± 0.4 μV, t(11) = 43.74, P = 0.02). A significan main effect of the factor EYE (deprived and non-deprived) was found for the peak amplitude of the N1 component (F(11,1)= 10.14, P = 0.009), but no main effect of the factor TIME (pre- and post-deprivation) or interaction between the two factors, indicating that monocular deprivation did not alter the N1 component. No statistical differences between pre- and post-deprivation latencies were found for the later VEP components (P1, N1 and P2). Figure 4A displays the grand-averaged waveforms of the later VEP components on POz both for the deprived (red lines; upper panel) and the non-deprived (blue lines; lower panel) eye, where pre- and post-deprivation are superimposed. Figure 4B displays the topographical maps for the VEP components: the first map displays the
Cz POz POz C1 C1 C1 C1 C1 C1 Subject 1 Subject 2 Subject 3 Pre Post Deprived Non-Deprived -1µV -1µV -1µV 1 µV 1 µV 1 µV 0 100 200 300 400 500 ms 0 100 200 300 400 500 ms
Figure 1. Averaged event-related potential (ERP) waveforms from three representative subjects
The electrodes where the individual C1 amplitude showed the maximum peak are displayed. The waveforms from the pre-(dotted lines) and post- (continuous lines) deprivation are superimposed for the deprived (red lines, left panel) and non-deprived (blue lines, right panel) eye.
Table 1. Latencies (ms) of the principal components of the VEP
Deprived eye Non-dep eye
VEP component Pre Post Pre Post
C1 90.00± 3.67 98.00± 3.86 98.00± 5.08 96.34± 5.58
P1 138.34± 3.57 142.00± 3.8 144.33± 4.67 146.33± 4.3
N1 193.34± 3.32 197.34± 4.47 194.34± 6.29 192.00± 5.46
The mean± 1 SEM is reported for the three principal components of the VEP (C1, P1, N1) for the deprived and non-deprived eye and for the pre- and post-deprivation measurements. There were no statistical differences in latency between pre- and post-deprivation measurements for either component.
topography of the P1 component, which is characterized by positivity on middle parietal–occipital regions. The central map shows the N1 component characterized by negativity over bilateral occipital regions, roughly overlying multiple extrastriate cortical areas. The last map shows the topography of the P2 component, consisting of a positive activity over medial occipital brain areas.
We also measured the amplitude spectra of the VEPs before and after monocular deprivation. Comparison of the pre- and post-deprivation averaged spectra between the deprived and non-deprived eye permitted the identification of the alpha band peak for each participant. Since the alpha peak amplitudes of one subject were four times larger than the group-averaged
alpha peak amplitudes, these data were excluded from further analyses in the frequency domain. The averaged spectra are provided in Fig. 5A and B. The spectra show a sharp, clear peak at 11 Hz that markedly increased post-deprivation for the deprived eye (Fig. 5A) and decreased for the non-deprived eye (Fig. 5B). The change in the peak amplitude of the alpha spectrum before and after deprivation for the deprived and non-deprived eye is shown in Fig. 5C for both the group average and individual data: for the deprived eye, the peak amplitude significantly increased following monocular deprivation (+23%, t(11) = 5.16, P = 0.0003), and decreased for the non-deprived eye (−10%, t(11)= 2.65, P= 0.022). Deprived Eye -3 -2 -1 0 baseline C1 peak amplitude ( µV)
deprivation baseline deprivation Non-Deprived eye (post/pre)
Depr iv ed e ye (post/pr e) 0.4 0.6 0.8 1.0 1 0 2 3 4 5 6 rho = 0.63 p = 0.033 Non-Deprived Eye C1 amplitude
A
B
Figure 2. C1 component peak analysis
The average and the individual observers’ peak amplitudes of the C1 component recorded before and after deprivation are plotted for the deprived (A, red symbols) and non-deprived eye (B, blue symbols). Peak C1 amplitudes recorded before and after deprivation are statistically different both for the deprived and non-deprived eye (∗P< 0.05,∗∗P< 0.01). C, the individual ratios between C1 peak amplitude acquired post- and pre-deprivation
for the deprived and non-deprived eye are plotted against each other, the change in peak amplitude for the deprived and non-deprived eye strongly correlates across subjects.
Discussion
We found that, in adult humans, 150 min of mono-cular deprivation alter visual cortical activity evoked by stimulation of both the deprived and non-deprived eye. Specifically, we report opposite deprivation-induced changes in the amplitude of the C1 component for the two eyes: the C1 component increased in amplitude for the deprived eye, while it decreased for the non-deprived eye, and this opposite effect of deprivation propagated to later components of the VEP, P1 and P2. We also found that, after deprivation, the peak amplitude in the alpha band increased during stimulation of the deprived eye, while it decreased for the non-deprived eye.
These results are not only in agreement with studies showing that after 150 min of monocular deprivation perceptual dominance of the deprived eye is increased during binocular rivalry (Lunghi et al. 2011, 2013), but clarify some issues that could not be explained by psychophysics, specifically the neural locus of the effect and the relative contribution of the deprived and non-deprived eye to the effect.
Firstly, our data clarify at which level of visual processing the effect of monocular deprivation takes place: we clearly show that monocular deprivation affects neural activity at early stages of visual processing (i.e. V1), in fact we found a change in the amplitude of the C1 component following deprivation. Considerable converging evidence from many studies also combining functional magnetic resonance (fMRI) and VEP source analysis with different
kinds of visual stimulation has confirmed the primary visual cortex as the generator of the C1 component (reviewed in Di Russo & Pitzalis, 2014), which was also confirmed by the dipole source localization in the pre-sent study. Therefore, the C1 seems to be a ubiquitous phenomenon related to the activity of area V1, probably reflecting the cortical stream from the lateral geniculate nucleus. However, although the bulk of evidence is about the C1 origin in V1, there are some data showing that the later part of C1 may originate from extrastriate areas such as V2 and V3 (Simpson et al. 1995; Ales et al. 2010), MT+ (Pitzalis et al. 2012) or frontal areas (Simpson et al. 1995; Ales et al. 2010). Moreover, the later part of the C1 was localized in the intraparietal sulcus and in area V6 using motion-onset stimuli (Pitzalis et al. 2012, 2013). In any case these early activities outside V1 were seen for pattern-reversal and motion VEP and not for pattern-onset VEP (Di Russo & Pitzalis, 2014). The P1 and the N1 have been localized by the aforementioned studies in extrastriate areas indicating that the effect of monocular deprivation originates in V1 and propagates to extrastriate visual areas, as reflected by the alteration of the P1 component observed following monocular deprivation. Both the P1 and P2 components showed similar effects to the negative C1, being more negative (less positive) after the deprivation in the deprived eye and showing an opposite pattern for the other eye. The change in the P2 component amplitude reported here confirms previous studies interpreting the P2 mainly as re-entrant activity in V1 (Di Russo et al. 2002, 2003).
Cz Cz
A
C1 Deprived Non-Deprived -1µV -1µV +1µV +1µV µV 0 100 200 300 400 ms 0 100 200 300 400 ms -1.0 +1.0 LH Pre C1 PostB
C
Figure 3. Average C1 component waveform, topography and source analysis
A, grand average (from−50 to 400 ms) of the VEP
waveforms on the medial central (Cz) electrode, where the C1 component showed the maximum peak. The waveforms from the pre- (dotted lines) and post- (continuous lines) deprivation experimental sessions are superimposed for the deprived (red lines, top panel) and non-deprived (blue lines, bottom panel) eye. B, topographical map of the C1 component. C, the source model of the C1 component projected on a realistic 3-D model of the brain. LH, Left Hemisphere.
Secondly, psychophysical studies only reported increased perceptual dominance during binocular rivalry (Lunghi et al. 2011, 2013) and increased apparent contrast (Lunghi et al. 2011) for the deprived eye relative to non-deprived eye, without distinguishing the separate contribution of the two eyes to the effect of monocular deprivation. Here we show that monocular deprivation affects early cortical activity differently for the two eyes, revealing that the increase in perceptual eye dominance demonstrated by Lunghi et al. (2011, 2013) is due both to a concurrent strengthening of the deprived eye and to a weakening of the non-deprived eye activity. In their first study, Lunghi et al. (2011) reported that after monocular deprivation not only the perceptual predominance of the stimulus presented to the deprived eye increased during binocular rivalry, but also that the apparent contrast was changed: visual stimuli presented to the non-deprived eye needed to be 36% higher in contrast compared with stimuli presented to the non-deprived eye in order to be perceived as equally contrasted (Lunghi et al. 2011).
Previous studies reported modulation of C1 amplitude in adults during different forms of learning, such as affective conditioned learning (Stolarova et al. 2006) and perceptual learning (Bao et al. 2010), which induced visual cortical plasticity. In particular, C1 amplitude evoked by visual stimuli (gratings), which subjects previously learnt to be associated with threatening stimuli, were found to be more negative (Stolarova et al. 2006), indicating
experience-dependent visual cortical reorganization. Bao et al. (2010) demonstrated that after 24 days of perceptual learning, performance in a contrast discrimination task was improved and the amplitude of the evoked C1 component increased (Bao et al. 2010). Importantly, the increase in C1 amplitude was specific both for the trained grating orientation and location, indicating early cortical plasticity (Bao et al. 2010). Our results confirm the amplitude of the C1 component as being a sensitive probe for visual plasticity and show, for the first time, adaptation of the primary visual cortex after a short period of mono-cular deprivation, which followed an opposite trend for the deprived and non-deprived eye, indicating homeostatic ocular dominance plasticity in the adult human primary visual cortex.
Other studies reported that the amplitude, but not the latency, of the C1 component could be decreased by low frequency (1 Hz) repeated transcranial magnetic stimulation (rTMS) over the primary visual cortex (Schutter & van Honk, 2003); in this case, the visual information processing is inhibited by transiently reducing the cortical excitability of the primary visual cortex, without altering visual perception (Kosslyn et al. 1999). This result (Schutter & van Honk, 2003) confirms and reinforces the evidence indicating the primary visual cortex as the generator of the C1 component, and suggests the amplitude rather than the latency of the C1 as a sensitive indicator of early visual cortical excitability
+1µV -1µV C1 N1 C1 N1 P2 P1 N1 P2 P1 P2 P1 0 100 200 300 400 500 ms 0 100 200 300 400 500 ms Pre Post Deprived Non-Deprived POz 1µV -1µV +1.5 µV -1.5 µV POz A B
Figure 4. Average P1, N1 and P2 waveforms and topography
A, grand average (from−50 to 500 ms) of the VEP
waveforms on the parietal–occipital (POz) site, where the considered components showed the maximum peak. The waveforms from the pre-(dotted lines) and post- (continuous lines)
deprivation experimental sessions are superimposed for the deprived (red lines, top panel) and
non-deprived (blue lines, bottom panel) eye. The components are labelled in the figures. B, topographical maps of the VEP components: P1, top; N1, middle; P2, bottom. Please note that the maps are obtained by collapsing all the data, since no differences can be appreciated in the
(Schutter & van Honk, 2003). In this light, our findings indicate a deprivation-induced change in interocular excitability.
A deprivation-induced change in visual cortical excitability is also suggested by our results in the frequency domain, showing eye-specific changes in the amplitude spectrum in the alpha band following mono-cular deprivation. Occipital alpha rhythm (8–12 Hz) can be modulated by visual stimulation, attention and inter-nal tasks performance; further, it is thought to reflect the synchronization of neuronal populations in both the visual cortex and inter-regionally (Klimesch et al. 2007; Muthukumaraswamy et al. 2013). While variations in the posterior alpha band have been extensively studied, the underlying neural mechanisms remain controversial (for review see Palva & Palva, 2007; Thut & Miniussi, 2009; Klimesch, 2012). We have recently demonstrated, by means of magnetic resonance spectroscopy, that GABA concentration decreased after transient mono-cular deprivation in the primary visual cortex of adult humans (Lunghi et al. 2015); thus, we could speculate that the changes in the alpha band might reflect changes in visual cortical inhibition. This hypothesis would be in line with evidence showing that alpha band activity can be modulated by pharmacologically manipulating GABAergic inhibition in humans (Saletu et al. 1988; Fingelkurts et al. 2004; Ahveninen et al. 2007; Hall et al. 2010; Saxena et al. 2013).
How visual cortical excitability changes during visual deprivation has been assessed by measuring TMS phosphene thresholds (Boroojerdi et al. 2000; Pitskel
et al. 2007; Lou et al. 2011). Cortical excitability rapidly increased after 45 min of binocular deprivation (Boroojerdi et al. 2000), the increase in excitability persisted for 48 h and progressively reversed after 5 days of blindfolding, when a decrease in excitability was found (Pitskel et al. 2007). However, a different pattern has been reported for monocular deprivation. Lou et al. (2011) found a progressive decrease in visual cortical excitability during 48 h of deprivation. The discrepancy between these two sets of results probably relies on the circuit that mediates interocular interactions, which is differently affected by the type of deprivation. Here, we found both an increase and a decrease of the amplitude of the visual evoked response and alpha band activity induced by monocular deprivation, therefore from our results it is very difficult to predict how monocular deprivation would change the probability of phosphenes being elicited by TMS. The Lou et al. (2011) results may also appear contradictory to the decrease of GABAergic inhibition observed after short-term mono-cular deprivation (Lunghi et al. 2015). However, TMS generates a strong activity in the visual cortex that differs from visual stimulation in many properties, being less noisy, more synchronous, and activating differently both recurrent inhibition and the excitatory/inhibitory balance of the local circuitry. The TMS-evoked response might be reduced after monocular deprivation because the network excitation is reduced without necessarily interfering with the GABAergic inhibition. Moreover, the GABA reduction observed after monocular deprivation by magnetic resonance spectroscopy (Lunghi et al. 2015)
µV µV 2.5
A
B
C
2 1.5 amplitude ( µV) 1 0.5 µV2.5 2.0 1.5 1.0 0.5 0.0 dep eye non-dep eyeAlpha peak (post/pr
e) 2 1.5 1 0.5 Pre Non-Deprived Eye Deprived Eye Post Pre Post 0.0 2.5 3 10 20 30 40 3 10 20 frequency (Hz)50 30 40 50
Figure 5. Alpha peak activity amplitude analysis
Amplitude spectra of the grand-averaged (300–700 ms after stimulus onset) ERPs from the pre- (continuous lines) and post- (dotted lines) deprivation are superimposed for the deprived (red lines, A) and non-deprived (blue lines,
B) eye in the 3–50 Hz frequency range. The main peak falls within the alpha frequency range (around 10 Hz).
The topographical map (back view) of the alpha peak is shown at the centre of the figure to provide evidence of its spatial localization. C, bar plot of the differences in the amplitude of the alpha peak between post- and pre-deprivation for the deprived (red bar) and non-deprived (blue bar) eye (∗∗∗P< 0.001,∗P< 0.05).
was measured in the absence of any stimulation and is measuring a different aspect of inhibitory circuitry compared with that evoked by visual or TMS stimulation. Whatever could be the underlying neural mechanisms, all these results (Boroojerdi et al. 2000; Pitskel et al. 2007; Kwon et al. 2009; Lou et al. 2011; Lunghi et al. 2011, 2013, 2015; Zhou et al. 2013a) clearly indicate that adult visual cortical activity can be plastically changed by transient visual deprivation. Interestingly, it has also been demonstrated that in adult humans 120 s of tetanic stimulation (repetitive presentation of a checkerboard at 9 Hz) induces both a potentiation of the N1b component of the visual evoked response (Teyler et al. 2005) and a desynchronization of alpha band activity (Clapp et al. 2006) lasting for up to 1 h after the photic tetanus pre-sentation. These results (Teyler et al. 2005; Clapp et al. 2006) indicate that long-term potentiation mechanisms, probably reflecting synaptic plasticity, are also preserved in the adult visual cortex.
Taken together, the present results indicate that short-term monocular deprivation alters the neural activity in the adult human visual cortex at the earliest stages of visual processing. Interestingly, deprivation not only affects the neural activity of the deprived eye (strengthening), but also that of the non-deprived eye (weakening), therefore altering dramatically the balance between interocular signals, vigorously advantaging the deprived eye. This process reflects homeostatic short-term ocular dominance plasticity of the adult human visual cortex that could be mediated by a change in cortical excitability, and strongly indicates that the capability of the primary visual cortex to be modified by visual experience is not restricted to the critical period (Wiesel & Hubel, 1963; Berardi et al. 2000), but persists through adulthood.
References
Ahveninen J, Lin FH, Kivisaari R, Autti T, Hamalainen M, Stufflebeam S, Belliveau JW & Kahkonen S (2007). MRI-constrained spectral imaging of benzodiazepine modulation of spontaneous neuromagnetic activity in human cortex. Neuroimage 35, 577–582.
Ales JM, Yates JL & Norcia AM (2010). V1 is not uniquely identified by polarity reversals of responses to upper and lower visual field stimuli. Neuroimage 52, 1401–1409. Bao M & Engel SA (2012). Distinct mechanism for long-term
contrast adaptation. Proc Natl Acad Sci USA 109, 5898–5903. Bao M, Yang L, Rios C, He B & Engel SA (2010). Perceptual
learning increases the strength of the earliest signals in visual cortex. J Neurosci 30, 15080–15084.
Berardi N, Pizzorusso T & Maffei L (2000). Critical periods during sensory development. Curr Opin Neurobiol 10, 138–145.
Blakemore C, Garey LJ & Vital-Durand F (1978). The physiological effects of monocular deprivation and their
reversal in the monkey’s visual cortex. J Physiol 283, 223–262.
Bocker KB, Brunia CH & vanden Berg-Lenssen MM (1994). A spatiotemporal dipole model of the stimulus preceding negativity (SPN) prior to feedback stimuli. Brain Topogr 7, 71–88.
Boroojerdi B, Bushara KO, Corwell B, Immisch I, Battaglia F, Muellbacher W & Cohen LG (2000). Enhanced excitability of the human visual cortex induced by short-term light deprivation. Cereb Cortex 10, 529–534.
Clapp WC, Muthukumaraswamy SD, Hamm JP, Teyler TJ & Kirk IJ (2006). Long-term enhanced desynchronization of the alpha rhythm following tetanic stimulation of human visual cortex. Neurosci Lett 398, 220–223.
Di Russo F, Bultrini A, Brunelli S, Delussu AS, Polidori L, Taddei F, Traballesi M & Spinelli D (2010). Benefits of sports participation for executive function in disabled athletes.
J Neurotrauma 27, 2309–2319.
Di Russo F, Martinez A & Hillyard SA (2003). Source analysis of event-related cortical activity during visuo-spatial attention. Cereb Cortex 13, 486–499.
Di Russo F, Martinez A, Sereno MI, Pitzalis S & Hillyard SA (2002). Cortical sources of the early components of the visual evoked potential. Hum Brain Mapp 15, 95–111. Di Russo F & Pitzalis S (2014). EEG-fMRI combination for the
study of visual perception and spatial attention. In Cognitive
Electrophysiology of Attention: Signals of the Mind, ed.
Mangun GR, pp. 58–70. Academic Press.
Di Russo F, Taddei F, Apnile T & Spinelli D (2006). Neural correlates of fast stimulus discrimination and response selection in top-level fencers. Neurosci Lett 408, 113–118.
Fagiolini M & Hensch TK (2000). Inhibitory threshold for critical-period activation in primary visual cortex. Nature 404, 183–186.
Fingelkurts AA, Kivisaari R, Pekkonen E, Ilmoniemi RJ & Kahkonen S (2004). The interplay of lorazepam-induced brain oscillations: microstructural electromagnetic study.
Clin Neurophysiol 115, 674–690.
Gratton G, Coles MG & Donchin E (1983). A new method for off-line removal of ocular artifact. Electroencephalogr Clin
Neurophysiol 55, 468–484.
Hall SD, Barnes GR, Furlong PL, Seri S & Hillebrand A (2010). Neuronal network pharmacodynamics of GABAergic modulation in the human cortex determined using pharmaco-magnetoencephalography. Hum Brain Mapp 31, 581–594.
Harauzov A, Spolidoro M, DiCristo G, DePasquale R, Cancedda L, Pizzorusso T, Viegi A, Berardi N & Maffei L (2010). Reducing intracortical inhibition in the adult visual cortex promotes ocular dominance plasticity. J Neurosci 30, 361–371.
Hensch TK (2005). Critical period plasticity in local cortical circuits. Nat Rev Neurosci 6, 877–888.
Hensch TK, Fagiolini M, Mataga N, Stryker MP, Baekkeskov S & Kash SF (1998). Local GABA circuit control of
experience-dependent plasticity in developing visual cortex.
Science 282, 1504–1508.
Hinds O, Polimeni JR, Rajendran N, Balasubramanian M, Amunts K, Zilles K, Schwartz EL, Fischl B & Triantafyllou C
(2009). Locating the functional and anatomical boundaries of human primary visual cortex. Neuroimage 46, 915–922. Hubel DH, Wiesel TN & Le Vay S (1977). Plasticity of ocular
dominance columns in monkey striate cortex. Philos Trans R
Soc Lond B Biol Sci 278, 377–409.
Issa NP, Trachtenberg JT, Chapman B, Zahs KR & Stryker MP (1999). The critical period for ocular dominance plasticity in the ferret’s visual cortex. J Neurosci 19, 6965–6978.
Jeffreys DA & Axford JG (1972). Source locations of pattern-specific components of human visual evoked potentials. II. Component of extrastriate cortical origin. Exp
Brain Res 16, 22–40.
Klimesch W (1999). EEG alpha and theta oscillations reflect cognitive and memory performance: a review and analysis.
Brain Res Brain Res Rev 29, 169–195.
Klimesch W (2012). Alpha-band oscillations, attention, and controlled access to stored information. Trends Cogn Sci 16, 606–617.
Klimesch W, Sauseng P & Hanslmayr S (2007). EEG alpha oscillations: the inhibition-timing hypothesis. Brain Res Rev 53, 63–88.
Klink PC, Brascamp JW, Blake R & van Wezel RJA (2010). Experience-driven plasticity in binocular vision. Curr Biol 20, 1464–1469.
Kosslyn SM, Pascual-Leone A, Felician O, Camposano S, Keenan JP, Thompson WL, Ganis G, Sukel KE & Alpert NM (1999). The role of area 17 in visual imagery: convergent evidence from PET and rTMS. Science 284, 167–170. Kwon M, Legge GE, Fang F, Cheong AM & He S (2009).
Adaptive changes in visual cortex following prolonged contrast reduction. J Vis 9, 1–16.
Lou AR, Madsen KH, Paulson OB, Julian HO, Prause JU, Siebner HR & Kjaer TW (2011). Monocular visual deprivation suppresses excitability in adult human visual cortex. Cereb Cortex 21, 2876–2882.
Lunghi C, Burr DC & Morrone C (2011). Brief periods of monocular deprivation disrupt ocular balance in human adult visual cortex. Curr Biol 21, R538–539.
Lunghi C, Burr DC & Morrone MC (2013). Long-term effects of monocular deprivation revealed with binocular rivalry gratings modulated in luminance and in color. J Vis 13; DOI: 10.1167/13.6.1.
Lunghi C, Emir UE, Morrone MC & Bridge H (2015).
Short-term monocular deprivation alters GABA in the adult human visual cortex. Curr Biol 25, 1496–1501.
Maya Vetencourt JF, Sale A, Viegi A, Baroncelli L, De Pasquale R, O’Leary OF, Castren E & Maffei L (2008). The
antidepressant fluoxetine restores plasticity in the adult visual cortex. Science 320, 385–388.
Morishita H, Miwa JM, Heintz N & Hensch TK (2010). Lynx1, a cholinergic brake, limits plasticity in adult visual cortex.
Science 330, 1238–1240.
Muthukumaraswamy SD, Myers JF, Wilson SJ, Nutt DJ, Hamandi K, Lingford-Hughes A & Singh KD (2013). Elevating endogenous GABA levels with GAT-1 blockade modulates evoked but not induced responses in human visual cortex. Neuropsychopharmacology 38, 1105–1112. Palva S & Palva JM (2007). New vistas for alpha-frequency
band oscillations. Trends Neurosci 30, 150–158.
Pascual-Leone A, Amedi A, Fregni F & Merabet LB (2005). The plastic human brain cortex. Annu Rev Neurosci 28, 377–401. Pham TA, Graham SJ, Suzuki S, Barco A, Kandel ER, Gordon B
& Lickey ME (2004). A semi-persistent adult ocular dominance plasticity in visual cortex is stabilized by activated CREB. Learn Mem 11, 738–747.
Pitskel NB, Merabet LB, Ramos-Estebanez C, Kauffman T & Pascual-Leone A (2007). Time-dependent changes in cortical excitability after prolonged visual deprivation.
Neuroreport 18, 1703–1707.
Pitzalis S, Bozzacchi C, Bultrini A, Fattori P, Galletti C & Di Russo F (2013). Parallel motion signals to the medial and lateral motion areas V6 and MT+. Neuroimage 67, 89– 100.
Pitzalis S, Strappini F, De Gasperis M, Bultrini A & Di Russo F (2012). Spatio-temporal brain mapping of motion-onset VEPs combined with fMRI and retinotopic maps. PLoS One 7, e35771.
Pizzorusso T, Medini P, Berardi N, Chierzi S, Fawcett JW & Maffei L (2002). Reactivation of ocular dominance plasticity in the adult visual cortex. Science 298, 1248–1251.
Sale A, Maya Vetencourt JF, Medini P, Cenni MC, Baroncelli L, DePasquale R & Maffei L (2007). Environmental enrichment in adulthood promotes amblyopia recovery through a reduction of intracortical inhibition. Nat Neurosci 10, 679–681.
Saletu B, Anderer P, Kinsperger K, Grunberger J & Sieghart W (1988). Comparative bioavailability studies with a new mixed-micelles solution of diazepam utilizing radioreceptor assay, psychometry and EEG brain mapping. Int Clin
Psychopharmacol 3, 287–323.
Sawtell NB, Frenkel MY, Philpot BD, Nakazawa K, Tonegawa S & Bear MF (2003). NMDA receptor-dependent ocular dominance plasticity in adult visual cortex. Neuron 38, 977–985.
Saxena N, Muthukumaraswamy SD, Diukova A, Singh K, Hall J & Wise R (2013). Enhanced stimulus-induced gamma activity in humans during propofol-induced sedation. PLoS
One 8, e57685.
Schutter DJ & van Honk J (2003). Reductions in CI amplitude after repetitive transcranial magnetic stimulation (rTMS) over the striate cortex. Brain Res Cogn Brain Res 16, 488–491.
Simpson GV, Foxe JJ, Vaughan HG Jr, Mehta AD & Schroeder CE (1995). Integration of electrophysiological source analyses, MRI and animal models in the study of visual processing and attention. Electroencephalogr Clin
Neurophysiol Suppl 44, 76–92.
Stolarova M, Keil A & Moratti S (2006). Modulation of the C1 visual event-related component by conditioned stimuli: evidence for sensory plasticity in early affective perception.
Cereb Cortex 16, 876–887.
Tagawa Y, Kanold PO, Majdan M & Shatz CJ (2005). Multiple periods of functional ocular dominance plasticity in mouse visual cortex. Nat Neurosci 8, 380–388.
Teyler TJ, Hamm JP, Clapp WC, Johnson BW, Corballis MC & Kirk IJ (2005). Long-term potentiation of human visual evoked responses. Eur J Neurosci 21, 2045–
Thut G & Miniussi C (2009). New insights into rhythmic brain activity from TMS-EEG studies. Trends Cogn Sci 13, 182–189.
Wiesel TN (1982). Postnatal development of the visual cortex and the influence of environment. Nature 299, 583–591. Wiesel TN & Hubel DH (1963a). Effects of visual deprivation
on morphology and physiology of cells in the cat’s lateral geniculate body. J Neurophysiol 26, 978–993.
Wiesel TN & Hubel DH (1963b). Single-cell responses in striate cortex of kittens deprived of vision in one eye. J Neurophysiol 26, 1003–1017.
Zhou J, Clavagnier S & Hess RF (2013a). Short-term monocular deprivation strengthens the patched eye’s contribution to binocular combination. J Vis 13.
Zhou J, Thompson B & Hess RF (2013b). A new form of rapid binocular plasticity in adult with amblyopia. Sci Rep 3, 2638. Additional information
Competing interests
The authors have no competing interests to declare.
Author contributions
C.L., M.C.M. and F.DiR. designed the research, M.B. and C.L. collected and analysed the data, and all authors discussed the results and wrote the manuscript. All authors approved the final version of the manuscript. The experiments took place in the Department of Movement, Human and Health Sciences, University of Rome ‘Foro Italico’.
Funding
This research has received funding from the European Research Council under the European Union’s Seventh Framework Prograamme (FPT/2007-2013), under grant agreement no.338866, ECSPLAIN.
Acknowledgements
We thank Donatella Spinelli and David Charles Burr for helpful comments throughout the project.