UNIVERSITÀ DEGLI STUDI DI CAMERINO
School of Advanced Studies
Doctorate course in
“Computer Science”
Science and Technology
Seismic reliability of buildings isolated with rubber
bearings
PhD Student Supervisor
Dott. Fabio Micozzi Prof. Andrea Dall’Asta
Curriculum coordinator Prof Emanuela Merelli
Seismic reliability of buildings isolated with rubber bearings
Copyright © 2019
by
Fabio Micozzi
Doctor of Philosophy in Computer Science – Science and Technology University of Camerino, Italy
Contents
CONTENTS ... III LIST OF FIGURES ... V LIST OF TABLES ...XI LIST OF ACRONYMS ... XII
CHAPTER 1 ... 1
1 INTRODUCTION ... 1
1.1PREMISE ... 1
1.2MOTIVATIONS AND OBJECTIVES ... 3
1.3OUTLINE OF THE THESIS ... 6
1.4CHAPTER’S REFERENCES ... 8
CHAPTER 2 ... 11
2 STATE OF THE ART ... 11
2.1SEISMIC ISOLATION ... 11
2.2SEISMIC RISK ASSESSMENT ... 19
2.2.1 Seismic risk and design codes ... 22
2.2.2 RINTC Framework ... 23
2.3COLLAPSE MECHANISM OF SEISMICALLY ISOLATED BUILDINGS ... 26
2.3.1 Seismic isolation ... 26
2.3.2 Superstructure ... 30
2.4CHAPTER’S REFERENCES ... 32
CHAPTER 3 ... 39
3 MODELLING ISSUES IN PERFORMANCE-BASED ASSESSMENT OF ISOLATED STRUCTURE ... 39
3.1INTRODUCTION ... 39
3.2ISOLATION ... 40
3.2.1 Experimental investigation ... 40
3.2.2 HDR Bearing Element (Kumar model) ... 48
3.2.3 Kikuchi Bearing Element (Kikuchi model) ... 51
3.3SUPERSTRUCTURE ... 71
3.4HAZARD ... 73
3.5CHAPTER’S REFERENCES ... 78
4.1INTRODUCTION ... 84
4.2DESIGN OF THE NEW ISOLATED BUILDINGS CASE STUDIES ... 85
4.2.1 Seismic isolation system design ... 88
4.2.2 Superstructure ... 92
4.3DESIGN OF RETROFIT SYSTEMS WITH RUBBER BEARINGS... 94
4.4SEISMIC RESPONSE ANALYSIS AND FAILURE CRITERIA ... 98
4.4.1 Global Collapse (GC) performance level ... 98
4.4.2 Usability-Preventing Damage (UPD) performance level ... 101
4.5RESULTS FOR KUMAR MODELLING OF RUBBER BEARINGS ... 103
4.5.1 HDRB Isolation System ... 104
4.5.2 H+F Isolation System ... 114
4.5.3 Effects of model uncertainties ... 117
4.6RESULTS FOR KIKUCHI MODELLING OF RUBBER BEARINGS ... 128
4.7RESULTS RESUME IN TERMS OF ANNUAL RATE OF FAILURE ... 135
4.8CHAPTER’S REFERENCES ... 139
CHAPTER 5 ... 143
5 EFFECTS OF HAZARD ASSESSMENT ON RELIABILITY RESULTS ... 143
5.1INTRODUCTION ... 143
5.2IM ... 148
5.3SEISMIC HAZARD COMPARISON ... 153
5.4RECORD SELECTION ... 155
5.5RESULTS FOR LANZANO ET AL.GMPE ... 166
5.6HAZARD CURVES COMPARISON OF RECORD SETS ... 169
5.7CHAPTER’S REFERENCES ... 173
CHAPTER 6 ... 177
6 CONCLUSIVE REMARKS ... 177
6.1MAJOR DEVELOPMENT AND RESULTS ... 177
6.2FUTURE DEVELOPMENT ... 177
List of Figures
Figure 1. Resilience and the “4R’s” (from Pitilakis 2015 and Franchin 2018) ... 14
Figure 2. Seismic performance for earthquake resistance and base isolated structure beyond design earthquake (from Nishida et al. 2018) ... 15
Figure 3. Performance of seismically isolated building ... 17
Figure 4: Adaptation of the PEER framework for the seismic risk assessment ... 20
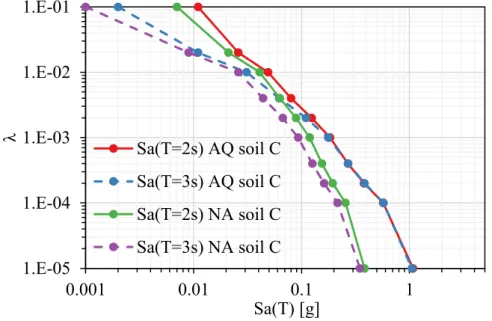
Figure 5. GC limits in X and Y dir. in terms of roof displacements of the superstructure, as derived from POA ... 31
Figure 6. SI-S 700-207 test sequence ... 42
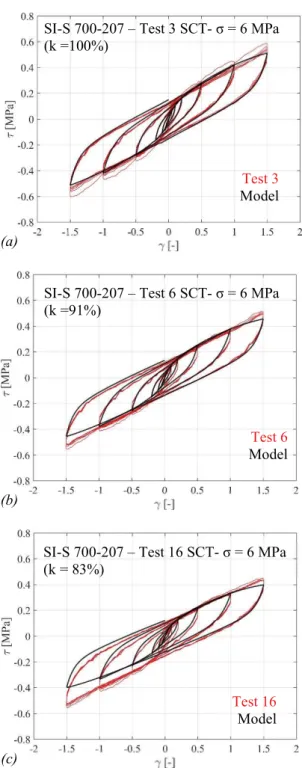
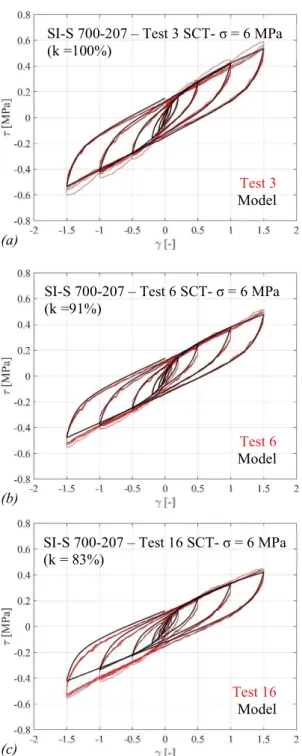
Figure 7. SCTs for SI-S 700-207 ... 42
Figure 8. (a) Equivalent shear stiffness G and (b) damping ξ for SI-S 700-207 ... 43
Figure 9. SQCTs for SI-S 700-207 ... 44
Figure 10. SI-S 600-217 tests sequence ... 44
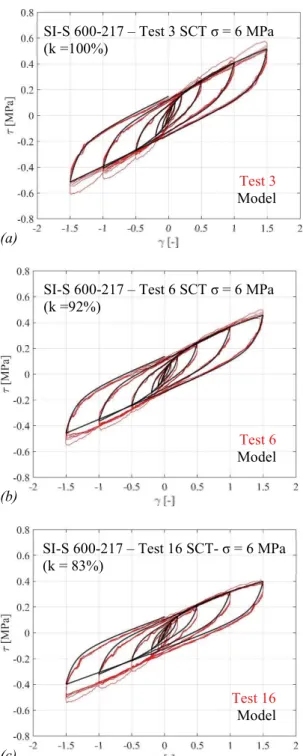
Figure 11. SCTs for SI-S 600-217 ... 45
Figure 12. Equivalent shear stiffness G and damping ξ for SI-S 600-217 ... 45
Figure 13. SQCTs for SI-S 600-217 ... 45
Figure 14. SI-S 500-176 tests sequence ... 46
Figure 15. SCTs for SI-S 500-176 ... 46
Figure 16. Equivalent shear stiffness G and damping ξ for SI-S 600-217 ... 46
Figure 17. SQCTs for SI-S 500-176. ... 47
Figure 18. Cyclic shear test on virgin HDRB... 50
Figure 19. Cyclic shear test on scragged HDRB ... 50
Figure 20. Shear tests up to large strains ... 50
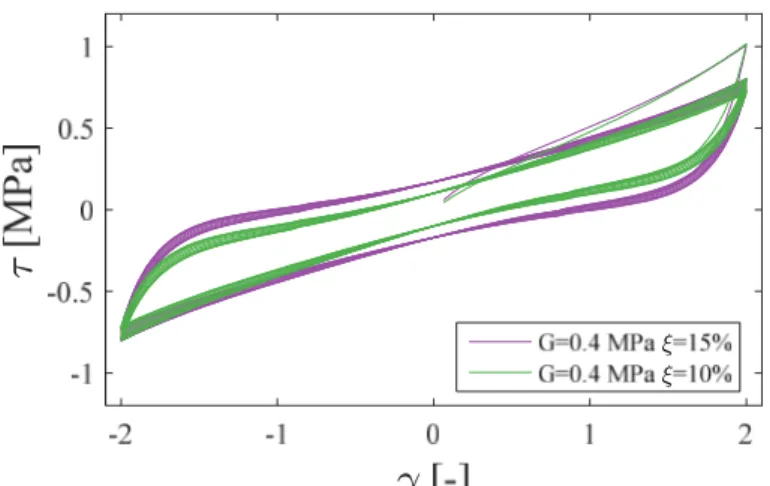
Figure 21. comparison between lower damping and higher damping rubber compounds (numerical hysteresis loops) ... 51
Figure 22. Two Spring model developed by Koh and Kelly (image from Kelly, 1997) ... 52
Figure 23. Two-dimensional Kikuchi model (from Yamamoto et al. 2009) ... 53
Figure 24. Hysteresis models: (a) shear hysteresis models and (b) axial stress–strain behaviour (from Yamamoto et al. 2009) ... 54
Figure 25. Multi-spring mechanical model for circular elastomeric bearing (from Ishii and Kikuchi 2019) ... 55
Figure 26. Stiffness distribution of MNS over the area of a circular pad. ... 56
Figure 27. Analysis results for cyclic shear tests with varying vertical load: (a) 0° horizontal loading and (b) 45° horizontal loading. ... 57
Figure 28. Nonlinear hysteretic model for axial behaviour (from Ishii and Kikuchi 2019) 58 Figure 29. Comparison of axial test experimental results and calibrated model for SI-S 700-207 ... 59
Figure 30. Comparison of SCT experimental results and calibrated model (nonlinear axial springs) for SI-S 700-207 ... 60
Figure 31. Comparison of SQT experimental results and calibrated model (nonlinear axial springs) for SI-S 700-207 ... 61 Figure 32. Comparison of SCT experimental results and calibrated model (linear axial springs) for SI-S 700-207 ... 63 Figure 33. Comparison of SQT experimental results and calibrated model (linear axial springs) for SI-S 700-207 ... 64 Figure 34. Comparison of axial test experimental results and calibrated model (linear axial springs) for SI-S 500-176 ... 65 Figure 35. Comparison of SCT experimental results and calibrated model (linear axial springs) for SI-S 500-176 ... 66 Figure 36. Comparison of SQT experimental results and calibrated model (linear axial springs) for SI-S 500-176 ... 67 Figure 37. Comparison of axial test experimental results and calibrated model ... 68 Figure 38. Comparison of SCT experimental results and calibrated model (linear axial springs) for SI-S 600-217 ... 69 Figure 39. Comparison of SQT experimental results and calibrated model (linear axial springs) for SI-S 600-217 ... 70 Figure 40. ZS9 source zone model from Stucchi et. al., 2011 (redrawn from Meletti et al., 2008). The numbers in the boxes identify the earthquake source zones; the colours refer to the mean seismogenetic depth (in km); the superimposed shadings refer to the predominant focal mechanism. The source zones with letters were not used in the assessment. ... 74 Figure 41. Hazard curves at L’Aquila for Soil Type C; the curve at T=3.0s was computed according to the model of Akkar and Bommer (2010). ... 75 Figure 42. IMLs and corresponding rate of occurrence for spectral ordinates and soil types computed for seismically isolated buildings ... 76 Figure 43. Floor plan ... 86 Figure 44. Vertical section ... 87 Figure 45. Horizontal elastic response spectra for different return periods for: (a) Naples and (b) L’Aquila. ... 88 Figure 46. Isolation system layout: (a) Case A for HDRB and (b) Case 1-A for H+F. The three-code number represents Φ (diameter of the isolator, mm), te (total rubber layer thickness, mm), tr (thickness of the single rubber layer, mm) ... 90 Figure 47. Floor plan of the eG building located in Napoli ... 94 Figure 48. Elastic limit for (a) eS building at L’Aquila and (b) eG building at Napoli in the fixed base configuration ... 95 Figure 49. Design procedure for the eS building at L’Aquila ... 96 Figure 50. Design procedure for the eG building at Napoli ... 97 Figure 51. Isolation system configuration of es-A HDRBs. The three-code number represents Φ (diameter of the isolator, mm), te (total rubber layer thickness, mm), tr (thickness of the single rubber layer, mm) ... 97
Figure 52. GC limits in X and Y dir. in terms of roof displacements of the superstructure, as
derived from POA ... 99
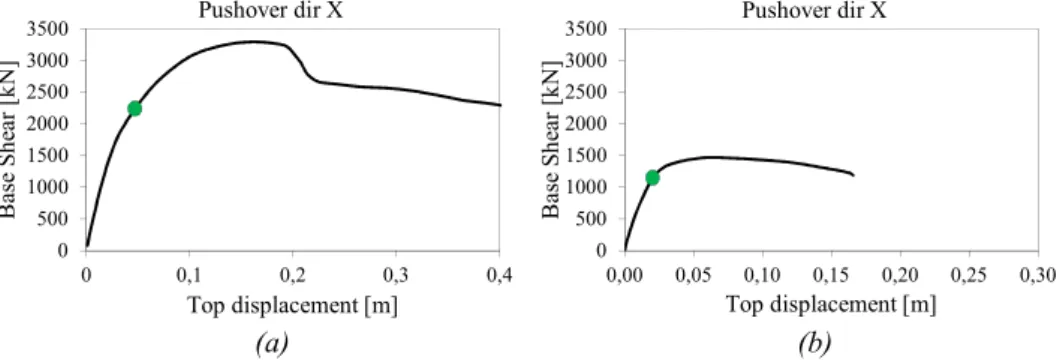
Figure 53. Pushover curves (case eS) and displacement GC thresholds in the X (a) and Y (b) directions. ... 100
Figure 54. Pushover curves (case eG) and displacement GC thresholds in the X (a) and Y (b) directions. ... 101
Figure 55. General definition for the usability-preventing damage failure criteria ... 102
Figure 56. UPD limits in X and Y dir. In terms of roof displacements of the superstructure, as derived from POA ... 102
Figure 57. Summary of GC results of Ku-n-A HDRB for (a) normal GC criteria (b) GC criteria without buckling collapse condition ... 105
Figure 58. Time history of axial and buckling loads ... 105
Figure 59. Maximum bearing shear deformation and corresponding shear force ... 106
Figure 60. D/C ratio for shear deformation (XD/C shear>1). ... 107
Figure 61 Maximum D/C ratio for the superstructure displacement in X and Y direction. (XD/C shear>1) ... 108
Figure 62. (a) Summary of global collapse results for case Ku-n-A HDRB with seismic stopper and (b) summary of gap closure and elastic limit attainment. ... 109
Figure 63. displacement trajectories of the slab corners ... 110
Figure 64. (a) impact force in the Y direction and (b) HDRB cyclic response with and without gap in y direction ... 110
Figure 65. (a) Summary of global collapse results for Ku-n-N HDRB case and (b) normalized hazard curves of L’Aquila and Naples. ... 111
Figure 66. Displacement D/C ratio of the superstructure (UPD) in the X direction for: (a) case Ku-n-A HDRB and (b) case Ku-n-N HDRB. ... 112
Figure 67. Summary of global collapse results for case Ku-eS-A HDRB. ... 112
Figure 68. Displacement D/C ratio of the superstructure (UPD) for the case Ku-eS-A HDRB: (a) X direction and (b) Y direction ... 114
Figure 69. Summary of global collapse results for: (a) case Ku-n-A H+F 1, (b) case Ku-n-A H+F 2, (c) case Ku-n-A H+F 1 with seismic stoppers and (d) case Ku-n-N H+F 1.115 Figure 70. Displacement D/C ratio of the superstructure (UPD) in the X direction for (a) case Ku-n-A H+F 2 and (b) case Ku-n-N H+F 1 ... 116
Figure 71. Summary of global collapse results for existing structures isolated with H+F: (a) case Ku-eS-A H+F (b) case Ku-eG-N H+F ... 116
Figure 72. POA curves of varied models for: (a)(b) n-A HDRB, (c)(d) n-A H+F 2 ... 119
Figure 73. Representation of ANOVA model II ... 121
Figure 74. Correlation between G and ξ... 123
Figure 75. Batches distributions and general distribution of (a) G, (b) ξ. ... 124
Figure 77. Summary of results with modelled uncertainties: (a)(b) GC and UPD for case
Ku-n-A HDRB, (c)(d) GC and UPD for case Ku-n-A H+F 2 ... 126
Figure 78. Mean (solid line) and mean±standard deviation (dashed lines) of (a) displacement D/C ratio of bearings and (b) displacement D/C ratio of the superstructure (X direction) for the case Ku-n-A HDRB with and without uncertainties ... 127
Figure 79. Global collapse results for Ki-n-A HDRB: (a) shear limit 3.5, (b) shear limit 4.0129 Figure 80. Displacement D/C ratio of the superstructure (UPD) for Ki-n-A HDRB: (a) X direction and (b) Y direction. ... 130
Figure 81. (a) Bearing position and hysteretic cycles comparison for Kikuchi and Kumar model in (b) vertical and (c)(d) horizontal directions for a record at IML5 ... 131
Figure 82. (a) Bearing position and hysteretic cycles comparison for Kikuchi and Kumar model in (b) vertical and (c)(d) horizontal directions for a record at IML5 ... 131
Figure 83. (a) Bearing position and hysteretic cycles comparison for Kikuchi and Kumar model in (b) vertical and (c)(d) horizontal directions for a record at IML9 ... 132
Figure 84. Global collapse results for Ki-n-N HDRB: (a) shear limit 3.5, (b) shear limit 4.0133 Figure 85. Displacement D/C ratio of the superstructure (UPD) for Ki-n-N HDRB: (a) X direction and (b) Y direction. ... 133
Figure 86. Summary of global collapse results for case Ki-eS-A HDRB. ... 133
Figure 87. Displacement D/C ratio of the superstructure (UPD) for Ki-n-A HDRB: (a) X direction and (b) Y direction. ... 134
Figure 88. Annual rate of collapse (GC) for the different case studies ... 136
Figure 89. Annual rate of damage (UPD) for the different case studies ... 138
Figure 90. Spectral displacement response trace [m], envelope and projection for T=3s, ξ=5% damping ratio of record from the Next Generation Attenuation (NGA) database, record sequence number 1194 (CHICHI 1999 earthquake). ... 149
Figure 91. Pseudo Spectral acceleration response trace [m] T=3s, ξ=5% damping ratio for a record from Next Generation Attenuation (NGA) database, record sequence number 1194 (CHICHI 1999 earthquake). Polarized signal with SaRotD100/SaRotD50=1.414 ... 151
Figure 92. Hazard curves of L’Aquila site for Ambraseys et al. (1996) [SaLarger] and Akkar and Bommer (2010) [SaGM]... 153
Figure 93. Hazard curves of L’Aquila site for Lanzano et al. (2019) [SaRotD50] and Akkar and Bommer (2010) [SaGM]. ... 154
Figure 94. UHS comparison for L’Aquila site ... 155
Figure 95. Hazard curves for L’Aquila site using GMPE of Lanzano et al. (2018) ... 156
Figure 96. Hazard curves for Naples site using GMPE of Lanzano et al. (2018) ... 156
Figure 97. Hazard Disaggregation, spectra of scaled motions and conditional spectra for L’Aquila site IML1 ... 158
Figure 98. Hazard Disaggregation, spectra of scaled motions and conditional spectra for L’Aquila site IML2 ... 158
Figure 99. Hazard Disaggregation, spectra of scaled motions and conditional spectra for L’Aquila site IML3 ... 158 Figure 100. Hazard Disaggregation, spectra of scaled motions and conditional spectra for L’Aquila site IML4 ... 159 Figure 101. Hazard Disaggregation, spectra of scaled motions and conditional spectra for L’Aquila site IML5 ... 159 Figure 102. Hazard Disaggregation, spectra of scaled motions and conditional spectra for L’Aquila site IML6 ... 159 Figure 103. Hazard Disaggregation, spectra of scaled motions and conditional spectra for L’Aquila site IML7 ... 160 Figure 104. Hazard Disaggregation, spectra of scaled motions and conditional spectra for L’Aquila site IML8 ... 160 Figure 105. Hazard Disaggregation, spectra of scaled motions and conditional spectra for L’Aquila site IML9 ... 160 Figure 106. Hazard Disaggregation, spectra of scaled motions and conditional spectra for L’Aquila site IML10 ... 161 Figure 107. Comparison of calculated mean annual frequency rates based on selected ground motions (solid lines) and hazard assessment for L’Aquila site ... 162 Figure 108. Hazard Disaggregation, spectra of scaled motions and conditional spectra for Naples site IML1 ... 163 Figure 109. Hazard Disaggregation, spectra of scaled motions and conditional spectra for Naples site IML2 ... 163 Figure 110. Hazard Disaggregation, spectra of scaled motions and conditional spectra for Naples site IML3 ... 163 Figure 111. Hazard Disaggregation, spectra of scaled motions and conditional spectra for Naples site IML4 ... 164 Figure 112. Hazard Disaggregation, spectra of scaled motions and conditional spectra for Naples site IML5 ... 164 Figure 113. Hazard Disaggregation, spectra of scaled motions and conditional spectra for Naples site IML6 ... 164 Figure 114. Hazard Disaggregation, spectra of scaled motions and conditional spectra for Naples site IML7 ... 165 Figure 115. Hazard Disaggregation, spectra of scaled motions and conditional spectra for Naples site IML8 ... 165 Figure 116. Hazard Disaggregation, spectra of scaled motions and conditional spectra for Naples site IML9 ... 165 Figure 117. Hazard Disaggregation, spectra of scaled motions and conditional spectra for Naples site IML10 ... 166 Figure 118. Comparison of calculated mean annual frequency rates based on selected ground motions (solid lines) and hazard assessment for Naples site ... 166
Figure 119. Global collapse results for Ki-n-A HDRB analysed using the new record selection (GMPE Lanzano et al. 2019) ... 167 Figure 120. Displacement D/C ratio of the superstructure (UPD) for Ki-n-A HDRB analysed using the new record selection (GMPE Lanzano et al. 2019): (a) X direction and (b) Y direction ... 167 Figure 121. Global collapse results for Ki-n-N HDRB analysed using the new record selection (GMPE Lanzano et al. 2019) ... 168 Figure 122. Displacement D/C ratio of the superstructure (UPD) for Ki-n-N HDRB analysed using the new record selection (GMPE Lanzano et al. 2019): (a) X direction and (b) Y direction ... 168 Figure 123. Annual rate of collapse (GC) for the different case studies ... 168 Figure 124. Annual rate of damage (UPD) for the different case studies ... 169 Figure 125. Rate of exceedance (hazard curves) computed for the site of L’Aquila from the sets of records for:(a) Sa(T=0.15)>y, (b) Sa(T=0.5)>y, (c) Sa(T=1.0)>y, (d) Sa(T=2.0)>y, (e) Sa(T=3.0)>y, (f) Sa(T=5.0)>y. (Sa = SaRotD50) ... 171 Figure 126. Rate of exceedance (hazard curves) computed for the site of L’Aquila from the sets of records for:(a) Sa(T=0.15)>y, (b) Sa(T=0.5)>y, (c) Sa(T=1.0)>y, (d) Sa(T=2.0)>y, (e) Sa(T=3.0)>y, (f) Sa(T=5.0)>y. (Sa = SaRotD100) ... 172
List of Tables
Table 1. GC for the isolation systems ... 30
Table 2. Geometrical characteristics of the tested bearings ... 41
Table 3. Grant’s model parameters used for different rubber compounds ... 51
Table 4. Case study identification codes ... 85
Table 5. Geometrical characteristics and safety verification results for HDRB isolation system. ... 90
Table 6. Geometric characteristics and safety verification results for HDRB-FSB isolation system ... 91
Table 7. RC beam/column sections geometry ... 93
Table 8. Geometric and steel reinforcement ratios characteristics ... 93
Table 9. Geometric characteristics and design outcomes for HDRB isolation system ... 98
Table 10. Geometric characteristics and design outcomes for H+F isolation system ... 98
Table 11. GC superstructure limit displacements [mm] ... 100
Table 12. GC superstructure limit displacements for existing buildings [mm] ... 101
Table 13. UPD superstructure limit displacements [mm] ... 103
Table 14. UPD superstructure limit displacements for existing buildings [mm] ... 103
Table 15. Parameters of gap models in X and Y directions ... 108
Table 16. Mean values and standard deviations of superstructure GC disp. Of varied models (mm). ... 119
Table 17. Mean values and standard deviations of superstructure UPD disp. Of varied models (mm). ... 119
Table 18. ANOVA model II ... 122
Table 19. ANOVA model II values for G and ξ ... 124
List of Acronyms
CLS Collapse Limit State (NTC)
CS Conditional Spectrum
CSSB Concave Surface Slider Bearing
D/C Demand Capacity ratio
DLS Damage Limit State (NTC)
EDP Engineering Demand Parameter
eG existing gravity load designed building eS existing seismic load designed building
FSB Flat Slider Bearing
GC global collapse
GMPE Ground Motion Prediction Equation
HDRB High Damping Rubber Bearing
HPP Homogeneous Poisson Process
IM intensity measure
IML intensity measure level
LSLS Life Safety Limit State (NTC)
NTC Norme Tecniche per le Costruzioni (CS.LL.PP., 2008, 2018) NTHA Nonlinear Time History Analysis
PBEE performance-based earthquake engineering
POA PushOver Analysis
PSHA Probabilistic Seismic Hazard Assessment
Tr Return Period
UHS Uniform Hazard Spectrum
CHAPTER 1
1 Introduction
1.1 Premise
“The art of Civil Engineering is to foresee the unforeseeable”. These are the first few words of Calgaro and Gulvanessian (2001) and in these few words are condensed all the challenges that engineers face in their activities. Engineering design is an “art” because it is a non-straightforward process producing unique objects within a context involving tangible and intangible inputs and not only the rational solution of a technical problem. Structural design combines subjective decision-making (e.g., heuristics), concerning judgment, aesthetic and conceptualization of complex problems, and objective knowledge (e.g., engineering science) providing predictive models and evolving according to scientific method.
There is so a fundamental difference between “structural design” (the practice of structural engineers, related to knowing-how) and the underlying “engineering science” (the work of engineering scientist, related to knowing-that or in general engineering knowledge) (Bulleit et al., 2015, Popper, Karl 1959). Engineering science is core or kernel of engineering design knowledge (Dias 2019). It studies and develops theoretical models to describe the behaviour of complex systems involving man-made objects and their interaction with surrounding environment.
The term Civil Engineering was born in the past to distinguish from the Military Engineering (in France, the military engineer was given formal status by the creation of a Corps des Ingénieurs du Génie Militaire by Maréchal Vauban) and its meaning has evolved over time (Muir Wood, 2012, Blockley, 2014). Nowadays the term relates to that branch of engineering which is concerned with the creation of structures and infrastructures for the society, as highlighted by the definition (WIKIPEDIA)
“Civil engineering is a professional engineering discipline that deals with the design, construction and maintenance of the physical and naturally built environment, including public works such as roads, bridges, canals, dams, airports, sewerage systems, pipelines, structural components of buildings, and railways”
where “Civil” implying the link with the citizen and with civilization (Muir Wood, 2012). Civil Engineering differs from other branches of engineering because it usually deals with non-prototypical engineered systems, for which prototype testing is not possible and thus uncertainties are significantly increased (Blockley, 1980).
In the field of structural design, the aim of engineers is to create structures with adequate safety and serviceability under the influence of the relevant loads and actions during their lifetime. Moreover, structural design must deal with other aspects such as efficiency, environmental impact, aesthetic and economic boundary, searching an optimum balance between all of them (Blockley, 1980). Engineering also involves reconceptualizing a complex situation to facilitate analysis; it includes problem definition, not just problem solution (Bulleit et al., 2015).
Research in Civil Engineering field studies many aspects listed before, especially the most quantifiable such as models and methods used in the structural response analysis or for the safety assessment. Research in this fields is usually pure “engineering science” and, according to Popper “hard science”.
Safety is one of the most important requirements for a structure and a main topic of past and current research; it is something related to the probability that undesirable event occur. For example, research into structural reliability, based upon probability theory, has been useful in determining values of partial factors for structural design but it has been mainly focused in considering random overload and understrength failure in the past. The partial factor method has been a big step forward for structural design, but it represents only a small part of the total global problem of structural safety (human error is the predominating cause of failure occurred in the past) (Blockley, 1980).
To limit the probability of undesirable events and ensure it is below a pre-defined threshold that can be accepted by the public opinion is a task recognized by all the codes acting nowadays worldwide. The hazards to be considered in evaluating the structural safety are many, such as over-vertical load, understrength, earthquakes, fire, floods and also explosions and vehicle impacts. Indeed, even if many theoretical tools are available to define the probabilistic response of structures and assess the consequences and costs related to the repairing damages, downtime and rebuilding (e.g., Performance Based Earthquake Engineering framework for earthquake hazard)(Cornell and Krawinkler, 2000, Porter, 2003), the concept of “acceptable” risk of losses and human death, resulting from structural failure, raises very sensitive questions that concern public perception. The acceptable risk is a reflection of personal and societal value judgements, as well as disaster-based experience: for example, additional requirements in regulation and codes generally follows tragedies (Calgaro and Gulvanessian, 2001, Fajfar, 2018).
According to (Calgaro, 2011) and (Fajfar 2018), the public aversion to failure and the societal desire of protection are increasing. Moreover, the vulnerability and the loss registered in our modern cities in the last decades are increasing compared to the past (Daniell et al. 2011, Munich RE 2018). In fact, despite the awareness of seismic risk is increasing, the urban environment is getting more and more complicated, interconnected and expensive (Gkoumas et al., 2015, Franchin, 2018). Research in the last decades focused on how the risk and the losses related to undesirable events can be assessed and reduced.
1.2 Motivations and objectives
Focusing on the field of earthquake engineering, the conventional seismic resistant design is intended to resist major earthquake avoiding collapse and loss of life but allowing structural and non-structural damage.
Although life safety is still an essential performance for any structure, strategic buildings such as hospitals, public office buildings and major infrastructures must achieve higher performance because of their role in the
post-earthquake activities. Many private building owners, in the wake of the public aversion to failures and cost related to damages after an earthquake mentioned before, are also increasingly interested in higher performance levels of the structure (Christopoulos and Filiatrault 2006).
In the last decades, a lot of research has been conducted in developing innovative earthquake-resistant systems capable to increase the seismic performance in a more cost-effective way (Soong and Constantinou 1994, Christopoulos and Filiatrault 2006), moving from a simple life-safety design to a higher performance level. Most of the innovative anti-seismic technologies are based on the passive control of the dynamic behaviour of the structure (i.e. devices that work during an earthquake without any external energy supply, opposed to the active control where the motion of a structure is controlled or modified by means of the action of a control system through some external energy supply). Passive technologies can be divided into two groups: (i) systems based on energy dissipation introducing supplemental damping devices and (ii) systems to limit the transmission of seismic energy to the main structure by seismic isolation devices.
Structures equipped with these systems undergo low deformations and accelerations, recovering from the effects induced by the ground shaking without showing widespread damages on the structural components and regaining the initial status in a timely and efficient manner (Scozzese 2019). The advantages of these systems compared to standard structures are: - Reduction of downtime or even continued functionality immediately after
the earthquake (only post-event inspection is required)
- Reduction of direct and indirect post-earthquake costs (costs are only related to maintenance and, if necessary, to the replacement of the devices)
- Safety of the occupants is ensured since the damage of structural and non-structural components is avoided (safety may be endangered by non-structural elements such as partition walls, ceilings and furniture) - Occupant perception of the earthquake is low because accelerations are
reduced.
order to provide proper safety margins against anticipated failures and therefore to guarantee a proper level of reliability. Their premature failure may lead to an abrupt collapse of the entire structure as a very fragile system. The past research has been focused on how seismic isolation and energy dissipation devices work in reducing the damage to structural and non-structural components (Soong and Constantinou, 1994), while only recently the research started to study the reliability of these systems (Ragni et. al. 2018, Scozzese et. al. 2019, Kitayama and Constantinou 2019, Shao et al. 2019, Rezaei Rad and Banazadeh, 2018).
The work carried out in this Thesis aims to provide a contribution in the field of reliability of isolated structure equipped with High Damping Rubber Bearings (HDRBs), one of the most common passive technology currently used to protect strategic buildings such as hospitals. More in detail, this PhD dissertation is focused on the risk assessment of seismically isolated buildings and covers various topics ranging from the isolators modelling to the evaluation of the probability of failure, including deeper insights and original contributions on isolators modelling, evaluation of failure probability, reliability of conventional design procedures, and description of seismic hazard for isolated structures.
A set of case studies has been defined representing new isolated buildings and existing buildings designed according the current Italian code, (referred to as Norme Tecniche per le Costruzioni, or NTC, CS.LL.PP., 2008, 2018). Two sites located in Italy (i.e., L’Aquila and in Naples, both soil type C) has been considered. All the buildings have been then modelled employing state-of-art methodologies accounting for the nonlinear behaviour of both isolation system and superstructure. The structural reliability, expressed in terms of annual failure rates, has been assessed for each case according to the paradigm of Performance-Based Earthquake Engineering (Cornell and Krawinkler, 2000, Porter, 2003). A performance level has been defined for both collapse (for both superstructure and isolation system) and damage of non-structural components of the superstructure and, based on global parameters, the relative failure criteria have been defined to calculate failure rates. The resulting probabilities of failure have been compared to the target
which are the main parameters influencing the actual reliability of code-conforming buildings.
Part of the work on the reliability of seismically isolated buildings presented hereafter was carried out within the research program RINTC – Rischio Implicito delle strutture progettate secondo le NTC project (Iervolino and Dolce, 2018), which addressed the seismic structural reliability implicit by design according to the Italian code for different structural typologies. Although this thesis is focused on HDRBs rubber bearings, some results regarding a hybrid isolation system composed by HDRBs and Flat Sliding Bearings (HDRBs+FSBs) and concave surface sliding bearings (CSSBs) are also reported for comparison purpose (Iervolino and Dolce 2018, Iervolino et. al. 2018, Iervolino et al. 2019, Ragni et. al, 2018, ReLUIS-RINTC 2018, Cardone et al. 2017, Cardone et al. 2019).
1.3 Outline of the thesis
After a brief introduction regarding principles and dynamic behaviour of seismic isolation, all the methods and the characteristics of the framework used within this Thesis are exposed in Chpt. 2 . Chpt. 3 contains all the models for isolation bearings, superstructure and hazard assessment, with particular attention on the specific feature necessary to assess reliability of isolated buildings. Chpt. 4 reports the design procedure and the description of the outcoming case studies. Then, for each of them, a risk assessment in terms of performance levels for collapse and damage of isolated systems has been carried out. More in detail, these results are grouped based on the specific isolator’s model used in the time history analyses. Both new seismically isolated structures and existing structure retrofitted with rubber bearings located in two sites (L’Aquila and Naples) have been assessed. At the end of chapter are resumed all annual rates of collapse and the annual rates of damage, highlighting similarities and differences of case studies results. The comparison is extended also to some results of equivalent fixed-base structure, showing a significant difference between isolated structure and fixed-base one up to an order of magnitude. The source of this difference is therefore identified in the hazard assessment procedure made
for isolated buildings and the other structures like RC fixed-base structures. For this reason, further hazard assessment is carried out in Chpt. 5 using the most recent Italian tools and methods available; a comparison between the reliability results based on the new hazard and the previous ones shows a reduction of the differences between isolated structures and fixed-base structures. Moreover, an innovative procedure to calculate the hazard curves directly from the record selection sets has been used. In this way a clear quantitative comparison of the hazard intensity has been carried out, showing that different choices during the hazard assessment may significantly affect the hazard level and consequently the reliability results.
1.4 Chapter’s references
Blockley, D. I., 1980. The nature of structural design and safety. Chichester, UK: Ellis Horwood Limited.
Blockley, D., 2014. Structural engineering: a very short introduction, 1st ed. ed, Very short introductions. Oxford University Press, Oxford.
Bulleit, W., Schmidt, J., Alvi, I., Nelson, E., Rodriguez-Nikl, T., 2015. Philosophy of Engineering: What It Is and Why It Matters. J. Prof. Issues Eng. Educ. Pract. 141, 02514003. https://doi.org/10.1061/(ASCE)EI.1943-5541.0000205
C.E.N. 2002. European standard EN 1990:2002. Eurocode: basis of structural design. European Committee for Standardization, Brussels, Belgium.
C.E.N. 2004. Eurocode 8: Design of Structures for Earthquake Resistance: Part 1: General Rules, Seismic Actions and Rules for Buildings, European Committee for Standardization, Brussels, Belgium.
Calgaro, J.-A., (2011) Safety philosophy of Eurocodes. ISGSR 2011 - Vogt, Schuppener, Straub & Bräu (eds) - © 2011 Bundesanstalt für Wasserbau ISBN 978-3-939230-01-4
Calgaro, J.-A., Gulvanessian. 2001. “Management of reliability and risk in the Eurocode system”. IABSE International Conference “Safety, Risk and Reliability – Trends in Engineering”, Malta 21-23 mars 2001
Cardone, D., Conte, N., Dall’Asta, A., Di Cesare, A., Flora, A., Leccese, G., Mossucca, A., Micozzi, F., Ponzo, F.C., Ragni, L., 2017. RINTC PROJECT: NONLINEAR ANALYSES OF ITALIAN CODE-CONFORMING BASE-ISOLATED BUILDINGS FOR RISK OF COLLAPSE ASSESSMENT, Proc. of 6th ECCOMAS Thematic Conference on Computational Methods in Structural Dynamics and Earthquake Engineering (COMPDYN 2017),
Rhodes Island, Greece. pp. 1732–1747.
https://doi.org/10.7712/120117.5525.19365
Cardone, D., Conte, N., Dall’Asta, A., Di Cesare, A., Flora, A., Lamarucciola, N., Micozzi, F., Ponzo, F., Ragni, L., 2019. RINTC-E PROJECT: THE SEISMIC RISK OF EXISTING ITALIAN RC BUILDINGS RETROFITTED WITH SEISMIC ISOLATION, in COMPDYN 2019 - 7th ECCOMAS Thematic Conference on Computational Methods in Structural Dynamics and Earthquake Engineering, Crete, Greece. https://2019.compdyn.org/proceedings/pdf/19921.pdf
Christopoulos, C., Filiatrault, A., 2006. Principles of Passive Supplemental Damping and Seismic Isolation - IUSS Press - Eucentre Press. Pavia, Italy Cornell CA, Krawinkler H. 2000. Progress and challenges in seismic performance assessment. PEER News; 3(2).
CS.LL.PP. 2008. Norme tecniche per le costruzioni,” Gazzetta Ufficiale della Repubblica Italiana 29. (In Italian.)
CS.LL.PP. 2018. Aggiornamento delle norme tecniche per le costruzioni,” Gazzetta Ufficiale della Repubblica Italiana 42. (In Italian.)
Daniell, J.E., Khazai, B., Wenzel, F., Vervaeck, A., 2011. The CATDAT damaging earthquakes database. Nat. Hazards Earth Syst. Sci. 11, 2235– 2251. https://doi.org/10.5194/nhess-11-2235-2011
Dias, P., 2019. Philosophy for Engineering: Practice, Context, Ethics, Models, Failure, SpringerBriefs in Applied Sciences and Technology. Springer Singapore, Singapore. https://doi.org/10.1007/978-981-15-1271-1 Fajfar, P., 2018. “Analysis in seismic provisions for buildings: past, present and future”, The fifth Prof. Nicholas Ambraseys lecture. Bull Earthquake Eng 16, 2567–2608. https://doi.org/10.1007/s10518-017-0290-8
Franchin, P., 2018. Research Needs Towards a Resilient Community, in: Pitilakis, K. (Ed.), Recent Advances in Earthquake Engineering in Europe: 16th European Conference on Earthquake Engineering-Thessaloniki 2018. Springer International Publishing, Cham, pp. 661–691. https://doi.org/10.1007/978-3-319-75741-4_28
Gkoumas, K., Petrini F., Bontempi F., 2015. Design for Robustness, Resilience and anti-Fragility in the Built and Urban Environment: Considerations from a civil Engineering Point of View. Proceedings of the 4th International Workshop on Design in Civil and Environmental Engineering.
Iervolino, I., Dolce, M., 2018. Foreword to the Special Issue for the RINTC (The Implicit Seismic Risk of Code-Conforming Structures) Project. Journal
of Earthquake Engineering 1–4.
https://doi.org/10.1080/13632469.2018.1543697
Iervolino, I., Spillatura, A., Bazzurro, P., 2018. Seismic Reliability of Code-Conforming Italian Buildings. Journal of Earthquake Engineering 22, 5–27. https://doi.org/10.1080/13632469.2018.1540372
I. Iervolino, A. Spillatura, P. Bazzurro. 2019. RINTC-E project: towards the assessment of the seismic risk of existing buildings in Italy, in COMPDYN 2019 - 7th ECCOMAS Thematic Conference on Computational Methods in Structural Dynamics and Earthquake Engineering, Crete, Greece. https://2019.compdyn.org/proceedings/pdf/20038.pdf
Kitayama, S., Constantinou, M.C., 2019. Probabilistic seismic performance assessment of seismically isolated buildings designed by the procedures of ASCE/SEI 7 and other enhanced criteria. Engineering Structures 179, 566– 582. https://doi.org/10.1016/j.engstruct.2018.11.014
Munich Re NatCatSERVICE, 2018 Münchener Rückversicherungs-Gesellschaft, NatCatSERVICE – https://natcatservice.munichre.com/ Popper Karl R. 1959. The logic of scientific discovery. London: Hutchinson of London.
Porter, K.A. (2003). An overview of PEER’s performance-based earthquake engineering methodology. Proc. Ninth International Conference on Applications of Statistics and Probability in Civil Engineering (ICASP9) July 6-9, 2003, San Francisco, CA. Civil Engineering Risk and Reliability Association (CERRA), 973-980, http://spot.colorado.edu/~porterka/Porter-2003-PEER-Overview.pdf
Ragni, L., Cardone, D., Conte, N., Dall’Asta, A., Cesare, A.D., Flora, A., Leccese, G., Micozzi, F., Ponzo, C., 2018. Modelling and Seismic Response Analysis of Italian Code-Conforming Base-Isolated Buildings. Journal of
Earthquake Engineering 0, 1–33.
https://doi.org/10.1080/13632469.2018.1527263
Rezaei Rad, A., Banazadeh, M., 2018. Probabilistic Risk-Based Performance Evaluation of Seismically Base-Isolated Steel Structures Subjected to
Far-Field Earthquakes. Buildings 8, 128.
https://doi.org/10.3390/buildings8090128
Scozzese, F., Dall’Asta, A., Tubaldi, E., 2019. Seismic risk sensitivity of structures equipped with anti-seismic devices with uncertain properties. Structural Safety 77, 30–47. https://doi.org/10.1016/j.strusafe.2018.10.003 Shao, B., Mahin, S.A., Zayas, V., 2019. Achieving targeted levels of reliability for low-rise seismically isolated structures. Soil Dynamics and
Earthquake Engineering 125, 105744.
https://doi.org/10.1016/j.soildyn.2019.105744
Soong, T.T., Constantinou, M.C. (Eds.), 1994. Passive and Active Structural Vibration Control in Civil Engineering, CISM International Centre for Mechanical Sciences. Springer Vienna, Vienna. https://doi.org/10.1007/978-3-7091-3012-4
Wikipedia, the free encyclopedia. Civil Engineering. https://en.wikipedia.org/wiki/Civil_engineering
CHAPTER 2
2 State of the art
2.1 Seismic isolation
Seismic isolation of buildings is based on the disconnection between foundation and superstructure (i.e., the portion of the structure above the isolation system) using isolation bearings. These devices are characterized by a low horizontal stiffness, usually much lower than the lateral stiffness of the superstructure, and by the capacity of undergoing horizontal displacement of the order of tenths of centimetres while maintaining vertical support. The superstructure horizontal motion is therefore decoupled from the ground motion and the displacements are concentrated at the isolators’ level.
From a dynamic point of view, seismic isolation shifts the fundamental period of vibration of the structure beyond the predominant period of earthquakes (usually between 0.1 and 1s), thus avoiding resonance. Usually the isolation period is set higher than 2s and recently technological advancements are pushing forward to reach periods higher than 4s. In this way, seismic isolation deflects the earthquake energy by changing the dynamics of the system. If the superstructure is stiff, higher modes contribute only marginally to the seismic response. In this case, the isolated system behaves almost equivalently to a single degree of freedom (SDOF) one, with the superstructure behaving as a rigid mass.
Additional damping is usually provided to the system to suppress possible resonance at the isolation frequency and reduce the total displacement of isolation bearings (Naeim and Kelly, 1999, Christopoulos and Filiatrault 2006).
High technology internal equipment of strategic buildings such as hospitals equipment are vulnerable to interstory drift (i.e., displacement between two floors) and floor accelerations. Seismic isolation is very effective to protect
these strategic buildings because it reduces simultaneously both drifts and accelerations.
The number of seismically isolated buildings is growing and nowadays they are more tens of thousands worldwide (Clemente and Martelli, 2017). Only in Japan, according to the Japan Society of Seismic Isolation (JSSI, 2018) until the end of 2017, more than 4500 big isolated buildings have been built. There are many large-scale projects worldwide regarding residential complex, airport terminals, bridges and so on protected with seismic isolation (Clemente and Martelli, 2017). Some of the largest isolated structures in the world have been recently finished (for example Apple park, California, 2017, Adana Integrated Health Campus, 2017, Tokyo Skytree East Tower, 2012, Isparta City Hospital, 2016, Logistic Park Hino, 2015) (Scott Lewis 2017), confirming that the superior performance of isolated structure is also economically affordable.
The effectiveness of seismic isolation in reducing damage has been widely investigated in the literature and it has been confirmed by the reconnaissance reports after the major earthquakes: seismically isolated buildings performed well, under seismic actions even exceeding the design ones, and continued to be used immediately after the earthquakes, with no loss of building functionality (AIJ, 2012, Morita and Takayama, 2017). The Lu Shan County hospital behaviour during the Lushan earthquake in 2013 is one of the clearest examples of superior performance of seismically isolated buildings. The hospital was composed of three buildings, but only one had been seismically isolated; the isolated building didn’t suffer any damage or loss of functionality and all the injured people received first aid assistance there. On the contrary, the other two blocks, built according to traditional anti-seismic design, suffered damage to structural and non-structural components; even if they didn’t collapse, they were fully out of service (Clemente and Martelli, 2017, Fu Lin Zhou, 2015).
Only few cases of isolation failures have been registered worldwide and none of them, to the author’s opinion, can be directly related to the failure of isolated system when these were designed correctly following code provisions. For example, the Sendai-Tobu Viaduct during the 2011 Tohoku
the failure is related to an inappropriate design of the bearings or an unexpected interaction between adjacent decks (Kawashima, 2012). There are also other failures registered worldwide (Zayas et al., 2017) related to a wrong design (underestimation of the earthquake displacement demand of Trans-European Motorway in Bolu, Turkey)(Roussis et al. 2008), or directly related to a low quality of the production procedure (delamination of rubber bearings due to only dead loads during the construction) (Zayas et al., 2017). Another case of close-to-collapse event is the Los Caras bridge in Ecuador. During the 7.8 Mw (magnitude) Muisne earthquake the devices of one pier reached a very high displacement of 60cm (while the other 37 piers bearings underwent only a displacement around 30cm) due to an unexpected more flexible foundation of this pier than the others (Morales et. al. 2019). The bearings used in this bridge (the Triple Friction Pendulum, TFP, Fenz, and Constantinou 2008) provided a good performance: the outer retainer ring avoided the over-stroke and the downfall of the inner slider out of the external plates, resulting only in damage to the devices. But even in this case the unexpected behaviour is more related to a geotechnical issue than to an inadequate isolation design.
The performance of seismically isolated buildings can be also described in terms of resilience and robustness. In general, the concept of seismic resilience is related to the ability to overcome earthquake impacts through situation assessment, rapid response, and effective recovery strategies (measured in terms of reduced failure probabilities, reduced consequences, reduced time to recovery)(Bruneau et al., 2003). Another definition, more structural aimed, is reported in (Pitiliakis, 2015):
“Resilience referring to a single element at risk or a system subjected to natural and/or manmade hazards usually goes towards its capability to recover its functionality after the occurrence of a disruptive event. It is affected by attributes of the system, namely robustness (for example residual functionality right after the disruptive event), rapidity (recovery rate), resourcefulness and redundancy after the occurrence of a disruptive event.”
Figure 1. Resilience and the “4R’s” (from Pitilakis 2015 and Franchin 2018)
Seismically isolated buildings are characterized by high resilience: losses are very low and the rapidity in recover is very high. For seismic intensities lower or equal the design one damages could be considered zero, without any loss of functionality, as confirmed also by recent real scale test of isolated structure on shaking table (Chen et al. 2016, Pantoli et al. 2016). But what about robustness? The term robustness can also indicate the ability to limit the consequences of exceptional events, not considered in the structural design. Many modern building codes refer to the need of robustness, in the sense that the consequences of structural failure should not be disproportional to the effect causing failure (CEN2002, Baker et al., 2008, Bontempi et al., 2007). Seismic actions are characterized by a high level of uncertainties that are only partially considered in the design process by the partial factor design (Calgaro and Gulvanessian, 2001, Fajfar, 2018); consequently, very different response can be observed under similar events. In this field, the robustness of structures plays a fundamental role for safety of people and constructions.
As discussed before, while seismic isolation systems can be regarded as resilient ones in the sense that they are very effective in reducing or totally avoiding damage and downtime for low-medium intensity earthquakes, they appear to be not very robust with respect to rare seismic inputs with intensity much higher than the design one. In other words, seismically isolated structures are affected by the so called “cliff edge effect”, that is, according
to the International Atomy Energy Agency (IAEA) safety glossary (IAEA 2018):
“An instance of severely abnormal conditions caused by an abrupt transition from one status of a facility to another following a small deviation in a parameter or a small variation in an input value”.
Indeed, finding and mitigating cliff edge effects is the main objective in the safety assessment of strategic buildings such as nuclear power plants (NPPs). For seismically isolated NPPs the cliff edge effect is related to the failure of seismic isolation devices or the collision of the superstructure with the retaining walls around the structure (Nishida et al., 2018). To better understand this concept, Nishida made a comparison between the performances of an earthquake resistant structure and a base isolated structure for NPPs.
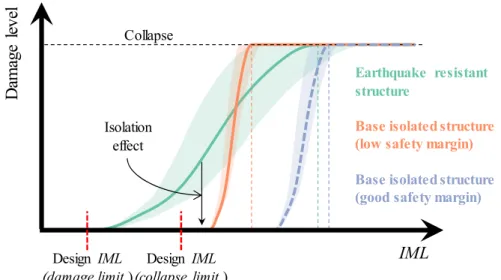
Figure 2. Seismic performance for earthquake resistance and base isolated structure beyond design earthquake (from Nishida et al. 2018)
To better understand the behaviour of seismically isolated structure respect to earthquake resistant structure with ductile behaviour (such as RC frame structures) Figure 2 shows levels of damage respect to the Intensity Measure Level (IML) of the seismic action. A standard system (green curve) is designed to avoid damage for frequent earthquake (damage limit) and to avoid collapse through structural damage for rare earthquakes (collapse limit). Uncertainties related to post-elastic behaviour are significant and so
IML Design IML (damage limit ) D am ag e le ve l Design IML (collapse limit ) Collapse Earthquake resistant structure
Base isolated structure (low safety margin)
Base isolated structure (good safety margin)
Isolation effect
the seismic response variability is important (green area). On the contrary, seismically isolated buildings (orange curve) are designed to avoid damage even for high intensity earthquakes, and minimum requirements prescribed by the seismic codes guarantee that the collapse occur only for seismic higher than the design one (collapse limit). The margin between the design and the critical value of displacement is related to the safety factor used in the design. Since superstructure behaviour of isolated systems is expected to be in the linear elastic region until the bearings reach critical levels of displacements and the isolation behaviour is well known up to the design condition plus safety factors, response uncertainties are strongly reduced. But if this safety factors are too small collapses of isolated structure could be more frequent than earthquake resistant structure because the cliff edge effect occurs for quite low seismic intensities. But using a proper safety factor in the design (or an higher seismic design input) it is easily possible to achieve a proper level of reliability (blue curve) equivalent or higher than standard structures. From a different point of view, the cliff edge effect is therefore a possible positive feature of isolated structures. As shown Figure 2, the uncertainties of the response are lower than the equivalent earthquake resistant structure, leading to a sort of “step function” for the level of damage conditioned to the level of the earthquake intensity and consequently the safety factors can be better defined than standard structures.
In other words, the response of isolated structures is predicted more accurately than the response of fixed-base structures, because of the very low level of uncertainties in the response, as confirmed also by several blind engineering analysis contests in Japan (Zayas et al., 2017), further proving the reliability of the design. Even if this brittle behaviour is somehow undesirable (and it can be mitigated by energy absorber for the impact or plastic stoppers), the key point is to understand how much it can affect the reliability of the structure, or better whether particular failure modes triggered by seismic intensities beyond the design basis contribute significantly to the probability of failure (Booth and Baker, 2000).
Considering the “4R’s” of Figure 1, seismic isolation shows very high performance in terms of rapidity. The recovery time is very low or equal to
guarantee an high reliability of the system response while robustness could be low (see Figure 4).
Figure 3. Performance of seismically isolated building
One of the first work on the safety of base isolated structures is the one of Kikuchi et al. (1995), who investigated the seismic response of a two degree of freedom (2DOF) nonlinear model. This study highlighted the advantages of seismic isolation with respect to traditional design, but also showed that seismically isolated structures designed with reduced lateral shear force (equivalently, with a large behaviour factor, i.e. the lateral force reduction factor used in the design) can exhibit significant inelastic actions and an unacceptable behaviour. In a later work (Kikuchi et al. 2008), the response of yielding seismically isolated structures was further studied, showing that sufficient lateral strength must be provided in the isolated superstructure, such that elastic or essentially elastic response dominates in a significant seismic event. In this way, a proper level of safety is achieved.
Nakazawa et al. (2011) performed incremental dynamic analysis (IDA) on a non-linear 2DOF model of an isolated building to determine the collapse margin ratio based on the FEMA P695 procedures (FEMA, 2009). Following the Japanese practice of seismic design, the strength of the superstructure was assumed in the range of 0.15 to 0.40 of the superstructure weight (common practice in Japan considers the value 0.3). In terms of modelling, they considered a trilinear degrading hysteretic behaviour for the superstructure and a combination of non-linear models for isolation, dampers and pounding
states: (i) fracture of the bearing (after hardening behaviour of the rubber); (ii) collision of the superstructure with surrounding retaining walls; (iii) excessive damage in the superstructures. It is worth to note that the fracture shear limit of the rubber bearings in this study was fixed to 450%; beyond this limit the restoring force was replaced by the friction between the isolation layer and its foundation (assuming a post fracture behaviour, even if the fall down of the isolation layer due to isolator fracture is not considered). They also stated that robustness of the base-isolated buildings is generally considered lower than that of fixed-based structures.
Kitayama and Constantinou (2018) and Shao et al. (2019) assessed the reliability levels of seismically isolated steel frames (6 and 3-story respectively) designed according to ASCE/SEI 7-16, using triple friction pendulum bearings. The model used was a MDOF two-dimensional representation of the structure; the force-resisting frame in the principal direction was explicitly modelled with fiber non-linear elements. They showed that isolated structure designed according to ASCE/SEI 7 minimum requirements of either 2010 or 2016 may have unacceptable probability of collapse in the Risk-Targeted Maximum Considered Earthquake and the probability of collapse in the MCER becomes acceptable when they are designed with enhanced criteria of a lateral force reduction factor lower than 1.0 and providing a stiffening behaviour and an increase displacement capacity of the bearings respect to the displacement demand. The authors also highlighted the need to extend these studies to other structural systems (e.g., concrete frames), to other seismic isolation systems and to other sites, including near-fault sites. The last one is a key point, because the hazard scenario could strongly influence the results. It is also worth to note that the model used was only two-dimensional and no consideration regarding the three-dimensional behaviour of the isolation systems was made. First attempt to analyse different isolation systems in a three-dimensional model can be found in Rezaei Rad and Banazadeh (2018). Kitayama and Constantinou (2019) also investigated on their model (the one of Kitayama and Constantinou (2018)) the behaviour of isolated buildings in terms of performance levels other than the collapse one, such as those related to
damage of structural and non-structural components (monitored via peak drift, residual drift and average floor spectra acceleration).
In this context, the work carried out in this PhD thesis (and partially published in Ragni et al., 2018) is one of the first study on the reliability of seismically isolated structures on a full three-dimensional model considering various hazards and isolation systems.
2.2 Seismic risk assessment
Seismic risk assessment aims to define the probability of a structural system attaining an unsatisfactory performance (failure) within a reference lifetime. There are two different alternative probabilistic approach: (i) direct, simulation-based approach, (ii) conditional, Intensity Measure based approach (IM based) (Cornell 2005, Bradley et al. 2015). Despite the former generally represent the most robust way for estimating seismic risk, it is usually limited to the research field because of its complexity and because the computational effort is usually very demanding. Differently, the latter instead has been developed within the last 20 years with the main purpose of making seismic risk estimation a more practice-oriented and affordable task. The key of the IM-based approach is the definition of a specific parameter (the Intensity Measure) that represents properly the ground motion intensity of the earthquake. The use of this IM allows the seismic risk estimation procedure to be split into separate probabilistic steps: the first step concerns the seismic hazard characterization through a proper statistical representation of the IM; the second stage aims at evaluating the system vulnerability conditional to specific values assumed by the intensity measure (Scozzese, 2017). The IM-based (conditional) method has been introduced within the Performance-Based Earthquake Engineering (PBEE) probabilistic framework (Cornell and Krawinkler, 2000, Porter, 2003), developed by the Pacific Earthquake Engineering Research (PEER) Center as a reaction to the large amount of damage and economic losses (both direct and indirect due to repair) registered right after the 1994 Northridge and 1995 Kobe earthquakes. In PBEE, the final probabilistic output comes from the direct application of the total probability theorem, which allows for the combination of the partial
results of several steps. There are different versions of the framework. The number and the types of steps depend on which result the assessment is aimed (e.g. probability of failure, loss analysis, final decision making), but they can be divided in three groups: a first part where there is the hazard assessment, a middle part where there is the system vulnerability assessment and a final part where there is the consequences assessment. Each step leads to a specific measure to determine as output quantity, and next steps use the output from the previous stage as input. The efficiency of such a conditional method is strictly related to the choice of the measure selected to link the PBEE framework’s steps.
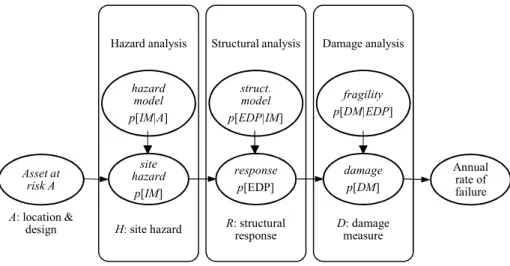
If the final target is the probability of failure, the risk assessment can be represented, according to the classical PBEE framework as in Figure 4. The reliability of the system (probability of failure), which is the target of this framework, can be quantified in terms of annual failure rate λf (mean
frequency of occurrence of failure in a year the undesirable outcome).
Figure 4: Adaptation of the PEER framework for the seismic risk assessment
The probabilistic steps are briefly recalled below, while a deeper discussion of the first two steps of the framework, of interest for the aims of the present thesis, is provided afterwards.
Hazard analysis: it is the analysis aimed to evaluate the mean annual frequency of exceedance of various seismic intensity levels at a particular site (Porter, 2019), called Probabilistic Seismic Hazard Assessment (PSHA). As mentioned before, this involves selecting an adequate intensity measure (IM) as a synthetic descriptor of the earthquake intensity. The analysis output
Asset at risk A A: location & design Hazard analysis hazard model p[IM|A] site hazard p[IM] H: site hazard Structural analysis struct. model p[EDP|IM] response p[EDP] R: structural response Damage analysis fragility p[DM|EDP] damage p[DM] D: damage measure Annual rate of failure
is expressed in terms of seismic hazard curves, providing the mean annual rate of exceedance of various IM levels.
Structural analysis: procedure to define the structural response, described by means of one or more Engineering Demand Parameters (EDPs). The output of interest is represented by the probability p[EDP|IM]. For these purposes, a set of nonlinear dynamic analyses is performed under a suite of ground motion records which should be ideally representative of the seismic hazard at the different IM levels (Jalayer, 2003, Luco and Cornell 2007, Jalayer and Cornell, 2009,). There are different methods for estimating the conditional probability p[EDP|IM] (incremental dynamic analysis, multi-stripe analysis, cloud analysis) (Mackie and Stojadinovic, 2003).
Damage analysis: in this step, the structural response described through the EDPs is associated to quantifiable damage states. The Fragility is a mathematical function that expresses the probability that some undesirable event occurs (typically that an asset reaches or exceeds some clearly defined limit state) as a function of some measure of environmental excitation (typically a measure of acceleration, deformation, or force). It can be defined also as the cumulative distribution function of the capacity of an asset to resist an undesirable limit state (Porter, 2019).
It is worth to note that the decomposition that is at the base of PBEE relies upon the fundamental Markovian assumption that conditioned on EDP, DM is independent of IM (Kiureghian, 2005).
The failure of the system can be related to different performances of the system like a level of structural damage that is so high to make more economical to demolish than to repair the building, or a level of structural and non-structural damage that leads to the loss of serviceability. These performance levels can be associated to either global or local EDPs. Typical global EDPs are the inter-story drifts, able to furnish an indirect measure of structural damage (Kitayama et al. 2018, Kitayama et al. 2019) whereas local EDPs (Tubaldi et al., 2016; Dall’Asta et al., 2017; Freddi et al., 2013; Freddi et al., 2017; Mackie and Stojadinovic, 2003; Lupoi et al., 2002) are related to some specific element response (i.e., beam’s plastic deformation, forces on dissipation device, etc.).
2.2.1 Seismic risk and design codes
Although current design codes for structures set target reliability levels, they fail in providing an explicit control of the seismic structural performance in the assessment and design stage (Gkimprixis et al. 2019, Iervolino et al. 2018). Performance-Based Earthquake Engineering and all the later evolutions (FEMA P-695, FEMA P-58, CNR 2014, CEN 2017) allow the explicit quantification of risk of collapse and of damage limit states, but these procedures are “too complex and lengthy for routine use in the design” (Haselton et al., 2017), and it is “extremely unlikely that these methods will be adopted in seismic codes in the foreseeable future as a mandatory option” (Fajfar, 2018).
Attempts to close the gap between probabilistic target and affordable methods for design are current research topic, and they can be gathered under the risk-targeting (Luco et al., 2007, Gkimprixis et al., 2019, Žižmond and Dolšek, 2019), and possibly will find their way into the next generation of codes.
Even if different approaches are implemented in modern codes (and fully explicit probabilistic approach would be included in few years or are still partially included), the current procedure mostly used by the engineers is the so-called load-resistance-factor-design (Ellingwood, 2000), better known as partial factor design. It is a compromise between probabilistic approach and a deterministic format (from here the name semi-probabilistic format) in which the structural safety verification is carried out by Calgaro (2011): - selecting appropriate representative values of the various random
variables (actions and resistances),
- applying a set of calibrated partial factors,
- applying safety margins, more or less apparent, in the various models (models of actions, of effects of actions and of resistances)
- verifying, in most common case, that the effect of the action (such as internal force), is lower than the resistance.
More in detail, current approaches for earthquake design of structures set a series of performance thresholds, or Limit States, that should not be exceeded
under ground-motion intensities that have a specified exceedance probability in a given time interval at the building site.
The partial factors in the codes, for example in the Eurocodes, have been calibrated by using structural reliability methods to ensure a target failure probability of 7.2·10-5 for common structures, during the entire working life
(Calgaro, 2011, CEN 2002, HANDBOOK2). But it is well known that partial factor design, although has represented a giant leap in earthquake resistant design when introduced, does not allow to explicitly control the reliability of the designed structure for earthquake actions, that is ultimately unknown (Iervolino and Dolce, 2018).
Moreover, as stated in the introduction, the tolerable probability of failure is not only related to consequences in terms of risk to life and potential economic losses, but also a reflection of societal judgements (Fajfar, 2018). Target provided by the standard changed during time due to the developing of research. For example, in EN1990 (CEN 2002) the annual probability of failure is about Pf ≈ 10-6 (HANDBOOK2). But this is a value too low for
seismic risk, unreachable by complying
with current seismic codes. For example, according to ASCE/SEI 7-16, the absolute collapse probability target is 1% in 50 years, that is a probability of failure Pf = 2×10⁻⁴. (ASCE, 2017). This is the most popular value for the
annual probability of failure (Fajfar, 2018), and it is also suggested in the draft Annex to the revised Eurocode 8 (CEN 2017, Dolsek 2017). It is also comparable to the probabilities of failure estimated for buildings compliant with current seismic codes (Fajfar, 2018). Therefore, the current state of the art for reliability target is a different value of probability of failure for seismic action and the other load conditions (gravity load, wind, snow…). A reason for this bias is that the different perception of the failure related to an earthquake is somehow considered more acceptable respect to a gravity load failure. Moreover, it is also reasonable that current standards provide an economically-balanced level of security.
2.2.2 RINTC Framework
In the framework of the RINTC project (Iervolino et al. 2018) the PBEE framework presented is only partially used. After the PSHA and the structural
analysis the damage analysis is simply based on two different performance levels: the usability-preventing damage (UPD) and global collapse (GC). They are two different failure criteria (threshold) representing two conditions related to the real loss of functionality and the real collapse of the building and the related loss of human lives respectively. The definition of these two limits is provided afterwards (Table 1 and Table 20), because they depend on the type of model used for the bearings in the analysis.
It is possible to demonstrate that if earthquake occurrence can be described as a homogenous Poisson process (HPP), so that hazard is memoryless and do not vary over time, also the counting process of earthquakes capable of causing failure is an HPP, characterized by the λf rate and the response
system is time independent. Thus, the probability that failure will occur at least once in any interval time ΔT is given by:
1 exp(
f)
f
P
T
(2-1)The failure rates are obtained for all the case-study buildings and for both GC and UPD, according the theorem of total probability, integrating the structural fragility and the seismic hazard for the site where the structures are located (and so also designed) by:
0
[ | ] | ( ) |
f P failure IM x d IM x
(2-2)In Eqn. (5-2), λIM(x) is the annual rate of exceedance of an IM causing the
exceedance of an intensity measure (IM) equal to a specific value, IM = x, at the building site (from PSHA) and P[failure|IM = x], x is the fragility of the structure. In the RINTC project, the adopted IM is the 5% damped (pseudo)spectral acceleration at the fundamental period of the structure, Sa(T1) or simply Sa. The seismic hazard is computed considering the same
source model adopted by the Italian seismic code (CS.LL.PP., 2008, 2018) to define the seismic design actions. The response assessment of the structures is carried out through a multi-stripe dynamic analysis (Jalayer, 2003), providing a probabilistic characterization of the seismic response for a range of ground-motion intensities at the site of interest. For this purpose,