nAChRs gene expression
and neuroinflammation
in APPswe/PS1dE9 transgenic
mouse
D’Angelo Chiara
1, Costantini Erica
1, Salvador Nieves
2, Marchioni Michele
1, Di Nicola Marta
1,
Greig H. Nigel
3& Reale Marcella
1*An evaluation of the APPswe/PS1dE9 transgenic AD mouse, presenting with the toxic Aβ1-42 deposition found in human AD, allowed us to characterize time-dependent changes in inflammatory and cholinergic markers present in AD. Astrogliosis was observed in cortex and hippocampus, with cellular loss occurring in the same areas in which Aβ plaques were present. In this setting, we found early significantly elevated levels of IL-1β and TNFα gene expression; with the hippocampus showing the highest IL-1β expression. To investigate the cholinergic anti-inflammatory pathway, the expression of nicotinic receptors (nAChRs) and cholinesterase enzymes also was evaluated. The anti-inflammatory nAChRα7, α4, and β2 were particularly increased at 6 months of age in the hippocampus, potentially as a strategy to counteract Aβ deposition and the ensuing inflammatory state. A time-dependent subunit switch to the α3β4 type occurred. Whether α3, β4 subunits have a pro-inflammatory or an inhibitory effect on ACh stimulation remains speculative. Aβ1-42 deposition, neuronal loss and increased astrocytes were detected, and a time-dependent change in components of the cholinergic anti-inflammatory pathway were observed. A greater understanding of time-dependent Aβ/nAChRs interactions may aid in defining new therapeutic strategies and novel molecular targets.
Alzheimer’s disease (AD) is a progressive neurodegenerative condition, whose etiopathogenic mechanisms are not totally understood. Its multifactorial character makes a definitive diagnosis and the development of new drugs and effective treatment strategies challenging1. The amyloid-β (Aβ) cascade hypothesis2,3 remains the most
accepted explanation underpinning the pathogenesis of AD, and although clinical trials conducted to reduce Aβ in brain have not improved clinical outcome measures4,5, such failures have not led to the abandonment of
the amyloid hypothesis as Aβ is an invariant pathological feature in the post-mortem brain of AD patients. An appreciation that Aβ alone does not account for AD pathogenesis, and that it interacts with and triggers other cascades that, together, impact brain function has focused attention on combinatory mechanisms and particularly on the cholinergic system, whose aberrations are the basis of the cholinergic hypothesis6.
The cholinergic hypothesis of AD is based on the development of a well characterized atrophy of the nucleus of origin of cholinergic nerves, a decline in acetylcholinergic neurons that project to the cortex from the Meynert nucleus, a decreased activity of acetylcholine transferase activity in the cortex, and a reduced expression of ACh as well as of nicotine acetylcholinergic receptors (nAChRs)7,8. These changes result from a progressive dysfunction
and death of forebrain cholinergic neurons with an extended cholinergic presynaptic denervation6,9,10. nAChRs
are present on immune and glial cells, in addition to cholinergic neurons, and this immune cell expression has attracted attention for potential therapeutic targeting of the inflammation that invariably occurs in neurode-generative diseases, including AD11–13. Nicotinic neuroprotection is considered mediated, in large part, via
α7nAChRs14. The α7 subunit has also been implicated in Aβ toxicity, which has been reported to be bound to this
specific receptor subunit in post-mortem AD brains15,16, and may contribute to an imbalance in the cholinergic
anti-inflammatory pathway. The term “cholinergic anti-inflammatory pathway” was coined in recognition of
OPEN
1Department of Medical, Oral and Biotechnological Sciences, University “G. D’Annunzio”, Via dei Vestini 31,
66100 Chieti, Italy. 2Department of Molecular, Cellular and Developmental Neurobiology, Instituto Cajal-CSIC,
Madrid, Spain. 3Drug Design and Development Section, Translational Gerontology Branch, Intramural Research
Program, National Institute on Aging, National Institutes of Health, Baltimore, MD 21224, USA. *email: mreale@
the ability of ACh to actively reduce the secretion of pro-inflammatory cytokines, and principally the synthesis and release of Tumor Necrosis Factor-α (TNFα), Interleukin (IL)-1β, IL-6, and IL-1817–19. This important
anti-inflammatory pathway can be triggered following ACh binding of homopentameric α7nAChRs on peripheral immune cells and macrophages, but also directly on immune cells and neurons within the CNS20–23. The final
step in the cholinergic signalling pathway involves the degradation of ACh by the cholinesterase enzymes (acetyl- (AChE) and butyrylcholinesterase (BuChE)). It has been reported that cholinesterase enzyme hydrolyzing activ-ity is elevated in neurodegenerative disorders such as Multiple Sclerosis24. In AD, this situation appears to be
more complex. An abnormal expression of AChE and BuChE has been observed in association with Aβ plaques and neurofibrillary tangles25,26, with colocalization27,28. In this light, it is feasible that Aβ is, in part, accountable
for the increases in cholinesterase enzyme levels surrounding plaques and vice versa29,30 and, additionally, that
hyperphosphorylated tau induces the expression of AChE enzyme31. A reduced AChE enzymatic activity has
been reported by several studies32,33, as have elevations in BuChE27,28, and therefore the role of cholinesterase
enzyme still remains complicated and multifaceted in AD, with further studies being required. A resulting lower availability of ACh would detrimentally impact synaptic transmission and the anti-inflammatory pathway. Thus, in addition to Aβ and amyloid deposition mediating neuronal injury and impaired cholinergic function, neuro-inflammatory cascades are chronically triggered and drive AD pathogenesis34,35. In this regard, glial cells, such
as astrocytes and microglia, are abnormally activated and, thereby, not only contribute to the pathogenesis of neurodegenerative disorders34,35 but also provide a therapeutic target to potentially resolve chronic
neuroinflam-mation and potentially slow disease clinical course.
In the current study, our focus was to aid elucidateion of the pathogenic processes across the AD time course. Specifically, we evaluated the cerebral cortex and hippocampus of a widely used transgenic mouse model of AD (APPswe/PS1dE9 mice) to characterize potential crosslinks between inflammatory molecules and cholinergic components in brain areas specifically involved in AD.
Results
Time-dependent Aβ-deposit distribution in the brain.
To evaluate Aβ deposition, sections of the hemibrain of our Tg (APPswe/PS1dE9) mouse model were labelled for immunofluorescent analysis. Aβ 1–42 specific antibody was used to visualize the distribution of Aβ deposits in Fig. 1. In APPswe/PS1dE9 mice, Aβ accumulation started precociously, and by 6-months of age Aβ deposits were already evident, as particularly noted within the entorhinal and frontal cortex and the hippocampus (Fig. 1A). Aβ specific fluorescence increased in number and size over time, reaching a maximum at 24 months of age (the oldest animals studied) (Fig. 1B,C) (Table 1). In this regard, in the representative Figure from 24-month old Tg mouse, Aβ deposits were widely dis-tributed throughout almost all regions within the brain section (Fig. 1C). A representative immunofluorescent image from a similarly aged WT mouse shows non-detectable Aβ-deposits (Fig. 1D).Immunohistochemistry of Aβ plaques, astrocytes, and neurons, and their quantification in
cortex and hippocampus.
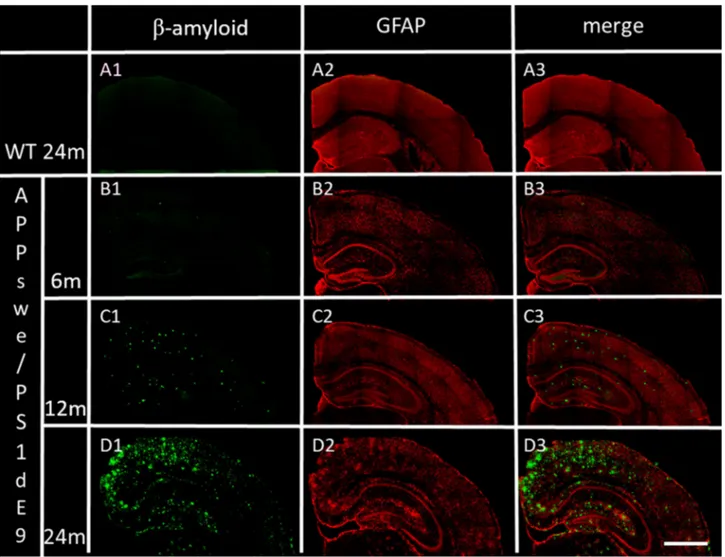
To evaluate astrocyte presence together with time-dependent Aβ deposition, sections of the hemibrain of our Tg (APPswe/PS1dE9) mouse model were labelled for immunofluorescent analysis with specific antibody anti-GFAP, the glial fibrillary acid protein (red) and Aβ 1–42 specific antibody (Fig. 2). In the representative Figures from 6-, 12- and 24-month old AD Tg mice, GFAP fluorescence is widely distributed throughout almost all regions, and increased over-time within the brain coronal sections (Fig. 2B2– D2). An over-time increase is likewise shown for Aβ-deposits in B1, C1, and D1, and, in particular, can be Figure 1. Spatial distribution of Aβ-deposits in hemibrain from APPswe/PS1dE9 mice at different ages, compared to an representative image from a 24-month old WT mouse. Aβ-deposits in (A) 6-month old, (B) 12-month old and (C) 24-month old APPswe/PS1dE9 mouse. (D) 24-month old WT mouse, stained for but without any evident hemibrain Aβ-deposits. Coronal section 50 µm. (×10). Anti-Aβ (green) and bismencimide (blue). Bar 1 cm.noticed together with GFAP fluorescence within the merged images (Fig. 2B2–D2). A representative image from 24-month old WT mouse shows no evidence of reactive astrocytes (Fig. 2 A2) or Aβ-deposits (Fig. 2 A1, A3) a non-evident reactive astrocyte Fig. 2 A2 or Fig. 2 A1, A3 and non-detectable Aβ-deposits.
The marked time-dependent increase of astrocyte number was quantified in both the hippocampus and cortex (Table 1). Aβ plaques and astrocytes in 24-month old AD mice were significantly higher in comparison to age-matched WT mice (WT cortex %Aβ mean ± SEM: 0.28 ± 0.08, p < 0.001; %GFAP mean ± SEM: 6.55 ± 0.65, p < 0.001; WT hippocampus %Aβ mean ± SEM: 0.35 ± 0.12, p < 0.001; %GFAP mean ± SEM: 5.34 ± 0.31, p < 0.001). In linear mixed models adjusting for the effect of age, statistically significant differences were detected for GFAP (p < 0.001) (Table 1). Moreover, in linear mixed models adjusting for the effect of brain area and age, statistically Table 1. Percentage of GFAP, Aβ, and neuN in different brain regions and at different postnatal ages, in AD Tg mice. Data are reported as mean ± SEM. p-values derived from a linear mixed model with brain region as the within variable and age as the between variable. C cortex, H hippocampus.
6 months 12 months 24 months p-value
C H C H C H Area Age Interaction
% GFAP 11.78 ± 0.94 11.37 ± 1.41 14.10 ± 1.02 13.38 ± 0.97 16.55 ± 0.56 15.43 ± 1.19 0.398 < 0.001 0.501 % Aβ 9.06 ± 0.82 7.40 ± 0.54 15.17 ± 0.66 11.63 ± 0.76 17.28 ± 0.70 13.38 ± 1.02 < 0.001 < 0.001 0.009 % neuN 18.07 ± 1.06 15.44 ± 0.73 17.63 ± 0.59 14.47 ± 0.81 17.51 ± 1.32 14.22 ± 0.93 < 0.001 0.017 0.908
Figure 2. Distribution in cortex and hippocampus of Aβ deposits and GFAP, in WT and APPswe/PS1dE9 mice at 6-, 12- and 24-months of age (representative images). (A1) Aβ deposits in 24-month old WT mouse. (B1,C1,D1) time-dependent Aβ deposits in APPswe/PS1dE9 Tg mice. (A2) GFAP in 24-month old WT mouse. (B2,C2,D2) time-dependent GFAP in APPswe/PS1dE9 Tg mice. (A3,B3,C3,D3) previous merged images. Coronal section 50 µm (×20). Anti-Aβ (green), anti-GFAP (red). Bar 1 cm.
significant differences between area and age were detected for Aβ (p = < 0.001), and the interaction between brain area and age was statistically significant too (p = 0.009) (Table 1). This means that the time-dependent changes of Aβ plaque accumulation varies within each considered area. In addition, the time-dependent increase of both Aβ plaques and astrocyte number was significantly correlated both in hippocampus (rho = 0.740, p < 0.001) and cortex (rho = 0.796, p < 0.001).
In Fig. 3, together with time-dependent Aβ deposition (B1, C1, and D1), neuronal cells were also stained using the specific antibody anti-neuN (B2, C2, and D2), and both are clearly apparent in the merged images (B3, C3, and D3) in AD mice. A representative image from 24-month old WT mouse is also provided (Fig. 3A1–A3). The fluorescence of neuN was quantified and was time-dependently reduced in AD mice. Hippocampus showed a greater time-dependent neuronal loss with respect to cortex, in linear mixed models adjusting for the effect of brain area and age; with statistically significant differences being detected for neuN (p < 0.001 and p = 0.017 respectively) (Table 1). Moreover, the time-dependent reduction of neurons and the increase in Aβ deposits were significantly inversely correlated both in hippocampus (rho = − 0.561, p = 0.002) and cortex (rho = − 0.581, p = 0.001). A significant inverse correlation resulted between astrocyte and neuron number both in hippocampus (rho = − 0.382, p = 0.045) and cortex (rho = − 0.528, p = 0.004).
Immunohistochemistry of Aβ plaques, astrocytes, and neurons in cortex and hippocampus
from 24-month old AD (APPswe/PS1dE9) mice.
Coronal sections of cortex and hippocampus were further labeled in AD (APPswe/PS1dE9) mice at 24 months, in order to show the combined localization of Aβ deposits, astrocytes and cell nuclei fluorescence within these brain regions. Figure 4 provides representative images from 24-month old AD Tg mice. Aβ deposition and the AD characteristic plaques are conspicuously present in both the cortex and hippocampus (Fig. 4A,B). Moreover, the existence of astrogliosis is notably sur-rounding the Aβ deposits in both cortex (Fig. 4A1,A4) and hippocampus (Fig. 4B1,B4), and there is a lack of cell Figure 3. Distribution in cortex and hippocampus of Aβ deposits and neuN, in WT and APPswe/PS1dE9 mice at 6-, 12- and 24-months of age (representative images). (A1) Aβ deposits in 24-month old WT mouse. (B1,C1,D1) age-dependent Aβ deposits in APPswe/PS1dE9 Tg mice. (A2) neuN in 24-month old WT mouse. (B2,C2,D2) age-dependent neuN in APPswe/PS1dE9 Tg mice. (A3,B3,C3,D3) previous merged images. Coronal section 50 µm (×20). Anti-Aβ (green), anti-neuN (red). Bar 1 cm.nuclei fluorescence in the same areas in which astrogliosis and Aβ plaques are present (Fig. 4A3,B3). Aβ deposits are largely observable in Fig. 4A2 (cortex), and Fig. 4B2 (hippocampus).
Time-dependent brain expression profile analysis of IL-1β and TNFα cytokines, and of MCP-1
chemokine in AD (APPswe/PS1dE9) mouse brain.
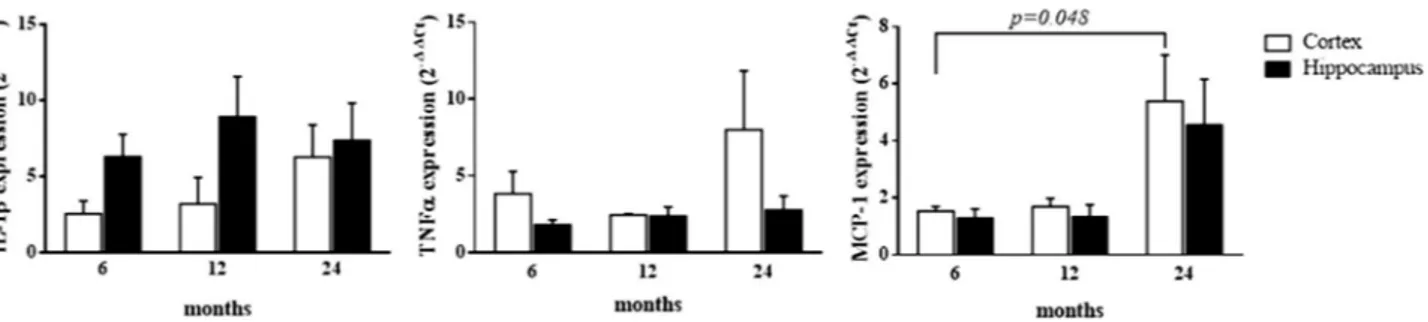
To aid elucidate the neuroinflammatory environ-ment and differential involveenviron-ment of the hippocampal and cortical regions, IL-1β, TNFα, and MCP-1 mRNA expression was analyzed in 6-, 12- and 24-month old AD Tg mice, with respect to age-matched WT mice. Our results demonstrate a generally lower elevated expression level of MCP-1 chemokine in AD vs. WT mice, as compared to the pro-inflammatory cytokines, IL-1β and TNFα (Table 2). These data were additionally con-firmed by normalizing the aged APP/PS1 (12 and 24 months) vs. APP/PS1 (6 months) assumed as the calibrator. This additional analysis allowed us to exclude the influence of physiological aging in WT mice, on gene expres-sion variation (data not shown). Interestingly, IL-1β and TNFα were significantly and substantially increased in the hippocampus at the early 6 month time point in AD Tg mice, with respect to WT mice. In hippocampus, this elevated expression of both pro-inflammatory cytokines remained significantly sustained. With respect to cortex IL-1β and TNFα expression, neuroinflammation seems to be delayed (in comparison to that evident in hippocampus) and peaked at 24 months. Changes in MCP-1 expression were largely similar in cortex and hip-pocampus, and were relatively modest at 6 and 12 months of age (albeit reaching statistical significance in the cortex). However, MCP-1 expression was substantial and reached its highest level at 24 months of age, in both hippocampus and cortex.Figure 4. Presence of clusters of reactive astrocytes surrounding Aβ-deposits in APPswe/PS1dE9 mouse cortex and hippocampus (representative images). (A) Distribution of Aβ-deposits in cortex coronal section 50 µm of 24-months old AD (APPswe/PS1dE9) mouse (×10). (A1) Reactive astrocytes (×40). (A2) Distribution of Aβ-deposits, (×40). (A3) Cell nuclei (×40), arrows indicate the loss of cells in the same locality where there are Aβ-deposits, and the presence of reactive astrocytes around and between the Aβ plaques. (A4) Merged (A1,A2,A3). (B) Distribution of Aβ-deposits in hippocampus coronal section 50 µm of 24-month old AD (APPswe/PS1dE9) mouse (×10). (B1) Reactive astrocytes in granular layer of the gyrus dentate of hippocampus (×40). (B2) Distribution of Aβ-deposits, (×40). (B3) Cell nuclei (×40), arrows indicate the loss of cells in the same location where there are Aβ-deposits, and the localization of reactive astrocytes around and between the Aβ plaques. (B4) Merged (B1,B2,B3). Coronal section 50 µm. Anti-GFAP (red), anti-Aβ (green), bismencimide (blue). Bars 1 cm (A,B) and 0.5 cm (A1–A4, B1–B4).
Table 2. Gene expression levels (2–ΔΔCt) of pro-inflammatory cytokines, in different brain regions and at different postnatal ages, in AD (APPswe/PS1dE9) Tg mice with respect to age-matched WT mice. Data are reported as mean ± SEM. p-values derived from a linear mixed model with brain region as the within variable and age as the between variable. Statistically significant comparisons with respect to WT mice are shown in bold characters (p < 0.05). C cortex, H hippocampus.
6 months 12 months 24 months p-value
C H C H C H Area Age Interaction
IL-1β 2.55 ± 0.84 6.29 ± 1.49 3.20 ± 1.75 8.92 ± 2.66 6.28 ± 2.12 7.38 ± 2.45 0.049 0.530 0.542 TNFα 3.85 ± 1.46 1.81 ± 0.33 2.45 ± 0.10 2.38 ± 0.59 8.02 ± 3.82 2.78 ± 0.93 0.055 0.406 0.367 MCP-1 1.53 ± 0.17 1.31 ± 0.30 1.69 ± 0.29 1.35 ± 0.41 5.38 ± 1.62 4.57 ± 1.58 0.538 0.026 0.934
Moreover, in linear mixed models that adjusted for the effect of age and the interaction between age and brain areas, a statistically significant difference between areas was detected for IL-1β expression (p = 0.049) (Table 2). Conversely, in the same models adjusting for the effect of brain areas and the interaction between age and areas, a statistically significant difference between ages was detected for MCP-1 expression (p = 0.026). Notably, no interaction between age and brain areas was evident in our models for all the pro-inflammatory cytokine gene expression levels (Table 2). This means that the variation of gene expression levels is attributed to only one of the analyzed factors.
In post-hoc analyses, a statistically significant increase in MCP-1 gene expression levels was found within the cortex between 6 and 24 months (p = 0.048) (Fig. 5).
Brain expression profile analysis of nAChRs in AD (APPswe/PS1dE9) Tg mice.
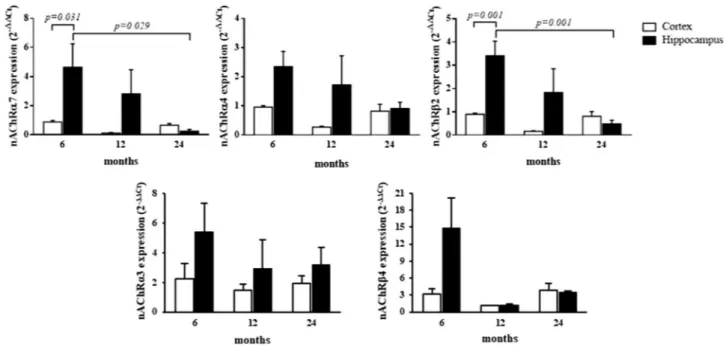
In relation to changes in nAChRs expression, an increase in receptor subunits α3 and β4 was largely evident across all analyzed ages in both the hippocampus and cortex, in which gene expression remained significantly sustained with respect to age-matched WT mice (Table 3). These data were additionally confirmed by normalizing the aged APP/PS1 (12 and 24 months) vs. APP/PS1 (6 months), assumed as the calibrator. This additional analysis allowed us to exclude the influence of physiological aging in WT mice, on gene expression variation (data not shown). In gen-eral, the highest expression levels of receptor subunits α3 and β4 were evident in the younger (6 months) AD Tg mice that, although decreasing overtime, remained elevated with respect to WT groups. In cortex, the expression levels of nAChRα7, α4, and β2 subunits were lower than those in age-matched WT mice. Notably, at 6 months of age, the expression levels of the same subunits were found to be higher in the hippocampus (p < 0.05) and not significantly different at 12 months in hippocampus of AD Tg mice, vs. WT. At 24 months, levels of nAChRα7, α4, and β2 subunits in hippocampus had declined, and similar to levels detected in the cortex (Table 3).Furthermore, in linear mixed models adjusting for the effect of age and the interaction between age and brain areas, a statistically significant difference between areas was detected for nAChRα7, α4, and β2 (p = 0.026, p = 0.020, and p = 0.005, respectively) (Table 3). Additionally, in linear mixed models adjusting for the effect of brain area and the interaction between age and areas, statistically significant differences between age were detected for nAChRα7 and β2 (p = 0.032, and p = 0.004, respectively) (Table 3), and the interaction between brain area and age was statistically significant with regard to nAChRβ2 expression (p = 0.007) (Table 3). This means that the time-dependent changes in nAChRβ2 gene expression levels varies within each considered brain area. In post-hoc analyses, a statistically significant increase in nAChRα7 gene expression levels was found in the hippocampus, between 6 and 24 months (p = 0.029) and within the 6 month group between brain areas (p = 0.031) (Fig. 6). Figure 5. Cytokine/chemokine expression levels in cortex and hippocampus at different postnatal ages in AD (APPswe/PS1dE9) Tg mice with respect to age-matched WT mice. Bar plots graphically depict the mean and SEM of pro-inflammatory cytokine/chemokine gene expression levels in cortex and hippocampus at different postnatal ages. Statistically significant p-values, after adjustment according to the FDR methods, are graphically depicted too.
Table 3. Gene expression levels (2–ΔΔCt) of nAChRs, in different brain regions and at different postnatal ages, in Tg mice respect to age-matched WT. Data are reported as mean ± SEM. p-values derived from a linear mixed model with brain region as the within variable and age as the between variable. Statistically significant comparisons with respect to similarly aged WT mice are shown in bold characters (p < 0.05). C cortex, H hippocampus.
6 months 12 months 24 months p-value
C H C H C H Area Age Interaction
nAChRα7 0.89 ± 0.10 4.64 ± 1.61 0.13 ± 0.04 2.82 ± 1.65 0.66 ± 0.12 0.26 ± 0.11 0.026 0.032 0.059 nAChRα4 0.96 ± 0.05 2.35 ± 0.52 0.27 ± 0.03 1.72 ± 1.00 0.82 ± 0.24 0.91 ± 0.22 0.020 0.110 0.177 nAChRβ2 0.90 ± 0.05 3.41 ± 0.63 0.17 ± 0.02 1.83 ± 1.02 0.81 ± 0.21 0.48 ± 0.16 0.005 0.004 0.007 nAChRα3 2.24 ± 1.01 5.39 ± 1.97 1.49 ± 0.38 2.96 ± 1.90 1.96 ± 0.48 3.20 ± 1.18 0.178 0.599 0.810 nAChRβ4 3.20 ± 0.96 14.86 ± 5.26 1.10 ± 0.11 1.16 ± 0.26 3.88 ± 1.12 3.47 ± 0.29 0.239 0.434 0.550
Likewise, a statistically significant increase in nAChRβ2 gene expression levels was found within the hip-pocampus, between 6 and 24 months (p = 0.001) and within the 6 month group between brain areas (p = 0.001) (Fig. 6).
Over-time relation between Aβ plaques, anti-inflammatory nAChRα7, and proinflammatory
IL-1β.
Figure 7 reports the over-time trend of IL-1β and nAChRα7 gene expression levels and the percentage of Aβ deposition, quantified from immunofluorescent sections obtained from cortex and hippocampus at differ-ent postnatal ages. The relationship between mouse age and gene expression, as well as immunofluorescdiffer-ent data, are represented as β coefficients for both cortex and hippocampus, in AD Tg mice, and were reported in the sup-plementary table. In both brain areas, a positive relationship was found between age and Aβ, as well as age and IL-1β (Fig. 7). Conversely, a negative relationship was evident between mouse age and nAChRα7. Interestingly, Figure 6. nAChRs expression levels in cortex and hippocampus at different postnatal ages. Bar plots graphically depict the mean and SEM of nAChR α7, α4, β2, α3, and β4 gene expression levels in cortex and hippocampus at different postnatal ages. Statistically significant p-values, after adjustment according to the FDR methods, are graphically depicted too.Figure 7. Graphical representation of age-related IL-1β and nAChRα7 expression levels and Aβ deposition in cortex and hippocampus. Bar plots graphically depict the mean and SEM of IL-1β and nAChRα7 gene expression levels and the percentage of Aβ deposition in cortex and hippocampus at different postnatal ages. The trend lines for the same parameters are depicted too with β coefficient ± SEM for IL-1β: 1.8 ± 1.1, for nAChRα7: − 0.1 ± 0.1, and for Aβ: 0.4 ± 0.1 in cortex, and with β coefficient ± SEM for IL-1β: 0.5 ± 1.4, for nAChRα7: − 2.2 ± 0.8, and for Aβ: 0.3 ± 0.1 in hippocampus.
this relationship between age and nAChRα7 seems to be more marked in hippocampus (β coefficient ± SEM = − 0.1 ± 0.1 and − 2.2 ± 0.8 in cortex and hippocampus, respectively).
Brain expression profile analysis of AChE and BuChE enzymes in AD (APPswe/PS1dE9) Tg
mice.
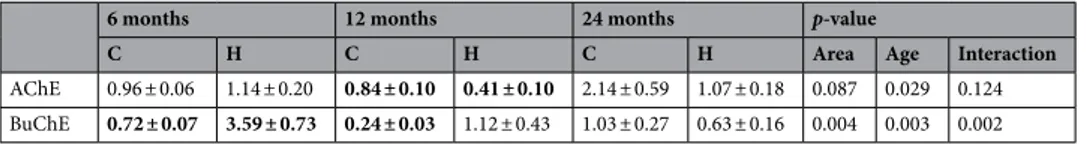
A mRNA expression analysis of AChE and BuChE demonstrated largely different time-dependent changes for the enzymes in the two brain regions studied, with respect to levels in WT mice. These data were additionally confirmed by normalizing the aged APP/PS1 (12 and 24 months) vs APP/PS1 (6 months), assumed as the calibrator. This additional analysis allowed us to exclude the influence of physiological aging in WT mice, on gene expression variation (data not shown). Whereas changes in AChE and BuChE were negligible between AD Tg and WT mice at 6 months of age in cortex, they were more substantial at 24 months. On the contrary, BuChE was increased at 6 months with respect to 24 months of age in hippocampus (Table 4).In linear mixed models adjusting for the effect of brain area and the interaction between age and areas, sta-tistically significant differences between age was detected for AChE and BuChE (p = 0.029 and p = 0.003 respec-tively) (Table 4). Moreover, in linear mixed models adjusting for the effect of age and the interaction between age and brain areas, statistically significant differences between areas was detected for BuChE (p = 0.004) and the interaction between brain area and age was statistically significant too (p = 0.002) (Table 4). This means that the time-dependent changes of BuChE gene expression levels varies within each considered area. Likewise, a statistically significant increase in AChE gene expression levels was found within the cortex, between 6 and 24 months (p = 0.028), and between 12 and 24 months (p = 0.028). A statistically significant decrease in BuChE gene expression levels was found within hippocampus, between 6 and 24 months (p < 0.001), and between 6 and 12 months (p = 0.002); within the 6 month group a significant increase of BuChE between brain areas occurs (p < 0.001) (Fig. 8).
Discussion
In humans, AD is an heterogenous condition, which in the relatively few hereditary familial cases derives from key mutations within the amyloid precursor protein (APP) and presenilin 1–2 (PSEN 1–2) genes, and from the resulting increased presence of Aβ deposition and aggregates of hyperphosphorylated tau protein. Sporadic AD (sAD) onset accounts for more than 90% of the disease cases, in which initiation and progression of the disease is associated with aging and an aberrant post-translational modification of Aβ peptide that ultimately leads to amyloid accumulation, aggregation, and neurotoxicity36,37. Aβ peptide generation and aggregation are
recognized to drive the onset of inflammation and neurodegeneration. Several transgenic mouse models have been produced to characterize gene mutations associated with the disease. Whereas none of them totally mirror Table 4. Gene expression levels (2–ΔΔCt) of cholinesterase enzymes, in different brain regions and at different postnatal ages, in AD Tg mice in comparison to age-matched WT mice. Data are reported as mean ± SEM. p-values derived from a linear mixed model with brain region as the within variable and age as the between variable. Statistically significant comparisons with respect to WT mice are shown in bold characters (p < 0.05). C cortex, H hippocampus.
6 months 12 months 24 months p-value
C H C H C H Area Age Interaction
AChE 0.96 ± 0.06 1.14 ± 0.20 0.84 ± 0.10 0.41 ± 0.10 2.14 ± 0.59 1.07 ± 0.18 0.087 0.029 0.124 BuChE 0.72 ± 0.07 3.59 ± 0.73 0.24 ± 0.03 1.12 ± 0.43 1.03 ± 0.27 0.63 ± 0.16 0.004 0.003 0.002
Figure 8. Cholinesterase enzymes expression levels in cortex and hippocampus at different postnatal ages. Bar plots graphically depict the mean and SEM of AChE and BuChE gene expression levels in cortex and hippocampus at different postnatal ages, in comparison to WT mice. Statistically significant p-values, after adjustment according to the FDR methods, are graphically depicted too.
the human AD condition, each provides insights and has specific advantages and caveats depending on how they are used. The double transgenic mouse model B6.Cg-Tg (APPswe, PSEN1dE9) 85Dbo/J strain (common name: APPswe/PS1dE9) expresses a chimeric mouse/human amyloid precursor protein (Mo/HuAPP695swe) and a mutant human presenilin 1 (PS1-dE9) and, in accordance with several previous studies38–40, was used
in this study as a model of AD. In this AD Tg murine model, an early and high formation of extracellular insoluble Aβ peptides derives from the cleavage of membrane-bound APP through the action of the β-secretase enzyme (β-site APP-cleaving transmembrane aspartic protease, BACE 1) together with the action of an impre-cise γ-secretase enzyme activity. Aβ peptides, containing 39–42 amino acid residues are thereby produced and, among these, Aβ 1–42 is found present in senile plaques41. Under physiological conditions, APP is also cleaved
by the α-secretase enzyme, producing a neurotrophic and neuroprotective soluble AβPP form42,43. In neurons,
non-amyloidogenic and amyloidogenic pathways compete physiologically, promoting a neuroprotective and neurodegenerative microenvironment44,45.
In AD, Aβ generation and inadequate clearance represents a continuous process that chronically leads to amyloid plaque formation, neuroinflammation, neuronal dysfunction and, downstream, also to tau pathology. Our described double transgenic mouse model allowed us to study time-dependent changes in key inflamma-tory and cholinergic molecules, which may derive from Aβ accumulation, considering amyloid pathology is well represented in this model, whereas neurofibrillary tangles/tau pathology do not manifest. As evident in Fig. 1, Aβ deposition occurs early within the brain of these mice, being already detectable at 6 months of age in cortex and hippocampus. Amyloid plaques in human AD brain are considered to locally stimulate an innate immune response. The persistent presence of such plaques mediates chronic inflammatory responses that are both orches-trated by and detrimental to adjacent astrocytes, microglia and neurons, and their normally synergistic and supportive interactions. Neuroinflammation, facilitated by pro-inflammatory mediators released by activated astrocytes, microglia and macrophages in the cerebral cortex and hippocampus, is hence a key feature of AD46.
Astrocytes are the most abundant cells within the CNS, and substantially contribute to the maintenance of optimal neuronal activity47. In 24 months old AD Tg mice, the results of our immunofluorescence analysis
show a reduced number of neurons that are significantly inversely correlated with GFAP and Aβ percentage, and point to astrogliosis, together with an increased Aβ plaques deposition being deleterious to adjacent neurons (Fig. 4)48. Specifically, astrogliosis was observed encircling Aβ deposits in cortex (Fig. 4A1,A4) and hippocampus
(Fig. 4B1,B4), and neuronal neuN fluorescent quantification revealed cell loss in both brain areas, over-time (Fig. 3B2–3,C2–3,D2–3) (Table 1). Evidence shows that activated astrocytes are closely associated with amyloid plaques in the cortex of human AD patients, and likely contribute to Aβ toxicity49. Astrocytosis has as a final
goal that ultimately involves Aβ internalization and its degradation50. The elevated expression and release of
pro-inflammatory cytokines, characterizing amyloidosis, can lead to chronically high levels of pro-inflammatory mediators and local generation of reactive oxygen and nitrogen species in the brain; inducing a self-propagating inflammatory cascade35,51. This can drive heightened production and aggregation of amyloid into cross-β-sheet
fibrillar deposits, and lead to neuronal death through mechanisms that are yet to be fully elucidated. Amyloi-dosis can therefore be considered as not only a cause, but also as a consequence of long-standing inflamma-tory disease52. In this scenario, gene expression analyses of IL-1β and TNFα pro-inflammatory cytokines were
performed (Table 2). IL-1 plays a key role in the pathogenesis of AD inflammation by initiating a cytokine cycle and stimulating resident immune cells53–55. In this regard, in the hippocampus and cortex of our AD mouse
model we found a tell-tale early and persistent activation of the inflammatory process. In all ages studied, the hippocampus showed the highest IL-1β expression level (Table 2). These levels can additionally be compared to those measured by our group in a prior study focused on elevated inflammatory cytokine levels in the olfactory bulb and entorhinal cortex of APPswe/PS1dE9 mice, where high levels of Aβ are also present56.
In the current study, in order to evaluate whether cortex and hippocampus mRNA levels of MCP-1 were increased, we analyzed its gene expression level and observed that MCP-1 reached its highest level at 24 months of age, in both hippocampus and cortex (Table 2), with only modest rises at 6 and 12 months. MCP-1 is a par-ticularly potent chemokine in its ability to amplify an inflammatory response and subsequent tissue reactions. It achieves this by regulating microglia migration and recruitment of astrocytes around Aβ plaques as well as to areas of neuroinflammation, as evident in our immunofluorescent images in cortex and hippocampus of our AD Tg mice. MCP-1 and other chemokines released directly by astrocytes and microglia, or indirectly by endothelial cells, can also attract monocytes and T lymphocytes from the periphery into the CNS; thereby, providing a role to counteract infection, remove debris, and initiate tissue reparative processes. In human AD as well as in our APPswe/PS1dE9 mouse model, the initially valuable inflammatory response can become chronic, due to persis-tent rising Aβ deposition as well as an imbalance in the cholinergic anti-inflammatory pathway.
The evaluation of the expression of anti-inflammatory nAChRα7, α4, and β2 showed higher levels at 6 months of age in the hippocampus of AD Tg mice than in age-matched WT mice; likely in response to the Aβ deposition and ensuing inflammatory state. nAChRs are ion ligand-gated channels and, in skeletal muscle, agonists such as ACh or nicotine can induce ion channel opening and generation of inward Na+ and Ca2+ currents to support rapid membrane depolarization and a cellular response. This occurs in the order of milliseconds to elicit neuronal excitation or skeletal muscle contraction57,58. nAChRs expressed within the CNS are involved in relatively slow
functional changes such as in regulation of memory and in addiction59,60. In the cerebral cortex, persistent nAChR
stimulation triggers pro-survival cell signaling through the phosphoinositide 3-kinase (PI3K) cascade, and leads to an up-regulation of Bcl-2, promotion of neuronal survival and neuroprotection against challenges such as Aβ toxicity61,62. Within hippocampal neurons, nAChRs induce long-term potentiation of synaptic transmission63,
and in the striatum nAChRs regulate dopamine release64. A total of 17 subunits (α1–10, β1–4, γ, δ, and ε) have
been identified in nAChRs. Among CNS nAChRs the major subtypes are represented by two forms: a hetero-oligomer of α4 and β2 subunits, (α4)2(β2)3 (α-bungarotoxin-insensitive) and homo-oligomers of α7 subunits (α7)5 (α-bungarotoxin-sensitive). CNS nAChRs are expressed in neurons and glia across various brain areas57,58,65–67.
Accumulating evidence suggests that α7 nAChR and ACh are likewise expressed in immune cells, macrophages and microglia, and possess an anti-inflammatory and immune modulating activity14,68,69. Activated α7 nAChR
binds directly to JAK2 and triggers the JAK2/STAT3 pathway interfering with the activation of TLR-induced NF-κB, which is responsible for pro-inflammatory cytokine transcription70,71. nAChR α4 and β2 subunits can,
similarly, be considered to be anti-inflammatory, because their decreased expression has been associated with cognitive impairment in a prior study on brain ischemia in rats72. In that particular study, nicotine
administra-tion resulted in higher mRNA expression of α4β2 nAChRs and a reduced expression of pro-inflammatory TNFα, IL-1β, IL-6. In turn, a reduced mRNA expression of α4β2 nAChRs was associated with elevated expression of inflammatory factors72.
In our study, we observed that the number of astrocytes and the expression of the α7 nAChRs in the hip-pocampus, were early increased (at 6 months), and time-dependently decreased (over 12 and 24 months) (Fig. 7). This potentially indicates a homeostatic neuroprotective role against Aβ toxicity, in accord with its regionally-dependent expression pattern and with the ability of Aβ to activate or inhibit the α7 receptor73,74. Akaike et al.
reported an involvement of α7 nAChRs in the metabolism of Aβ and, thereby, further associated its potential involvement with the amyloid cascade58. In line with an elevated α7 nAChR expression at 6 months, we found
increased levels of nAChRα4 and β2 in AD Tg mouse hippocampus that followed the same timeline. Consid-ering the anti-inflammatory role of nAChR α7, α4, and β2 in the cholinergic anti-inflammatory pathway, we speculate that their elevated expression at 6 months might be an attempt to mitigate the already established pro-inflammatory profile and Aβ toxicity in the brain of our AD Tg mice75. In the face of continuous and unrelenting
accumulating Aβ and increased inflammatory cyto-chemokines, lower expression of nAChR α7, α4, and β2 in cortex, with respect to age-matched WT mice, and the time-dependent reduction of these subunits in hippocam-pus, highlight the impaired expression of anti-inflammatory cholinergic markers, as is also evident in olfactory bulb and entorhinal cortex in our prior study56. Lykhmus et al., observed decreased α7 nAChR subunit, both
mRNA and protein, and an increased expression of α3 and β4 subunits in mouse brain after LPS-induced neu-roinflammation. Moreover, nicotine administration (3 day treatment) up-regulated both α7 and α4β2 nAChRs, and did not influence α3β4 levels76. A down-regulation of α7 nAChRs was accompanied by an increase of α3β4
nAChRs, also in α7-/- mice or in mice chronically treated with LPS77,78. Our results demonstrate a significant
sustained expression of nAChR α3 and β4 in cortex and hippocampus at 6 months. The expression of nAChR α3 and β4 subunits always remained higher than that measured in the WT, in both cortex and hippocampus. In contrast, the expression of nAChR α7, α4, and β2 was found lower than levels determined in the age-matched WT, in hippocampus. On combining the results of reported studies and our data, we suggest that chronic Aβ 1–42 deposition may modulate nAChR subtypes expression, favoring α3β4 subunits. Thus, our studies together with others suggest that not only does Aβ 1–42 induce local immune cell activation and neuroinflammation, but it also seems able to “modulate” the molecular components of the brain’s cholinergic anti-inflammatory pathway. Whether or not α3 β4 nAChRs have a pro- or anti-inflammatory role after nicotine or ACh stimulation remains a matter of speculation, as these specific receptor subtypes need to be more deeply studied.
Important regulators of cholinergic signaling and of the cholinergic anti-inflammatory pathway are the cho-linesterase enzymes, AChE and BuChE, in relation to their hydrolyzing activity of ACh. AChE levels have been reported to decrease during inflammation; thereby, increasing ACh availability in order to stimulate the cholin-ergic anti-inflammatory pathway79. ACh has been shown to attenuate the release of pro-inflammatory cytokines,
such as IL-1 or TNFα, by peritoneal monocytes and macrophages in response to LPS, by binding to and activating α7 nAChRs80. The anti-inflammatory role of ACh and the cholinergic anti-inflammatory pathway has also been
characterized in other tissues, including peripheral immune cells that, likewise, express the α7 receptor56,81. In this
light, the key roles of cholinesterase activity in the cholinergic anti-inflammatory pathway are likely important in neurodegenerative disorders and AD, and warrant characterization. In our AD Tg mouse model, the mRNA expression analysis of AChE and BuChE showed different expression trends in relation to the different brain regions and postnatal ages evaluated. Both AChE and BuChE were lower at 6 months with respect to 24 months of age in the cortex but, in contrast, they were early increased at 6 months and then declined at 24 months of age in hippocampus. The time-dependent reduction of neurons and the increase of Aβ deposits in hippocampus, in accord with the over-time imbalance in the cholinergic system as well as inflammatory mediators, suggest that hippocampus may be earlier involved in AD onset. In this scenario, Aβ deposits in hippocampus may induce, in addition to their other toxic actions, an early increased cholinesterase expression that contributes to the elevated expression of pro-inflammatory cytokines as a consequence of lower ACh availability. A progressive downregulation of cholinergic markers has been consistently reported in AD, including esterases82. Notably, our
study focused on mRNA expression levels, and hence cannot be extrapolated to protein levels or to enzymatic hydrolytic activity in relation to AChE or BuChE, let alone identify which molecular form such enzymes may preferentially exist as; all of which provide interesting avenues for further research. Our results, nevertheless, suggest that, in the AD Tg (APPswe/PS1dE9) mouse model, there is a time-related crosstalk between Aβ and differences in the gene expression of the cholinesterase enzymes, in much the same manners as discussed for pro-inflammatory cytokines and nAChRs. A better understanding of Aβ/α7 nAChR interactions, and of other less studied nAChR subunits (such as α4, β2, α3 and β4), may support a deeper understanding of the underlying neurodegenerative pathology in AD.
Materials and methods
Transgenic animals.
The double transgenic mouse model B6.Cg-Tg (APPswe, PSEN1dE9) 85Dbo/J strain (common name APPswe/PS1dE9) that expresses a chimeric mouse/human amyloid precursor protein (Mo/ HuAPP695swe) and a mutant human presenilin 1(PS1-dE9), as genotyped by PCR for APP and PSEN1 genes following the protocol described by Jankowski 83, was used as a model of AD in our study. Littermates,Wild-type C57BL/6 (WT) animals, were maintained under the same conditions, and used as a control group. For both groups of APPswe/PS1dE9 and WT mice, only littermates males were used in our study as gender differences in amyloid expression and disease progression have been noted in the literature84. Mice were bred and housed
in ventilated racks, in groups of 5 mice under a 12 h day/night cycle with a half-hour transition at sunrise and sunset, 50% HR and ad libitum food and water (irradiated global diet 2918 Harlan and water autoclaved), at the Cajal Institute Animal House Facility. Experimental procedures were conducted according to the Council of Europe (2010/63/UE) and Spanish guidelines, and were approved by the Ethical Committee of CSIC, Bioethi-cal Committee at the Animals Research Spanish Council (CSIC) and the loBioethi-cal authorities of the Community of Madrid. During the experiments and the analysis, there were no exclusions of animals or data points. Groups of AD Tg and WT mice were deeply anesthetized with pentobarbital (30–50 mg/kg) and euthanized at 6, 12 and 24 months of age. A total of 21 APPswe/PS1dE9 mice were evaluated in the current study; specifically, 6- and 24-month of age groups contained 8 mice each, and 5 mice in the 12-month age group. A total of 24 WT mice were euthanized, 8 mice for each group of ages. For gene expression analysis, brains were removed and cerebral cortex (C), and hippocampus (H) were dissected on wet ice. The samples were stored in RNAlater at 4 °C, for no more than two weeks; representing a time necessary to organize the workflow in the laboratory. Subsequently, we proceeded with the extraction of the RNA from the tissues and their conservation at − 80 °C. To perform immunofluorescence studies, after deep anesthesia, a total of 21 AD Tg male mice and 21 WT male mice (7 mice for each age group) were transcardially perfused with paraformaldehyde 4% (PF), pH 7.4. Brains were then post-fixed in PF overnight at 4 ºC.
Immunohistochemistry.
The immunohistochemistry analyses were performed as previously described by Reale et al.56 After 4 ºC overnight fixation, brains were removed from skulls and sliced as 50 μm coronalsec-tions by vibratome. The slices were transferred to phosphate buffer saline (PBS) containing 0.1% Triton X-100 (PBS-T) for 5 min and then blocked for 60 min in 5% NGS in PBS-T. Sections were incubated in the follow-ing primary antibodies: β-amyloid antibody (1:250; Cell Signalfollow-ing), mouse anti-GFAP (1:1000; Millipore) and mouse anti-neuN (1:1000; Chemicon) in the same blocking solution, for 48 h at 4 ºC. After further rinsing, the sections were incubated for 2 h with Alexa Fluor 488 and Alexa Fluor 568 conjugated goat anti-rabbit, and goat anti-mouse (1:1000; Invitrogen, Carlsbad, CA, USA) antibodies. Finally, sections were rinsed, counterstained with bismencimide (Hoechst 33342, 1:50,000), and mounted onto slides in Mowiol. Images were obtained on a Leica TCS-SP5 confocal microscope, acquiring two or three different channels simultaneously.
The Image Unit of the Cajal Institute CSIC previously developed an ImageJ based macro (2.0.0-rc-19/1.49 m; Java 1.6.0_24) and we used this to quantify the number of Aβ-deposits (larger than 3 µm) in a selected area, and calculate the percentage of the area occupied by Aβ-deposits, within our confocal images. The area used to measure Aβ-deposits, in each of the slices, was the same area used to calculate the percentage density of astrocytes or neurons. The slices and the area used to perform the measurements were similar across all age group analyses. Three different 20X confocal images for each of the selected areas (hippocampus and cortex) were evaluated.
RNA extraction, reverse transcription, and Real-Time PCR (qPCR).
Brain tissues were removed from RNAlater and total RNA from the AD Tg and WT mouse brain was isolated using the QIAzol lysis reagent (Qiagen, Hilden, Germany), in accord with the manufacturer’s recommendations.As previously described by Reale et al.56, the concentration of total RNA was assessed with NanoDrop 2000
UV–Vis Spectrophotometer (Thermo Scientific, Waltham, MA, USA). Thereafter, 1 µg of total RNA was tran-scribed to cDNA using the QuantiTec Revers Transcription Kit with integrated removal of genomic DNA con-tamination (Qiagen, Hilden, Germany), according to the manufacturer’s instructions.
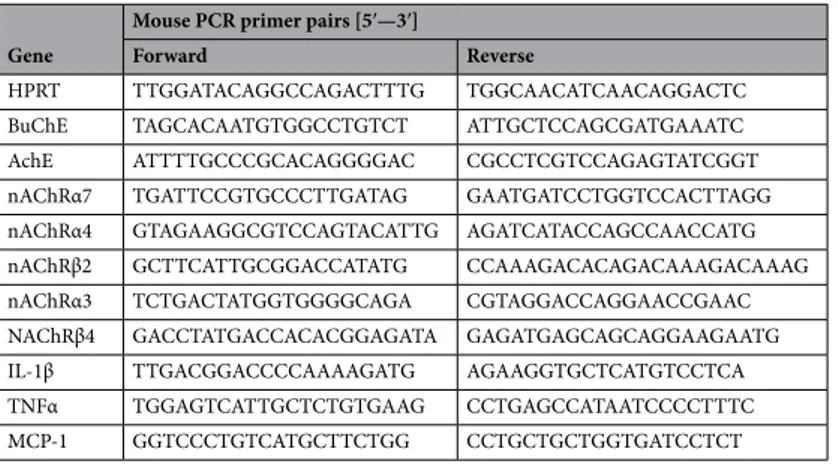
Next, Real-Time PCR assays were performed in triplicate using GoTaq qPCR Master Mix (Promega, Madi-son, USA), and specific mouse primer pairs were used to evaluate the expression of proinflammatory cytokines, nAChRs, cholinesterase enzymes (AChE and BuChE) and APP.
Table 5. Primer pair sequences used in the study. Gene
Mouse PCR primer pairs [5′—3′]
Forward Reverse
HPRT TTG GAT ACA GGC CAG ACT TTG TGG CAA CAT CAA CAG GAC TC BuChE TAG CAC AAT GTG GCC TGT CT ATT GCT CCA GCG ATG AAA TC AchE ATT TTG CCC GCA CAG GGG AC CGC CTC GTC CAG AGT ATC GGT nAChRα7 TGA TTC CGT GCC CTT GAT AG GAA TGA TCC TGG TCC ACT TAGG nAChRα4 GTA GAA GGC GTC CAG TAC ATTG AGA TCA TAC CAG CCA ACC ATG nAChRβ2 GCT TCA TTG CGG ACC ATA TG CCA AAG ACA CAG ACA AAG ACA AAG nAChRα3 TCT GAC TAT GGT GGG GCA GA CGT AGG ACC AGG AAC CGA AC NAChRβ4 GAC CTA TGA CCA CAC GGA GATA GAG ATG AGC AGC AGG AAG AATG IL-1β TTG ACG GAC CCC AAA AGA TG AGA AGG TGC TCA TGT CCT CA TNFα TGG AGT CAT TGC TCT GTG AAG CCT GAG CCA TAA TCC CCT TTC MCP-1 GGT CCC TGT CAT GCT TCT GG CCT GCT GCT GGT GAT CCT CT
Relative expression of each gene was normalized by HPRT gene using the ΔCt method, where ΔCt = Ct (BuChE, AChE, nAChRα7, nAChRα4, nAChRβ2, nAChRβ4, nAChRα3, IL-1β, TNFα, MCP-1)—Ct (HPRT). Primer pair sequences used in the study are reported in Table 5. Relative fold changes in gene expression were determined by the 2−ΔΔCt method, where ΔΔCt = ΔCt Tg mice—ΔCt WT mice. cDNAs of AD Tg mice were prepared in parallel with the cDNAs of WT mice (Table S1).
Statistical methods.
The primary aim of our study was to test differences in terms of Aβ deposits at differ-ent timepoint. To verify the sample size adequacy was verified according to the grade of freedom of our ANOVA test. We considered our analysis powered enough if the grade of freedom, estimated as “E = Total number of animals – Total number of groups” lied between 10 and 20, as previously described85. The latter resulted as“E = 21–3 = 18” for Tg mice.
Values of continuous variables, such as 2–ΔΔCt, were tested for normal distribution with the Shapiro–Wilk’s test and are reported as mean and standard error of mean (SEM) values. The ‘fold change’ of gene expression levels was calculated with the 2−ΔΔCt method86. The hypothesis that ‘the fold change between AD Tg and WT mice was
equal to 1’ was tested with the Student’s t-test for unpaired data.
A linear mixed model, accounting for the random effect of each mouse, was fitted to test the association of gene expression with different brain areas and mouse age (6, 12 or 24 months), and the interaction between con-sidered brain areas and mouse age. When area and/or age were found to be predictors of gene expression, post-hoc analyses were performed to evaluate differences in gene expressions between each area at every considered age. The p-values deriving from multiple hypotheses testing were adjusted with the false discovery rate (FDR) method. A Spearman’s correlation test was also carried out to study the relationship between immunochemistry findings. Bar plots graphically depicted the mean fold change of gene expression levels and its SEM, at each age within the considered areas. In all statistical tests, the threshold of statistical significance was assumed as p ≤ 0.05. Data were analyzed within R environment (version 3.5.3, R project, Vienna, Austria).
Data availability
The datasets analysed during the current study are available from the corresponding author on reasonable request. Received: 10 January 2020; Accepted: 21 April 2021
References
1. Dineley, K. T. Beta-amyloid peptide–nicotinic acetylcholine receptor interaction: the two faces of health and disease. Front. Biosci.
J. Virtual Libr. 12, 5030–5038 (2007).
2. Hardy, J. & Allsop, D. Amyloid deposition as the central event in the aetiology of Alzheimer’s disease. Trends Pharmacol. Sci. 12, 383–388 (1991).
3. Hardy, J. A. & Higgins, G. A. Alzheimer’s disease: the amyloid cascade hypothesis. Science 256, 184–185 (1992).
4. Maia, M. A. & Sousa, E. BACE-1 and γ-secretase as therapeutic targets for Alzheimer’s disease. Pharm. Basel Switz. 12 (2019). 5. Puzzo, D., Gulisano, W., Arancio, O. & Palmeri, A. The keystone of Alzheimer pathogenesis might be sought in Aβ physiology.
Neuroscience 307, 26–36 (2015).
6. Bartus, R. T., Dean, R. L., Beer, B. & Lippa, A. S. The cholinergic hypothesis of geriatric memory dysfunction. Science 217, 408–414 (1982).
7. Whitehouse, P. J., Struble, R. G., Clark, A. W. & Price, D. L. Alzheimer disease: Plaques, tangles, and the basal forebrain. Ann.
Neurol. 12, 494 (1982).
8. Banerjee, C. et al. Cellular expression of alpha7 nicotinic acetylcholine receptor protein in the temporal cortex in Alzheimer’s and Parkinson’s disease—A stereological approach. Neurobiol. Dis. 7, 666–672 (2000).
9. Contestabile, A. The history of the cholinergic hypothesis. Behav. Brain Res. 221, 334–340 (2011).
10. Hampel, H. et al. The cholinergic system in the pathophysiology and treatment of Alzheimer’s disease. Brain 141, 1917–1933 (2018).
11. de Jonge, W. J. & Ulloa, L. The alpha7 nicotinic acetylcholine receptor as a pharmacological target for inflammation. Br. J.
Phar-macol. 151, 915–929 (2007).
12. Jurado-Coronel, J. C. et al. Targeting the nicotinic acetylcholine receptors (nAChRs) in astrocytes as a potential therapeutic target in Parkinson’s disease. Curr. Pharm. Des. 22, 1305–1311 (2016).
13. Fujii, T. et al. Expression and function of the cholinergic system in immune cells. Front. Immunol. 8, 1085 (2017).
14. Morioka, N. et al. Stimulation of α7 nicotinic acetylcholine receptor regulates glutamate transporter GLAST via basic fibroblast growth factor production in cultured cortical microglia. Brain Res. 1625, 111–120 (2015).
15. Wang, H. Y. et al. beta-Amyloid(1–42) binds to alpha7 nicotinic acetylcholine receptor with high affinity. Implications for Alzhei-mer’s disease pathology. J. Biol. Chem. 275, 5626–5632 (2000).
16. Parri, H. R., Hernandez, C. M. & Dineley, K. T. Research update: Alpha7 nicotinic acetylcholine receptor mechanisms in Alzheimer’s disease. Biochem. Pharmacol. 82, 931–942 (2011).
17. Pavlov, V. A. & Tracey, K. J. The cholinergic anti-inflammatory pathway. Brain. Behav. Immun. 19, 493–499 (2005).
18. Czura, C. J., Friedman, S. G. & Tracey, K. J. Neural inhibition of inflammation: The cholinergic anti-inflammatory pathway. J.
Endotoxin Res. 9, 409–413 (2003).
19. Nizri, E. et al. Activation of the cholinergic anti-inflammatory system by nicotine attenuates neuroinflammation via suppression of Th1 and Th17 responses. J. Immunol. Baltim. Md 1950(183), 6681–6688 (2009).
20. Rosas-Ballina, M. et al. Acetylcholine-synthesizing T cells relay neural signals in a vagus nerve circuit. Science 334, 98–101 (2011). 21. Kawashima, K., Fujii, T., Moriwaki, Y. & Misawa, H. Critical roles of acetylcholine and the muscarinic and nicotinic acetylcholine
receptors in the regulation of immune function. Life Sci. 91, 1027–1032 (2012).
22. Kawashima, K., Fujii, T., Moriwaki, Y., Misawa, H. & Horiguchi, K. Non-neuronal cholinergic system in regulation of immune function with a focus on α7 nAChRs. Int. Immunopharmacol. 29, 127–134 (2015).
23. Nizri, E. & Brenner, T. Modulation of inflammatory pathways by the immune cholinergic system. Amino Acids 45, 73–85 (2013). 24. Reale, M. et al. Butyrylcholinesterase and acetylcholinesterase polymorphisms in multiple sclerosis patients: Implication in
25. Mesulam, M. M., Geula, C. & Morán, M. A. Anatomy of cholinesterase inhibition in Alzheimer’s disease: Effect of physostigmine and tetrahydroaminoacridine on plaques and tangles. Ann. Neurol. 22, 683–691 (1987).
26. Ulrich, J., Meier-Ruge, W., Probst, A., Meier, E. & Ipsen, S. Senile plaques: Staining for acetylcholinesterase and A4 protein: A comparative study in the hippocampus and entorhinal cortex. Acta Neuropathol. (Berl.) 80, 624–628 (1990).
27. Darvesh, S., Hopkins, D. A. & Geula, C. Neurobiology of butyrylcholinesterase. Nat. Rev. Neurosci. 4, 131–138 (2003). 28. Ballard, C. G., Greig, N. H., Guillozet-Bongaarts, A. L., Enz, A. & Darvesh, S. Cholinesterases: Roles in the brain during health
and disease. Curr. Alzheimer Res. 2, 307–318 (2005).
29. Diamant, S. et al. Butyrylcholinesterase attenuates amyloid fibril formation in vitro. Proc. Natl. Acad. Sci. USA. 103, 8628–8633 (2006).
30. Macdonald, I. R. et al. Quantification of butyrylcholinesterase activity as a sensitive and specific biomarker of Alzheimer’s disease.
J. Alzheimers Dis. JAD 58, 491–505 (2017).
31. Silveyra, M.-X. et al. Altered expression of brain acetylcholinesterase in FTDP-17 human tau transgenic mice. Neurobiol. Aging
33(624), e23-34 (2012).
32. Talesa, V. N. Acetylcholinesterase in Alzheimer’s disease. Mech. Ageing Dev. 122, 1961–1969 (2001).
33. Herholz, K., Weisenbach, S. & Kalbe, E. Deficits of the cholinergic system in early AD. Neuropsychologia 46, 1642–1647 (2008). 34. Heppner, F. L., Ransohoff, R. M. & Becher, B. Immune attack: The role of inflammation in Alzheimer disease. Nat. Rev. Neurosci.
16, 358–372 (2015).
35. Heneka, M. T. et al. Neuroinflammation in Alzheimer’s disease. Lancet Neurol. 14, 388–405 (2015).
36. Barykin, E. P., Mitkevich, V. A., Kozin, S. A. & Makarov, A. A. Amyloid β modification: A key to the sporadic Alzheimer’s disease?.
Front. Genet. 8, 58 (2017).
37. Dorszewska, J., Prendecki, M., Oczkowska, A., Dezor, M. & Kozubski, W. Molecular basis of familial and sporadic Alzheimer’s disease. Curr. Alzheimer Res. 13, 952–963 (2016).
38. Huang, H. et al. Characterization of AD-like phenotype in aged APPSwe/PS1dE9 mice. Age 38, 303–322 (2016).
39. Games, D. et al. Alzheimer-type neuropathology in transgenic mice overexpressing V717F beta-amyloid precursor protein. Nature
373, 523–527 (1995).
40. Games, D., Buttini, M., Kobayashi, D., Schenk, D. & Seubert, P. Mice as models: transgenic approaches and Alzheimer’s disease.
J. Alzheimers Dis. JAD 9, 133–149 (2006).
41. Iwatsubo, T. et al. Visualization of A beta 42(43) and A beta 40 in senile plaques with end-specific A beta monoclonals: Evidence that an initially deposited species is A beta 42(43). Neuron 13, 45–53 (1994).
42. Thornton, E., Vink, R., Blumbergs, P. C. & Van Den Heuvel, C. Soluble amyloid precursor protein alpha reduces neuronal injury and improves functional outcome following diffuse traumatic brain injury in rats. Brain Res. 1094, 38–46 (2006).
43. Wang, Y.-Q., Qu, D.-H. & Wang, K. Therapeutic approaches to Alzheimer’s disease through stimulating of non-amyloidogenic processing of amyloid precursor protein. Eur. Rev. Med. Pharmacol. Sci. 20, 2389–2403 (2016).
44. Tan, J. Z. A. & Gleeson, P. A. The role of membrane trafficking in the processing of amyloid precursor protein and production of amyloid peptides in Alzheimer’s disease. Biochim. Biophys. Acta Biomembr. 1861, 697–712 (2019).
45. Vetrivel, K. S. & Thinakaran, G. Amyloidogenic processing of beta-amyloid precursor protein in intracellular compartments.
Neurology 66, S69-73 (2006).
46. Fakhoury, M. Microglia and astrocytes in Alzheimer’s disease: Implications for therapy. Curr. Neuropharmacol. 16, 508–518 (2018). 47. Allan, S. M. & Rothwell, N. J. Cytokines and acute neurodegeneration. Nat. Rev. Neurosci. 2, 734–744 (2001).
48. Habib, N. et al. Disease-associated astrocytes in Alzheimer’s disease and aging. Nat. Neurosci. 23, 701–706 (2020).
49. Maragakis, N. J. & Rothstein, J. D. Mechanisms of disease: Astrocytes in neurodegenerative disease. Nat. Clin. Pract. Neurol. 2, 679–689 (2006).
50. Pihlaja, R. et al. Transplanted astrocytes internalize deposited beta-amyloid peptides in a transgenic mouse model of Alzheimer’s disease. Glia 56, 154–163 (2008).
51. Rubio-Perez, J. M. & Morillas-Ruiz, J. M. A review: Inflammatory process in Alzheimer’s disease, role of cytokines. Sci. World J.
2012, 756357 (2012).
52. Westermark, G. T., Fändrich, M. & Westermark, P. AA amyloidosis: Pathogenesis and targeted therapy. Annu. Rev. Pathol. 10, 321–344 (2015).
53. Akiyama, H. et al. Inflammation and Alzheimer’s disease. Neurobiol. Aging 21, 383–421 (2000).
54. Goldgaber, D. et al. Interleukin 1 regulates synthesis of amyloid beta-protein precursor mRNA in human endothelial cells. Proc.
Natl. Acad. Sci. USA. 86, 7606–7610 (1989).
55. Sokolova, A. et al. Monocyte chemoattractant protein-1 plays a dominant role in the chronic inflammation observed in Alzheimer’s disease. Brain Pathol. Zurich Switz. 19, 392–398 (2009).
56. Reale, M. et al. Expression profiling of cytokine, cholinergic markers, and amyloid-β deposition in the APPSWE/PS1dE9 mouse model of Alzheimer’s disease pathology. J. Alzheimers Dis. JAD 62, 467–476 (2018).
57. Albuquerque, E. X., Pereira, E. F. R., Alkondon, M. & Rogers, S. W. Mammalian nicotinic acetylcholine receptors: From structure to function. Physiol. Rev. 89, 73–120 (2009).
58. Akaike, A. & Izumi, Y. Overview. In Nicotinic Acetylcholine Receptor Signaling in Neuroprotection (eds. Akaike, A., Shimohama, S. & Misu, Y.) (Springer, 2018).
59. Nees, F. The nicotinic cholinergic system function in the human brain. Neuropharmacology 96, 289–301 (2015).
60. Molas, S., DeGroot, S. R., Zhao-Shea, R. & Tapper, A. R. Anxiety and nicotine dependence: Emerging role of the Habenulo-interpeduncular axis. Trends Pharmacol. Sci. 38, 169–180 (2017).
61. Kihara, T. et al. Alpha 7 nicotinic receptor transduces signals to phosphatidylinositol 3-kinase to block A beta-amyloid-induced neurotoxicity. J. Biol. Chem. 276, 13541–13546 (2001).
62. Dajas-Bailador, F. & Wonnacott, S. Nicotinic acetylcholine receptors and the regulation of neuronal signalling. Trends Pharmacol.
Sci. 25, 317–324 (2004).
63. Kenney, J. W. & Gould, T. J. Modulation of hippocampus-dependent learning and synaptic plasticity by nicotine. Mol. Neurobiol.
38, 101–121 (2008).
64. Exley, R. & Cragg, S. J. Presynaptic nicotinic receptors: A dynamic and diverse cholinergic filter of striatal dopamine neurotrans-mission. Br. J. Pharmacol. 153(Suppl 1), S283-297 (2008).
65. Dani, J. A. Neuronal nicotinic acetylcholine receptor structure and function and response to nicotine. Int. Rev. Neurobiol. 124, 3–19 (2015).
66. Zoli, M., Pistillo, F. & Gotti, C. Diversity of native nicotinic receptor subtypes in mammalian brain. Neuropharmacology 96, 302–311 (2015).
67. Scholze, P. et al. α4β2 nicotinic acetylcholine receptors in the early postnatal mouse superior cervical ganglion. Dev. Neurobiol.
71, 390–399 (2011).
68. Egea, J. et al. Anti-inflammatory role of microglial alpha7 nAChRs and its role in neuroprotection. Biochem. Pharmacol. 97, 463–472 (2015).
69. Reale, M. et al. Nicotinic receptor activation negatively modulates pro-inflammatory cytokine production in multiple sclerosis patients. Int. Immunopharmacol. 29, 152–157 (2015).
70. Cui, W.-Y. & Li, M. D. Nicotinic modulation of innate immune pathways via α7 nicotinic acetylcholine receptor. J. Neuroimmune
Pharmacol. Off. J. Soc. NeuroImmune Pharmacol. 5, 479–488 (2010).
71. Kawamata, J. & Shimohama, S. Stimulating nicotinic receptors trigger multiple pathways attenuating cytotoxicity in models of Alzheimer’s and Parkinson’s diseases. J. Alzheimers Dis. JAD 24(Suppl 2), 95–109 (2011).
72. Han, T. et al. Nicotine induced neurocognitive protection and anti-inflammation effect by activating α4β2 nAChRs in ischemic rats. Nicotine Tob. Res. Off. J. Soc. Res. Nicotine Tob. https:// doi. org/ 10. 1093/ ntr/ ntz126 (2019).
73. Fabiani, C. & Antollini, S. S. Alzheimer’s disease as a membrane disorder: Spatial cross-talk among beta-amyloid peptides, nicotinic acetylcholine receptors and lipid rafts. Front. Cell. Neurosci. 13, 309 (2019).
74. Dziewczapolski, G., Glogowski, C. M., Masliah, E. & Heinemann, S. F. Deletion of the alpha 7 nicotinic acetylcholine receptor gene improves cognitive deficits and synaptic pathology in a mouse model of Alzheimer’s disease. J. Neurosci. Off. J. Soc. Neurosci.
29, 8805–8815 (2009).
75. Hernandez, C. M., Kayed, R., Zheng, H., Sweatt, J. D. & Dineley, K. T. Loss of alpha7 nicotinic receptors enhances beta-amyloid oligomer accumulation, exacerbating early-stage cognitive decline and septohippocampal pathology in a mouse model of Alzhei-mer’s disease. J. Neurosci. Off. J. Soc. Neurosci. 30, 2442–2453 (2010).
76. Lykhmus, O. et al. Molecular mechanisms regulating LPS-induced inflammation in the brain. Front. Mol. Neurosci. 9, 19 (2016). 77. Lykhmus, O. et al. Antibodies against extracellular domains of α4 and α7 subunits alter the levels of nicotinic receptors in the
mouse brain and affect memory: Possible relevance to Alzheimer’s pathology. J. Alzheimers Dis. JAD 24, 693–704 (2011). 78. Lykhmus, O. et al. α7 Nicotinic acetylcholine receptor-specific antibody induces inflammation and amyloid β42 accumulation in
the mouse brain to impair memory. PLoS ONE 10, e0122706 (2015).
79. Soreq, H. Checks and balances on cholinergic signaling in brain and body function. Trends Neurosci. 38, 448–458 (2015). 80. Borovikova, L. V. et al. Vagus nerve stimulation attenuates the systemic inflammatory response to endotoxin. Nature 405, 458–462
(2000).
81. Di Bari, M. et al. Dysregulated homeostasis of acetylcholine levels in immune cells of RR-multiple sclerosis patients. Int. J. Mol.
Sci. 17 (2016).
82. Mufson, E. J., Counts, S. E., Perez, S. E. & Ginsberg, S. D. Cholinergic system during the progression of Alzheimer’s disease: Therapeutic implications. Expert Rev. Neurother. 8, 1703–1718 (2008).
83. Jankowsky, J. L. et al. Co-expression of multiple transgenes in mouse CNS: A comparison of strategies. Biomol. Eng. 17, 157–165 (2001).
84. Wang, J., Tanila, H., Puoliväli, J., Kadish, I. & van Groen, T. Gender differences in the amount and deposition of amyloidbeta in APPswe and PS1 double transgenic mice. Neurobiol. Dis. 14, 318–327 (2003).
85. Charan, J. & Kantharia, N. D. How to calculate sample size in animal studies?. J. Pharmacol. Pharmacother. 4, 303–306 (2013). 86. Pfaffl, M. W. A new mathematical model for relative quantification in real-time RT–PCR. Nucleic Acids Res. 29, e45 (2001).
Author contributions
C.D.A. was aware of the Tg and WT mice groups allocation for molecular analysis and performed RNA extrac-tion, reverse transcripextrac-tion, and Real-Time PCR, provided results interpretation and wrote the initial draft manuscript; E.C. performed the experiments (RNA extraction, reverse transcription, and Real-Time PCR) and contributed to results interpretation; N.S. provided the animal model, was aware of the Tg and WT mice groups allocation, and performed immunohistochemistry assays and their outcome assessment; M.M. and M.D.N. performed the statistical analysis of obtained data, N.G. undertook manuscript writing and editing; M.R. con-ceived the project, provided results interpretation and manuscript writing. All authors revised and accepted the manuscript.
Competing interests
The authors declare no competing interests.
Additional information
Supplementary Information The online version contains supplementary material available at https:// doi. org/ 10. 1038/ s41598- 021- 89139-x.
Correspondence and requests for materials should be addressed to R.M. Reprints and permissions information is available at www.nature.com/reprints.
Publisher’s note Springer Nature remains neutral with regard to jurisdictional claims in published maps and institutional affiliations.
Open Access This article is licensed under a Creative Commons Attribution 4.0 International License, which permits use, sharing, adaptation, distribution and reproduction in any medium or format, as long as you give appropriate credit to the original author(s) and the source, provide a link to the Creative Commons licence, and indicate if changes were made. The images or other third party material in this article are included in the article’s Creative Commons licence, unless indicated otherwise in a credit line to the material. If material is not included in the article’s Creative Commons licence and your intended use is not permitted by statutory regulation or exceeds the permitted use, you will need to obtain permission directly from the copyright holder. To view a copy of this licence, visit http:// creat iveco mmons. org/ licen ses/ by/4. 0/.