JHEP04(2020)192
Published for SISSA by SpringerReceived: November 17, 2019 Accepted: March 24, 2020 Published: April 29, 2020
Underlying event properties in pp collisions at
√
s = 13 TeV
The ALICE collaboration
E-mail: [email protected]
Abstract: This article reports measurements characterizing the Underlying Event (UE)
associated with hard scatterings at midrapidity (|η| < 0.8) in pp collisions at√s = 13 TeV.
The hard scatterings are identified by the leading particle, the charged particle with the
highest transverse momentum (pleadingT ) in the event. Charged-particle number-densities
and summed transverse-momentum densities are measured in different azimuthal regions defined with respect to the leading particle direction: Toward, Transverse, and Away. The Toward and Away regions contain the fragmentation products of the hard scatterings in addition to the UE contribution, whereas particles in the Transverse region are expected to
originate predominantly from the UE. The study is performed as a function of pleadingT with
three different pT thresholds for the associated particles, ptrackT > 0.15, 0.5, and 1.0 GeV/c.
The charged-particle density in the Transverse region rises steeply for low values of pleadingT
and reaches a plateau. The results confirm the trend that the charged-particle density in
the Transverse region shows a stronger increase with√s than the inclusive charged-particle
density at midrapidity. The UE activity is increased by approximately 20% when going
from 7 TeV to 13 TeV pp collisions. The plateau in the Transverse region (5 < pleadingT <
40 GeV/c) is further characterized by the probability distribution of its charged-particle
multiplicity normalized to its average value (relative transverse activity, RT) and the mean
transverse momentum as a function of RT. Experimental results are compared to model
calculations using PYTHIA 8 and EPOS LHC. The overall agreement between models and data is within 30%. These measurements provide new insights on the interplay between hard scatterings and the associated UE in pp collisions.
Keywords: Hadron-Hadron scattering (experiments)
JHEP04(2020)192
Contents
1 Introduction 1
2 Underlying event observables 3
3 Monte Carlo models 5
4 Experimental setup 6 5 Analysis procedure 7 5.1 Event selection 7 5.2 Track selection 7 5.3 Corrections 8 5.4 Systematic uncertainties 10
6 Results and discussion 13
6.1 Charged-particle number density Nch andP pT distributions 13
6.2 Relative transverse activity classifier RT distributions 18
7 Conclusions 20
A Number density Nch and P pT distributions with ptrackT > 0.5
and 1.0 GeV/c 22
The ALICE collaboration 28
1 Introduction
In proton-proton (pp) collisions, particles originating from partonic scatterings with large
4-momentum transfer Q compared to the Quantum Chromodynamics (QCD) scale ΛQCD,
hard processes, are accompanied by additional, predominantly low transverse momentum
(pT), particles from the proton break-up (beam remnants) and possibly further scatterings,
termed Multiple Parton Interactions (MPI) [1]. This associated particle production
rep-resents an important background to most observables at hadron colliders and its detailed understanding and modeling with Monte Carlo (MC) generators is crucial for precision measurements and for connecting experimental observables to theory. The empirical mod-els for the description of the non-perturbative aspects in a high-energy scattering event evolution do not allow to clearly separate particles originating from hard processes and the associated event activity event-by-event. In order to enable experimental studies and model comparisons one commonly separates the kinematic region containing the direct fragmen-tation products of the partons produced in the hardest scattering from the remaining part,
JHEP04(2020)192
generally referred to as the Underlying Event (UE). The UE also contains particles from initial- and final-state radiation related to the hard interaction.
The first study of this kind was performed by the UA1 experiment at CERN’s
proton-antiproton (Sp¯pS) collider by measuring the transverse energy density outside the leading
jet cone [2–4], the so-called jet pedestal region. In the method introduced by CDF [5]
and used in the present analysis, one identifies the leading jet, or any other leading object in the event, and measures particle production in the azimuthal region orthogonal to the direction of this leading object, the Transverse region. Based on this method, several UE
studies at the Tevatron [5–8] and at the LHC [9–13], at various center-of-mass energies
(√s), have been published. These also include UE measurements in Drell-Yan [14] and
Z-boson [15–17] events performed by CMS and ATLAS.
A common characteristic of UE measurements at all collision energies is that the
par-ticle density in the Transverse region as a function of the pT of the leading object (pleadingT )
rises steeply at low pleadingT until a plateau at about twice the inclusive particle density is
reached [2]. In the framework of MPI-based models, the probability for a hard scattering
increases with the matter overlap in the collisions (decreasing pp impact parameter). And
conversely, requiring a high-pTobject to be detected in a given collision biases the selection
of collisions towards those with a smaller impact parameter, at which the probability for additional uncorrelated scatterings and consequently the charged-particle number-density
is enhanced [18]. The charged-particle number-density (dNch/dη) in the plateau region
in-creases logarithmically with√s and faster than in minimum-bias events [11]. In MPI-based
models, the height of the plateau is sensitive to the pp impact parameter dependence of the
number of MPI per event [18]. Hence, UE measurements have facilitated the
implementa-tion and tuning of such models [18–21]. They have been used as tools for high precision
Standard Model (SM) measurements as well as searches for physics beyond the SM. In recent years it has been shown that they are also important to obtain a qualitative
under-standing of the centrality dependence of hard processes in p-Pb [22] and Pb-Pb [23, 24]
collisions at LHC energies.
During the last decade, the study of the bulk properties of pp collisions has gained increased interest as a research field in its own right. One of the most important discoveries in pp collisions at the LHC is the observation of collective, fluid-like features. They are strikingly similar to those observed in heavy-ion collisions (AA), where they are attributed to the production of a deconfined hot and dense medium, known as the Quark-Gluon
Plasma (see ref. [25] for a recent review). The question arises whether the conditions
created in high-multiplicity pp collisions can also modify, as in AA [26,27], the yields of hard
probes, for example through partonic energy loss [28]. Hence, the study of hard processes
as a function of the charged-particle number-density has moved into the focus of interest.
In this context the UE activity in the Transverse region (particle or summed-pT density)
provides an event-activity classifier with reduced sensitivity to the hard process studied,
which compared to inclusive classifiers can reduce trivial auto-correlation effects [29,30].
With this in mind, the measurement of the distribution of the number-density in the
Transverse region normalized to its average (relative transverse activity, RT) [29] is included
JHEP04(2020)192
This paper reports measurements characterizing the UE associated with hard
scatter-ings performed at midrapidity (|η| < 0.8) in pp collisions at √s = 13 TeV based on the
CDF method [5], which utilizes the leading-charged particles. It extends the previous
mea-surement of the number-density and summed-pT densities using charged particles [13] to a
lower pT threshold, ptrackT > 0.15 GeV/c, in order to get higher sensitivity to the soft part
of the UE. The results are compared to the previous ALICE measurements in the same
kinematic regions for pp collisions at√s = 0.9 and 7 TeV. The plateau in the Transverse
region (5 < pleadingT < 40 GeV/c) is further characterized by the probability distribution
of its charged-particle number-density normalized to its average value (RT). Moreover, the
mean-transverse momentum in the Transverse region is studied as a function of RT.
The paper is organized as follows: Section 2 introduces the UE observables. The MC
event generators used in this paper are described in section3. The ALICE subsystems used
in the analysis are described in section4, and section5is dedicated to the analysis and data
correction procedures, which includes the evaluation of the systematic uncertainties. The
final results are presented and discussed in section 6 and the conclusions are summarized
in section 7.
2 Underlying event observables
The UE observables considered in this study are based on primary charged particles1
reconstructed in the pseudorapidity range |η| < 0.8 with three different thresholds of the
transverse momentum: ptrack
T > 0.15, 0.5, and 1.0 GeV/c, for both the leading particle and
the associated particles used in the correlation studies. The UE observables are measured
in three different regions defined by the relative azimuthal angle, |∆ϕ| = ϕ − ϕleading, to
the direction of the leading-charged particle (see figure 1):
• |∆ϕ| < 60◦, the Toward region,
• 60◦ < |∆ϕ| < 120◦, the Transverse region,
• |∆ϕ| > 120◦, the Away region.
The following observables, measured as a function of pleadingT , are considered to
char-acterize the UE:
• average charged-particle density: 1 ∆η × ∆ϕ
1 Nev(pleadingT )
Nch (2.1)
• average summed-pT density:
1 ∆η × ∆ϕ 1 Nev(pleadingT ) X pT (2.2)
1A primary particle is a particle with a mean proper lifetime τ larger than 1 cm/c, which is either produced directly in the interaction, or from decays of particles with τ smaller than 1 cm/c, restricted to decay chains leading to the interaction [31].
JHEP04(2020)192
∆ϕ −∆ϕ Leading-particle Toward |∆ϕ| < 60◦ Away |∆ϕ| > 120◦ Transverse 60◦< |∆ϕ| < 120◦ Transverse 60◦< |∆ϕ| < 120◦Figure 1. Illustration of the Toward, Transverse, and Away regions in the azimuthal plane with respect to the leading particle direction.
evaluated in the three azimuthal regions, where Nev(pleadingT ) is the number of events
sat-isfying a given pleadingT interval, ∆ϕ = 2π/3 is the width of the regions in azimuth, and
∆η = 1.6 is the acceptance window in pseudorapidity. The leading particle is not included
in the calculation of the particle density and in the summed pT of the Toward region.
The pleadingT can be regarded as a suitable proxy for the transverse-momentum scale of
the hard scattering to avoid any problems related to jet reconstruction at low transverse momentum. The restriction of the leading-particle pseudorapidity to the acceptance of the detector is part of the definition of the observables. In particular, the measurements
did not correct for the fact that particles with pT > pleadingT can be present outside the
acceptance. Therefore, the same selection is also applied in MC simulations.
The Toward and Away regions are predominated by particle production from the hard process and are, therefore, relatively insensitive to the softer UE. Conversely, the Transverse region is more sensitive to the UE as this region is least affected by contributions from the
hardest scattering [5]. Observables defined inside this region are the primary focus of UE
measurements.
For pleadingT above the onset of the jet pedestal plateau, the UE depends only weakly on
this quantity. It has therefore been proposed in [29] to study the UE properties in events
JHEP04(2020)192
new variable for quantifying event activity, relative transverse activity, RT, defined as:
RT =
Ninc
hNinci, (2.3)
where Ninc is the inclusive number of charged particles in an event and hNinci is the
event-averaged number-density, both evaluated in the Transverse region. Using this observable
as an event classifier one can, as proposed in [29], test whether events with very small UE
activity are compatible with equivalent measurements in e+e− collisions (jet universality)
or whether the scaling behaviour towards high UE activity exhibits properties of
non-trivial soft-QCD dynamics. As a self-normalized observable, RT is relatively insensitive
to center-of-mass energy and kinematic selection variations, while simultaneously covering a large dynamic range in terms of event activity. The present paper reports the first
measurement of the RT probability distribution and the mean transverse momentum hpTi
in the Transverse region as a function of RT.
3 Monte Carlo models
Particle production in hadronic collisions can be classified according to the energy scale of
the process involved. At high-momentum transfers, Q2 Λ2
QCD, perturbative Quantum
Chromodynamics (pQCD) is the appropriate theoretical framework to describe partonic interactions. This approach can be used to quantify parton yields and correlations, whereas the transition from partons to hadrons (hadronization) is a non-perturbative process that has to be treated using phenomenological approaches. For momenta of the order of the QCD scale, ∼ 200 MeV/c, a perturbative treatment is no longer feasible. Furthermore, at the center-of-mass energies of the LHC, with momentum transfers of a few GeV/c, the calculated QCD cross sections for 2 → 2 parton scatterings exceed the total hadronic cross
section for pp collisions (see for example [19]). This suggests that hard MPI occur in
this regime. The overall event dynamics cannot be derived fully from first principles and must be described using phenomenological models implemented as general purpose MC generators. In these event generator implementations, model-specific choices are made to regulate these processes at low momentum scales. This section reviews relevant features
of the PYTHIA 8 [32] and Epos [33] MC event generator models, which are used in this
study for data correction and for comparison to our fully corrected results. A more detailed
description of different general-purpose MC generators can be found for example in [34].
PYTHIA 8. In PYTHIA, event generation starts with a primary process that defines
the nature of the event. At LHC energies, this is in most cases a leading order pQCD
partonic scattering. At small pT values, color screening effects need to be taken into
account. Therefore a cut off, pT,0, is introduced, which damps the QCD cross section for
pT pT,0. This cut off is one of the main tunable model parameters. Subsequent partonic
processes calculable in pQCD are initial- and final-state radiation interleaved with MPI, and the structure of beam remnants. The number of MPI in this model depends on the
impact parameter of the pp collision. After these steps, a realistic partonic structure
JHEP04(2020)192
string fragmentation as described by the Lund string model [35], followed by the decays
of unstable particles. In collisions with several MPI, individual long strings connected to the remnants are replaced by shorter additional strings connecting partons from different MPIs. This mechanism, called color reconnection, has been introduced to reproduce the
increase of the average transverse momentum with multiplicity observed in data [36]. For
the comparison with measured observables, MC simulated samples with Monash-2013 [37]
tune and NNPDF2.3 LO PDF set [38] are used.
Epos LHC. The Epos [39] event generator can be used to simulate pp, pA, and AA
collisions. The multiple scattering approach in Epos is based on a combination of
Gribov-Regge theory and pQCD [33]. An elementary scattering corresponds to a parton ladder,
containing a hard scattering calculable based on pQCD, including initial- and final-state radiation. Parton ladders which are formed in parallel to each other share the total colli-sion energy leading to a consistent treatment of energy conservation in hadronic collicolli-sions. String hadronization in Epos is based on the local density of string segments per unit volume with respect to a critical-density parameter. Event-by-event, string segments in low-density regions hadronize normally and independently, creating the corona, while string segments in high-density regions are used to create a core with collective expansion and hadronization including radial and longitudinal flow effects. The Epos LHC tune consid-ered here is based on a dedicated parameter set used to describe data from all LHC energies
and collision systems [40].
4 Experimental setup
ALICE is the dedicated heavy-ion experiment at the LHC. A detailed description of the
ALICE detectors can be found in [41]. In the following, only the detector components used
in the data analysis presented here are described.
The ALICE apparatus comprises a central barrel (pseudorapidity coverage |η| < 0.9 over full azimuth) situated in a uniform 0.5 T magnetic field along the beam axis (z) supplied by a large solenoid magnet. The forward and backward rapidity plastic scintillator counters, V0A and V0C, are positioned on each side of the interaction point, covering pseudorapidity ranges 2.8 < η < 5.1 and −3.7 < η < −1.7, respectively. And they are used for determination of the interaction trigger and to suppress beam-gas and beam-halo background events. The central barrel contains a set of tracking detectors: a six-layer high-resolution silicon Inner Tracking System (ITS) surrounding the beam pipe, and a large-volume (5 m length, 0.85 m inner radius and 2.8 m outer radius) cylindrical Time Projection Chamber (TPC).
The first two layers of the ITS are equipped with high-granularity Silicon Pixel De-tectors (SPD), which cover the pseudorapidity ranges |η| < 2.0 and |η| < 1.4 respectively. The position resolution is 12 µm in r-ϕ and about 100 µm along the beam direction. The following two layers are composed of Silicon Drift Detectors (SDD). The position along the beam direction is measured via collection anodes, and the associated position resolution is about 50 µm. The r-ϕ coordinate is given by a drift-time measurement, with a spatial
JHEP04(2020)192
resolution of about 60 µm. Finally, the two outer layers are made of double-sided Silicon micro-Strip Detectors (SSD) with a position resolution of 20 µm in r-ϕ and about 800 µm along the beam direction. The material budget of all six layers, including support and services, amounts to 7.7% of a radiation length in the transverse plane.
The TPC covers the pseudorapidity range of about |η| < 0.9 for tracks traversing the outer radius. In order to avoid border effects, the fiducial region has been restricted in this analysis to |η| < 0.8. The position resolution along the r-ϕ coordinate varies from 1100 µm at the inner radius to 800 µm at the outer. The resolution along the beam axis ranges from 1250 µm to 1100 µm.
The ITS and TPC space points are combined to reconstruct tracks from charged
parti-cles over a wide transverse momentum range starting from pT= 0.15 GeV/c. The tracking
efficiency estimated from a full simulation of the detectors is ≈ 65% at the lowest pT, and
increases with pT, plateauing at ≈ 80% for pT > 2 GeV/c. The transverse momentum
resolution is better than 3% for primary tracks below 1 GeV/c, and degrades linearly up
to 6% at pT = 40 GeV/c [42]. The transverse impact parameter resolution decreases from
300 µm at 0.2 GeV/c to 20 µm at 30 GeV/c.
5 Analysis procedure
5.1 Event selection
The measurements presented here use data collected by ALICE during the 2016 LHC pp run
at√s = 13 TeV. During this period, minimum-bias (MB) events were selected using the
high purity V0-based MBand trigger which required a charged-particle signal coincidence in the V0A and V0C arrays. It is the same trigger as used in LHC Run 1 high-luminosity data
taking [42]. After event selection, a data sample of 46.2 million MBand triggered events is
obtained. Further event selection for offline analysis is made by requiring a primary vertex
position along the z-axis within ±10 cm (|vz| < 10 cm) around the nominal interaction
point to ensure full geometrical acceptance in the ITS. Pile-up interactions are limited by keeping the average number of pp interactions per bunch crossing below 0.06 through beam separation in the horizontal plane. Residual pile-up events are rejected based on a multiple
interaction points finding algorithm using SPD information [42]. Primary tracks satisfying
various quality selection criteria, described in the next section, are used in this analysis.
Moreover, at least one track with a minimum transverse momentum ptrack
T = 0.15, 0.5, and
1.0 GeV/c in the acceptance range |η| < 0.8 is required for the analysis. Table1summarizes
the percentage of events remaining after each event selection step for the various ptrackT
selections. The last row in the table shows the sample size available for the RT analysis.
5.2 Track selection
The selected charged-particle tracks are required to have at least 70 TPC space points, the number of geometrically possible clusters which can be assigned to a track, and more than 60% of the findable TPC space points, i.e. those that can be assigned to tracks based on geometrical criteria derived from track parameters. The track selection criteria
JHEP04(2020)192
Events Fraction (%) Offline trigger 46.2 M 100.0 Reconstructed vertex 42.8 M 92.6 ptrack T > 0.15 GeV/c 40.4 M 87.4 ptrackT > 0.5 GeV/c 34.5 M 74.7 ptrackT > 1.0 GeV/c 22.1 M 47.8 pleadingT > 5.0 GeV/c 0.43 M 0.93Table 1. Events (absolute numbers and percentages) remaining after each event selection step.
are optimized for good momentum resolution and minimal contamination from secondary tracks. For this purpose a track must have at least 3 clusters in the ITS, one of which has
to be in the first 3 layers. The quality of the track fitting measured in terms of the χ2 per
space point is required to be lower than 4 (each space point having 2 degrees of freedom). Moreover, to reject secondary tracks, the distance of closest approach (DCA) of the track
to the primary vertex along the beam axis (DCAZ) is required to be smaller than 2 cm.
In the transverse direction, the maximum allowed DCAXY corresponds to seven times the
pT-dependent DCAXY resolution.
5.3 Corrections
For efficiency and acceptance corrections, events are generated with the PYTHIA 8 MC
with the same tune as listed in the early section. They are subsequently transported
through the software description of the ALICE apparatus using GEANT 3.21 [44]. For
particles crossing sensitive detector layers the detector response is simulated. The simulated events are reconstructed and analyzed using the same algorithms as used for the real data. The number of simulated events similar to the ones in data are used to determine the corrections.
The measured particle and P pT densities are corrected for tracking efficiency,
con-tamination from secondary particles, and the finite vertex reconstruction efficiency. The
particle with the highest pT in a collision may not be detected due to finite acceptance and
efficiency of the detection apparatus, and a lower pT track enters the analysis instead. If
the misidentified leading particle has a different pT but roughly the same direction as the
true leading particle, this leads to a shift in pleadingT . On the other hand, if the misidentified
leading particle has a significantly different direction than the true one, this will cause a rotation of the event topology and a bias on the UE observables. The data are corrected
for these effects using a data-driven procedure described in detail in ref. [11].
Table 2 summarizes the maximum effect of each correction on the measured final
observable for ptrackT > 0.15 GeV/c. For other ptrackT thresholds the effects are similar. The
correction procedures follow the same approach as described in [11]. In the following only
the corrections for RT-related distributions using unfolding and re-weighting methods will
JHEP04(2020)192
Correction charged-particle density P pT density Efficiency 30% 25%Leading track misidentification 7% 7%
Contamination 3% 2%
Vertex reconstruction 0.9% 0.9%
Table 2. Maximum effect of pT-dependent corrections on measured particle and summed-pT den-sities with ptrack
T > 0.15 GeV/c threshold.
Due to the finite momentum resolution and tracking efficiency of the detector, the
measured RT probability distribution and the charged-particle hpTi distribution as a
func-tion of RT are distorted. This affects, in particular, the RT probability distribution which
falls steeply at large RT. For this reason an unfolding procedure is employed to correct for
detector effects. For the measurement of the charged-particle hpTi vs. RT both quantities
have to be corrected. For the full unfolding a 4-dimensional response matrix is needed.
Considering that the charged-particle hpTi rises slowly as a function of RT, a re-weighting
correction procedure is performed, as described in [45,46].
Unfolding. The RT probability distribution is corrected using 1-dimensional Bayesian
unfolding [47], an iterative method based on Bayes’ theorem, as implemented in the
RooUn-fold package [48]. To this end, a 2-dimensional response matrix is created using the
PYTHIA 8 generator. It maps the particle level RtruthT obtained from a MC simulation to
the detector level RmeasT obtained after full GEANT3 based transport, track
reconstruc-tion, and track selection. Projections of the distribution of RTmeasfor a given RTtruthare well
approximated by a Gaussian distribution, and hence, described by its mean and standard deviation. This is used to extrapolate the response matrix into a region where statistical
uncertainties are large and can deteriorate the quality of the unfolding. Figure2shows the
mean and standard deviation of RmeasT as a function of RtruthT obtained from the PYTHIA 8
simulation. A linear function and a function of the form a√x + b are used to fit the mean
and the standard deviation, respectively. Over the whole RtruthT range the relative difference
between the fit and the simulated data is less than 1% and less than 0.2% for RtruthT < 2.
Therefore, the results of the fits are used to extend the response matrix to RtruthT > 2. The
smoothened response matrix is used for RT probability distribution unfolding and hpTi
re-weighting, with the difference between the data points and the parameterized fitting
functions (as shown in figure2) being propagated to the final systematical uncertainties.
For the unfolding correction, the PYTHIA 8 generated RtruthT distribution is used as
the prior. Convergence is reached typically after three iterations. As an additional cross check, the analysis is also carried out using the Singular Value Decomposition (SVD)
un-JHEP04(2020)192
truth T R 0 1 2 3 4 5 6 7 8 9 〉 meas T R〈 0 2 4 6 8 10 pp, s = 13TeV PYTHIA 8 Monash 2013 + 0.007 x = 0.992 y Transverse region | < 0.8 η , | c > 0.15 GeV/ track T p ) c < 40 (GeV/ leading T p 5 < ALICE truth T R 0 1 2 3 4 5 6 7 8 9 ) meas T R( σ 0 0.1 0.2 0.3 0.4 0.5 0.6 0.7 0.8 pp, s = 13TeV PYTHIA 8 Monash 2013 + 0.008 x = 0.196 y Transverse region | < 0.8 η , | c > 0.15 GeV/ track T p ) c < 40 (GeV/ leading T p 5 < ALICEFigure 2. Mean Rmeas
T and standard deviation σ of the RmeasT distribution as a function of RtruthT . The solid lines represent the fits to the points and the extrapolation to higher Rtruth
T , resulting in the parameterized response matrix used for unfolding.
folding [49]. The relative difference between the SVD and Bayesian unfolded distributions
is found to be below 2%. To study the influence of the corrections using a particular MC event generator, Epos LHC generator is also used to determine the unfolding response matrix and as prior in the unfolding process. The difference of the unfolded results using different MC generator corrections is considered as part of unfolding uncertainty.
Mean pT re-weighting. For the measurement of the charged-particle hpTi as a function
of RT, a re-weighting approach is used. The procedure is implemented based on the
following relation between the true and measured RT
hpTi(Rtruth
T ) =
X
P (RmeasT |Rtruth
T ) × hpTi(RTmeas) (5.1)
where P (RTmeas|Rtruth
T ) is the normalised probability distribution of RmeasT in a given RtruthT
interval, which is obtained from the detector response matrix previously described.
5.4 Systematic uncertainties
The evaluation of the systematic uncertainties on the charged-particle number density and
P pT density follows closely the methods developed for inclusive charged-particle
mea-surements [45,50, 51] and the UE measurements at lower collision energies [11]. Table 3
summarizes the systematic uncertainties evaluated for the particle transverse momentum ptrackT > 0.15 GeV/c threshold, for selected pleadingT ranges. In the following, the individual
sources of systematic uncertainty, listed in the first column of table 3, will be described
briefly. A detailed description of the procedures can be found in [11].
• ITS-TPC track matching efficiency: systematic uncertainties on the ITS and TPC detector efficiencies are estimated by comparing the experimental ITS-TPC track matching efficiencies with those obtained using the MC sample.
• Track and vertex selection: by applying the efficiency and contamination correc-tions, one accounts for those particles which are lost due to detector effects, vertex
JHEP04(2020)192
Charged-particle density Summed-pTdensity
pleadingT < 1 GeV/c p leading T > 6 GeV/c p leading T < 1 GeV/c p leading T > 6 GeV/c
ITS-TPC track matching 0.3% 2.3% 0.4% 3.2%
Track cuts 0.8% 1.6% 0.7% 1.5%
Secondaries contamination 0.2% 0.2% 0.2% 0.2%
Misidentification bias 0.7% negligible 0.9% negligible
Vertex reconstruction 0.3% negligible 0.3% negligible
MC non-closure 0.9%, 0.9%, 1.1% 0.7%, 0.1%, 0.1% 0.4%, 0.2%, 0.4% 0.6%, 0.3%, 0.3% MC dependence 0.3%, 0.6%, 0.8% 1.7%, 2.8%, 2.8% 0.5%, 0.5%, 0.4% 1.0%, 3.0%, 3.0% Total uncertainty 1.5%, 1.5%, 1.8% 3.4%, 3.9%, 3.9% 1.4%, 1.4%, 1.5% 3.9%, 4.7%, 4.6% Table 3. Systematic uncertainties of the charged-particle number and summed-pT densities as a function of pleadingT for the transverse momentum threshold ptrackT > 0.15 GeV/c in pp collisions at √s = 13 TeV. When more than one number is quoted, the values refer to the uncertainty in Toward, Transverse, and Away regions, respectively; they are independent of the azimuthal region in all other cases.
reconstruction inefficiency, and secondary tracks which have not been removed by the selection criteria. These corrections rely on detector simulations. Therefore, the systematic uncertainties were estimated by varying the choices of track parameter requirements and vertex reconstruction parameters.
• Secondary particle contamination: MC generators underestimate the production of strange particles in data. The effect on the secondary particle contamination correc-tion was estimated by varying the strange particle fraccorrec-tion between the one given by
PYTHIA and the one compatible with the tails of the DCAXY distribution which
are predominantly populated by secondaries.
• Misidentification bias: the uncertainty on the leading-track misidentification correc-tion is estimated from the discrepancy between a data-driven correccorrec-tion used in the analysis and an alternative method based on simulations.
• MC non-closure: by correcting an MC generator prediction after full detector simu-lation with corrections extracted using the same generator, one expects to reproduce the input MC prediction within statistical uncertainty. This consideration holds true only if each correction is evaluated with respect to all the variables to which the given correction is sensitive. Any statistically significant difference between input and cor-rected distributions is referred to as MC non-closure and is added in quadrature to the total systematic uncertainty.
• MC dependence: the difference in final distributions when applying corrections ex-tracted using PYTHIA 8 or Epos LHC generators was quantified and added to the systematic uncertainty.
JHEP04(2020)192
Since RT is a self-normalized quantity evaluated event-by-event, the systematic
uncer-tainties related to the ITS-TPC track matching efficiency and track cuts partially cancel
each other. A residual effect results from the fact that the pT spectrum gets harder with
increasing multiplicity, leading to a difference between the pT weighted efficiencies for Ninc
and hNinci, which is imperfectly accounted for through the MC-based response matrix.
The resulting scale uncertainty on RT has been estimated by varying the shape of the
pT spectra within uncertainties taken from the spectrum analysis [51]. The variations are
propagated to the RT distribution via the response matrix.
Another contribution to the systematic uncertainty on the RT distribution results
from the event selection. This uncertainty is estimated by repeating the RT analysis
using a more restrictive selection on the primary vertex, |vz| < 7 cm. Since the vertex
reconstruction efficiency increases with Ninc, also the systematic uncertainty related to
this efficiency cancels only partially in the ratio Ninc / hNinci (in particular at low Ninc,
where the efficiency is low). This uncertainty is evaluated by changing the default selection from one minimum track contributing to the primary vertex to two tracks. The resulting
difference of 2.7% is assigned as the systematic uncertainty on the Ninc determination.
To validate the unfolding procedure, and identify potential biases, closure tests are performed which compare the unfolded distribution to the particle-level truth in the MC simulation. Consistency of the unfolding procedure is also ensured by re-folding the solu-tion to detector level and comparing it to the uncorrected distribusolu-tion used as input. The remaining difference of 0.3% is assigned as uncertainty from MC non-closure. As discussed in the previous section, the Bayesian unfolding is employed as the default method. The number of iterations serves as a regularization parameter in Bayesian unfolding. Based on the closure test and convergence, four iterations were chosen as the default. To estimate the related systematic uncertainty, the iterations parameter is varied by ±2. The unfolded results are quite stable against regularization parameter variations with a maximum
devia-tion of 1.2% at high-RT. As an independent cross-check, the SVD unfolding has also been
used in the analysis and the difference between SVD and Bayesian unfolded results are
found to be less than 0.4%. The corrected RT distribution is obtained after the unfolding,
which is performed using the detector response matrix computed based on simulations with PYTHIA 8 tune Monash-2013. This particular choice of MC event generator affects the prior used for unfolding. To investigate the systematic uncertainty from this particular choice, the prior distributions are varied using the deviations of fitted Negative Binomial
Distribution (NBD) distribution (see section 6).
For the measurement of the hpTi distribution vs. RT, a 1% systematic uncertainty from
MC non-closure using the re-weighting procedure is assigned. The uncertainty from the ITS-TPC track matching efficiency contributes to 1.3%, while the track selection criteria results in a total uncertainty of around 0.4%. The residual scale uncertainty due to the
particle pT-spectrum slope changes is estimated using the same approach as described for
RT. Here both RTand hpTi are affected and therefore the residual scale uncertainty largely
cancels out, resulting in a systematic uncertainty of 0.2% on hpTi. The variations of the
number of vertex contributors and the vertex cut contribute both 0.2 % to the systematic uncertainty.
JHEP04(2020)192
RT probability distribution hpTi vs. RT
Unfolding ± 3.1% —
Z vertex cut ± 2.4% ± 0.2%
Minimum of Nch to primary vertex ± 2.7% ± 0.2%
Track cuts — ± 0.4%
ITS-TPC track matching — ± 1.3%
Residual scale ± 2.2% ± 0.2%
MC non-closure ± 0.4% ± 1.0%
Total uncertainty ± 5.3% ± 1.6%
Table 4. Systematic uncertainties for RTprobability and hpTi distributions as a function of RT.
The maximum systematic uncertainties for the RT probability and hpTi distributions
as a function of RT are summarized in table 4. The overall systematic uncertainty is
calculated by summing the different contributions in quadrature.
6 Results and discussion
In the following the results for the charged-particle number and summed-pT densities in
three azimuthal regions are reported and discussed. Then the results for the RTprobability
and hpTi vs. RT distributions in the Transverse region are presented. The experimental
results are compared to model calculations using PYTHIA 8 and Epos LHC.
6.1 Charged-particle number density Nch and P pT distributions
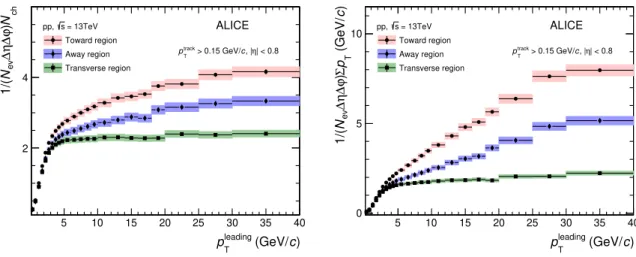
Figure3shows the average charged-particle number and summed-pT densities as a function
of pleadingT , in the Toward, Transverse, and Away regions for the transverse momentum
threshold requirement of ptrackT > 0.15 GeV/c. The averaged charged-particle number and
summed-pTdensities as a function of pleadingT using different pTthresholds for the associated
particles, ptrackT > 0.5 and 1.0 GeV/c, are presented in appendix A. Figure 4 shows the
averaged charged-particle number and summed-pT densities as a function of pleadingT in the
Toward, Transverse, and Away regions for the transverse momentum threshold requirement of ptrackT > 0.15 GeV/c, and the comparison to MC results. The pleadingT dependence in
all regions show a similar behavior. At low pleadingT , there is a steep rise in event activity
followed by a change to a smaller gradient at pleadingT ∼ 5 GeV/c, the plateau region.
Above this value in the Transverse region, and in particular for the number density, the
event activity becomes almost independent of pleadingT , while it continues to rise in the
Toward and Away regions.
In the MPI implementation of PYTHIA, the average number of hard scatterings per event depends strongly on the impact parameter. Conversely, tagging hard scatterings with
JHEP04(2020)192
) c (GeV/ leading T p 5 10 15 20 25 30 35 40 ch N) ϕ ∆ η ∆ ev N 1/( 2 4 = 13TeV s pp, Toward region Away region Transverse region | < 0.8 η , | c > 0.15 GeV/ track T p ALICE ) c (GeV/ leading T p 5 10 15 20 25 30 35 40 ) c (GeV/ T p Σ) ϕ ∆ η ∆ ev N 1/( 0 5 10 pp, s = 13TeV Toward region Away region Transverse region | < 0.8 η , | c > 0.15 GeV/ track T p ALICEFigure 3. Number density Nch (left) and P pT (right) distributions as a function of pleadingT in Toward, Transverse, and Away regions for ptrackT > 0.15 GeV/c. The shaded areas represent the systematic uncertainties and vertical error bars indicate statistical uncertainties.
high-pTparticles biases the events towards lower impact parameter and, hence, higher event
activity. The change of slope observed in data corresponds to the transverse momentum where the leading particle is dominantly produced by rare hard scatterings, where the average yield per event for such a process is 1. This is plausible, in PYTHIA, since
requiring particles with lower pleadingT which are produced in almost every parton-parton
interaction there cannot be a significant bias on the number of MPI. The continuous rise observed for the Toward and Away regions can be attributed to particles not only from the UE but also to the contribution of fragments from hard scatterings, which are mainly
back-to-back in azimuth. The contribution from fragments increases with pleadingT causing the rise
of event activity. In contrast, only a small number of fragments enter the Transverse region. In addition to the contributions from MPI uncorrelated with the hardest scattering, this region contains particles originating from initial-state radiation and hard scatterings which
produce more than two jets, causing the slow rise of event activity with pleadingT observed in
the jet plateau range.
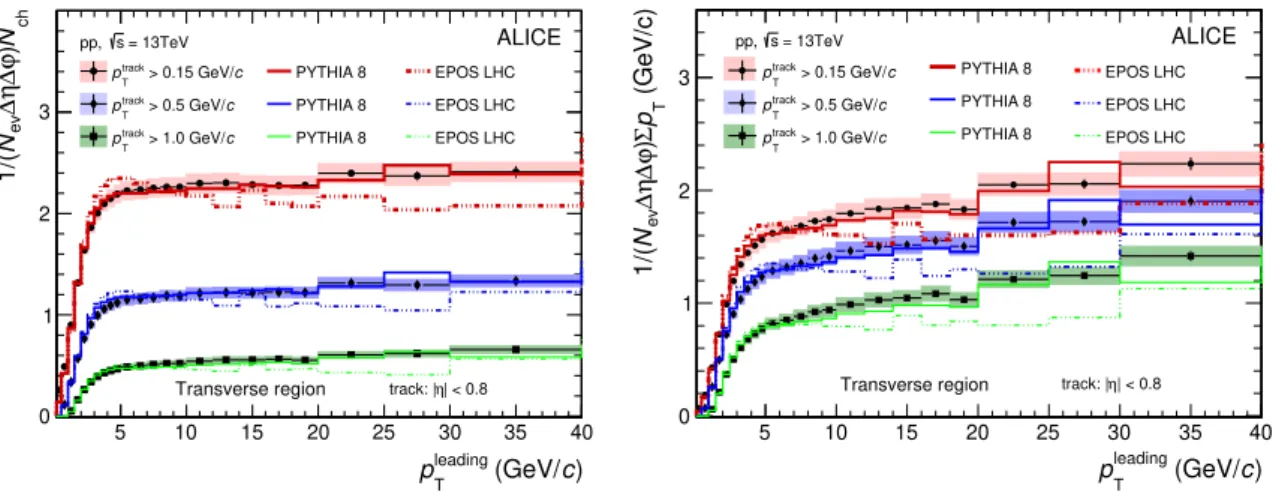
Figure 5compares the number density andP pT distributions as a function of pleadingT
in the Transverse region for the three threshold selections ptrackT > 0.15, 0.5, and 1.0 GeV/c.
In the plateau region, increasing the cut from ptrackT > 0.15 GeV/c to ptrackT > 1.0 GeV/c
reduces the number density by almost a factor of 4. The relative slope of the distributions
in the pedestal region slightly increases with the ptrack
T threshold, indicating an increased
contribution of correlated hard processes (initial-state radiation) to the Transverse region.
This shows that the highest sensitivity to the UE is obtained using the lowest pT threshold.
Figures 4 and 5 also compare the number density Nch and P pT densities to the
results of PYTHIA 8 and Epos LHC calculations. PYTHIA 8 describes the plateau in the Transverse region quite well, while Epos LHC underpredicts the densities in this region (as
well as in the Toward region) by about 20%. When increasing the ptrackT cut, the agreement
JHEP04(2020)192
ch N) ϕ ∆ η ∆ ev N 1/( 2 4 6 ALICE = 13TeV s pp, Data PYTHIA 8 Monash 2013 EPOS LHC | < 0.8 η , | c > 0.15 GeV/ track T p Toward region ) c (GeV/ leading T p 5 10 15 20 25 30 35 40 MC/Data 0.8 1 ) c (GeV/ T p Σ) ϕ ∆ η ∆ ev N 1/( 5 10 15 ALICE = 13TeV s pp, Data PYTHIA 8 Monash 2013 EPOS LHC | < 0.8 η , | c > 0.15 GeV/ track T p Toward region ) c (GeV/ leading T p 5 10 15 20 25 30 35 40 MC/Data 0.8 1 1.2 ch N) ϕ ∆ η ∆ ev N 1/( 1 2 3 ALICE = 13TeV s pp, Data PYTHIA 8 Monash 2013 EPOS LHC | < 0.8 η , | c > 0.15 GeV/ track T p Transverse region ) c (GeV/ leading T p 5 10 15 20 25 30 35 40 MC/Data 0.8 1 ) c (GeV/ T p Σ) ϕ ∆ η ∆ ev N 1/( 1 2 3 ALICE = 13TeV s pp, Data PYTHIA 8 Monash 2013 EPOS LHC | < 0.8 η , | c > 0.15 GeV/ track T p Transverse region ) c (GeV/ leading T p 5 10 15 20 25 30 35 40 MC/Data 0.8 1 ch N) ϕ ∆ η ∆ ev N 1/( 2 4 ALICE = 13TeV s pp, Data PYTHIA 8 Monash 2013 EPOS LHC | < 0.8 η , | c > 0.15 GeV/ track T p Away region ) c (GeV/ leading T p 5 10 15 20 25 30 35 40 MC/Data 0.8 0.9 1 1.1 ) c (GeV/ T p Σ) ϕ ∆ η ∆ ev N 1/( 2 4 6 8 ALICE = 13TeV s pp, Data PYTHIA 8 Monash 2013 EPOS LHC | < 0.8 η , | c > 0.15 GeV/ track T p Away region ) c (GeV/ leading T p 5 10 15 20 25 30 35 40 MC/Data 0.8 1 1.2Figure 4. Number density Nch(left) andP pT(right) distributions as a function of pleadingT along with the MC simulations in Toward (top), Transverse (middle), and Away (bottom) regions for the threshold of ptrack
T > 0.15 GeV/c. The shaded areas in the upper panels represent the systematic uncertainties and vertical error bars indicate statistical uncertainties for the data. In the lower panels, the shaded areas are the sum in quadrature of statistical and systematic uncertainties from upper panels. No uncertainties are shown for the MC simulations.
JHEP04(2020)192
) c (GeV/ leading T p 5 10 15 20 25 30 35 40 ch N) ϕ ∆ η ∆ ev N 1/( 0 1 2 3 c > 0.15 GeV/ track T p c > 0.5 GeV/ track T p c > 1.0 GeV/ track T p PYTHIA 8 PYTHIA 8 PYTHIA 8 EPOS LHC EPOS LHC EPOS LHC = 13TeV s pp, | < 0.8 η track: | Transverse region ALICE ) c (GeV/ leading T p 5 10 15 20 25 30 35 40 (GeV/c) T p Σ) ϕ ∆ η ∆ ev N 1/( 0 1 2 3 track > 0.15 GeV/c T p c > 0.5 GeV/ track T p c > 1.0 GeV/ track T p PYTHIA 8 PYTHIA 8 PYTHIA 8 EPOS LHC EPOS LHC EPOS LHC = 13TeV s pp, | < 0.8 η track: | Transverse region ALICEFigure 5. Number density Nch (left) and P pT (right) distributions as a function of p leading T along with the MC simulations in Transverse region for three transverse momentum thresholds of ptrack
T > 0.15, 0.5, and 1.0 GeV/c. The shaded areas represent the systematic uncertainties and vertical error bars indicate statistical uncertainties for the data. No uncertainties are shown for the MC simulations.
appendixA), with the largest discrepancies appearing at low pleadingT in the Toward region.
In general Epos LHC fails to reproduce the experimental data in most regions. This can be attributed to the underprediction of the number of hard scatterings in the model. The
issue is expected to be solved in EPOS 3 using a new variable saturation scale [52,53].
Figure 6 (left) shows the comparison of the results obtained at √s = 13 TeV to the
ones obtained at lower collision energies, √s = 0.9 and 7 TeV [11], in the Transverse
region. Between the two higher energies, the number density in the plateau increases by
about 30%. More information about the √s-dependence in the Transverse region can be
obtained by comparing the shapes of the number density vs. pleadingT . To this end, the height
of the plateau for different collision energies is quantified by fitting a constant function in
the range 5 < pleadingT < 10 GeV/c, shown as lines in figure 6 (left). The fitting range
was restricted to the common range in order to be consistent with the procedure used for
the measurements at lower √s. Larger fitting ranges were also considered and consistent
results were obtained. The shapes of the particle densities as a function of pleadingT are then
compared after dividing the densities by the height of the plateau. The results are shown
in figure 6 (right). For the two higher energies the coverage extends beyond the fitting
range, i.e. to pT > 10 GeV/c. In this range the densities agree within the statistical and
systematic uncertainties. In the region of the rise (pT < 5 GeV/c) one observes a clear
ordering among the three collision energies, the lowest energy having the highest density
relative to the plateau. At lower√s the plateau starts at a slightly lower pleadingT .
Figure 7shows the √s-dependence of the number density of the plateau in the
Trans-verse region for ptrackT > 0.5 GeV/c, from a fitting of a constant function in the pleadingT
range 5 < pleadingT < 10 GeV/c. The lower energy data are taken from ALICE [11]
and CDF [5] measurements. It is compared with the midrapidity charged-particle density
dNch/dη|η=0of charged-particles with pT> 0.5 GeV/c in MB events also requiring at least
JHEP04(2020)192
) c (GeV/ leading T p 0 5 10 15 20 25 30 35 40 ch N) ϕ ∆ η ∆ ev N 1/( 0 0.5 1 1.5 2 2.5 3 pp collisions = 13TeV s = 7TeV, JHEP 2012 (07):116 s = 0.9TeV, JHEP 2012 (07):116 s Constant fitting | < 0.8 η , | c > 0.15 GeV/ track T p Transverse region ALICE 0 5 10 15 20 25 30 35 40 scaled ch N) ϕ ∆ η ∆ ev N 1/(0.5 1 pp collisions = 13TeV s (1./2.23), × = 7TeV s (1./1.77), × = 0.9TeV s (1./1.00), × | < 0.8 η , | c > 0.15 GeV/ track T p Transverse region ALICE ) c (GeV/ leading T p 0 5 10 15 20 25 30 35 40 Ratio 0.5 1 1.5 0.9TeV/13TeV 7TeV/13TeVFigure 6. Left: number density Nch in the Transverse region as a function of pleadingT (p track T > 0.15 GeV/c threshold) for√s = 0.9, 7 and 13 TeV. A constant function is used to fit the data in the range 5 < pleadingT < 10 GeV/c and the results are shown as solid lines. Right: number densities Nch scaled by the pedestal values obtained from the fit in order to compare the shapes. The open boxes represent the systematic uncertainties and vertical error bars indicate statistical uncertainties.
region is more than a factor of two higher than dNch/dη. Both are consistent with a
loga-rithmic dependence on collision energy. Between √s = 0.9 and 13 TeV dNch/dη increases
by approximately a factor of 2.1 whereas the increase of the UE activity is 30% larger, confirming the trend observed previously for collision energies up to 7 TeV.
ATLAS has published similar UE results measured in a wider rapidity acceptance of
|η| < 2.5 and using a threshold of ptrack
T > 0.5 GeV/c [13]. Since jets have a finite extension
in η-ϕ space, the larger acceptance allows more particles from the leading jet fragmentation and in particular, from the away-side partner jet subject to a pseudorapidity swing, to enter the measurement and, hence, the results in the Toward and Away regions are not directly comparable between the two experiments. Notably, the smaller acceptance obscures an
interesting feature observed by ATLAS: for pleadingT > 7 GeV/c the Away region has a
higher charged-particle multiplicity density than the Toward region, despite not containing
the highest-pT charged particle. In the ALICE measurement the Toward region has always
the higher multiplicity density (see figure 3). However, when comparing the distributions
from the Transverse region one observes good agreement (figure 8) in the plateau region.
This indicates that the UE activity does not depend strongly on the rapidity coverage and
that the fact that in some cases particles with pT > pleadingT are outside the acceptance does
not have a strong effect on the measurement. For the lower acceptance used in ALICE,
the plateau starts at a slightly lower pleadingT . As a consequence, in the region of the
steep rise for pleadingT < 5 GeV/c, the ratio between the densities for the higher and lower η
acceptance increases strongly with pleadingT . In MPI-based models, like the one implemented
in PYTHIA 8, the onset of the plateau is reached when the per-event probability to find a
leading particle of a given pleadingT is much less than unity. Decreasing the acceptance or, as
discussed above, lowering the collision energy would move the onset of the plateau to smaller pleading, which is in agreement with our observations (see PYTHIA 8 comparison in figure8).
JHEP04(2020)192
(TeV)
s
1 10〉
η
/d
chN
d〈
0.2 0.4 0.6 0.8 1 1.2 1.4 c > 0.5 GeV/ track T p UE = 0.9, 7, 13 TeV s ALICE pp = 1.8 TeV s p CDF p ) π MB (scaled by 1/2 = 0.9, 2.36, 7, 13 TeV s ATLAS ppFigure 7. Comparison of number density in the plateau of the Transverse region with lower energy data taken from [5,11] and dNch/dη in minimum-bias events (scaled by 1/2π) [54]. Both are for charged-particles with pT> 0.5 GeV/c. Error bars represent statistical and systematic uncertainties summed in quadrature. The straight lines show the results of fitting data points with the functional form a + b ln s.
6.2 Relative transverse activity classifier RT distributions
The RT analysis is performed using a track transverse momentum threshold of ptrackT >
0.15 GeV/c and by selecting events in the plateau region (pleadingT > 5 GeV/c). Here the
RT probability distribution and the mean charged-particle pT as a function of RT, in the
Transverse region, are reported.
The RT probability distribution is shown in figure 9. The distribution has been fitted
by a modified NBD with the multiplicity scaled by its average value, as was done for the
measured RT observable. Within the experimental uncertainties, the NBD fit gives a good
description of the data up to RT= 3, and it slightly overestimates the data with increasing
RT, by about 14% at RT= 5. The distribution is also compared with the calculations from
PYTHIA 8 and Epos LHC. While both models describe the data well in the RT regions
close to the peak at RT∼ 0.7, both PYTHIA 8 and Epos LHC calculations diverge strongly
at higher RT, and underpredict the RTdistribution by more than a factor of two for RT >
4. This opens possibilities to study the interplay of components of pp collisions. Detailed MC event generators studies are needed to interpret the mechanisms responsible for the
JHEP04(2020)192
ch )N ϕ ∆ η ∆ ev 1/(N 0.2 0.4 0.6 0.8 1 1.2 1.4 1.6 = 13TeV s pp, | < 0.8 η ALICE, | | < 2.5, JHEP 2017 (03):157 η ATLAS, | | < 0.8 η PYTHIA 8, | | < 2.5 η PYTHIA 8, | c > 0.5 GeV/ track T p Transverse region ) c (GeV/ leading T p 5 10 15 20 25 30 Ratio 0.4 0.6 0.8 1 ATLAS/ALICE | < 0.8 η | < 2.5/| η PYTHIA 8, | ) c (GeV/ T p Σ) ϕ ∆ η ∆ ev 1/(N 0.2 0.4 0.6 0.8 1 1.2 1.4 1.6 1.8 2 2.2 = 13TeV s pp, | < 0.8 η ALICE, | | < 2.5, JHEP 2017 (03):157 η ATLAS, | | < 0.8 η PYTHIA 8, | | < 2.5 η PYTHIA 8, | c > 0.5 GeV/ track T p Transverse region ) c (GeV/ leading T p 5 10 15 20 25 30 Ratio 0.4 0.6 0.8 1 ATLAS/ALICE | < 0.8 η | < 2.5/| η PYTHIA 8, |Figure 8. Number density Nch(left) andP pTdensity (right) in the Transverse region for ptrackT > 0.5 GeV/c at √s = 13 TeV from ALICE (|η| < 0.8) and ATLAS (|η| < 2.5) measurements [13]. The results are compared to PYTHIA 8 Monash-2013 calculations. The shaded areas represent the systematic uncertainties and vertical error bars indicate statistical uncertainties for the data. No uncertainties are shown for the MC simulations.
0 1 2 3 4 5 T R /d ev N d ev N 1/ 4 − 10 3 − 10 2 − 10 1 − 10 1 = 13TeV s pp, Data PYTHIA 8 Monash 2013 EPOS LHC = 5.247) m = 3.969, k NBD fit ( | < 0.8 η ,| c > 0.15 GeV/ track T p ) c < 40 (GeV/ leading T p 5 < ALICE T R 1 2 3 4 5 Ratio 0.5 1
Figure 9. RT probability distribution in the Transverse region for ptrackT > 0.15 GeV/c and |η| < 0.8. The result (solid circles) is compared to the PYTHIA 8 and Epos LHC calculations (lines). The red line represents the result of the NBD fit, where the multiplicity is scaled by its mean value, m. The parameter k is related to the standard deviation of the distribution via σ =
q 1 m+
1 k. The open boxes represent the systematic uncertainties and vertical error bars indicate statistical uncertainties for the data. The bands indicate the statistical uncertainties of the MC simulations. The bottom panel shows the ratio between the NBD fit, as well as those of the MC to the data.
JHEP04(2020)192
1 2 3 4 5 (GeV/c)〉 T p〈 0.6 0.8 1 1.2 pp, s = 13TeV Data PYTHIA 8 Monash 2013 EPOS LHC | < 0.8 η , | c > 0.15 GeV/ track T p ) c < 40 (GeV/ leading T p 5 <ALICE
T R 1 2 3 4 5 Ratio 0.9 1 1.1Figure 10. hpTi in the Transverse region as a function of RTfor ptrackT > 0.15 GeV/c and |η| < 0.8. Data (solid circles) are compared to the results of PYTHIA 8 and Epos LHC calculations (lines). The open boxes represent the systematic uncertainties and vertical error bars indicate statistical uncertainties for the data. The bands indicate the statistical uncertainties of the MC simulations. The bottom panel shows the ratio of the MC to data.
The charged-particle hpTi distribution as a function of RT is shown in figure10. The
average transverse momentum rises steadily from ∼ 0.6 GeV/c at low UE multiplicity to ∼ 1 GeV/c for 5 times the mean multiplicity. The results are also compared with the PYTHIA 8 and Epos LHC calculations. While the shapes are similar, both models
deviate from the measurement by up to 10%, in particular at the extremes of the RT
interval covered by the measurement. Interestingly, at high multiplicity the deviations have opposite signs for the two models, with PYTHIA 8 predicting slightly harder and Epos LHC softer transverse activity than seen in data.
7 Conclusions
The UE properties in pp collisions at √s = 13 TeV have been characterized by
measur-ing the number density Nch and P pT density distributions of charged particles in three
azimuthal regions with respect to the leading charged-particle direction: Toward, Trans-verse, and Away. The measurement is performed using charged particles, which have been corrected to the level of primary charged particles. The results are compared to previous
ALICE measurements in pp collisions at√s = 0.9 and 7 TeV. In this work, the kinematic
range of the leading particle is extended, and the uncertainties are reduced. An increase of approximately 30% of the jet pedestal is observed when the pp collision energy increases
from √s = 7 to 13 TeV. The UE activity, quantified by the charged-particle density in the
jet pedestal range in the Transverse region, shows a stronger increase with √s than the
agree-JHEP04(2020)192
ment with an increased relative contribution of hard processes to the UE with increasing √
s.
The Transverse region has been further characterized by the relative transverse UE
activity classifier RT. Measuring UE quantities versus RT yields sensitivity to rare events
with exceptionally large or small transverse activity with respect to the event-averaged mean. The models considered in the paper, PYTHIA 8 and Epos LHC, cannot describe
the RTdistribution in the full range covered by the measurements (0 < RT < 5). Moreover,
whereas the overall agreement with hpTi measured in the transverse region as a function
of RT is within 10%, PYTHIA 8 and Epos LHC show significant deviations at very low
and high RT. Compared to data and to each other, these models show a significantly
different behavior at high RT. This might be a consequence of how each model treats the
high-density events. Therefore, the measurements presented here provide new constraints on the models, particularly to their description of MPI.
Acknowledgments
The ALICE Collaboration would like to thank all its engineers and technicians for their invaluable contributions to the construction of the experiment and the CERN accelerator teams for the outstanding performance of the LHC complex. The ALICE Collaboration gratefully acknowledges the resources and support provided by all Grid centres and the Worldwide LHC Computing Grid (WLCG) collaboration. The ALICE Collaboration ac-knowledges the following funding agencies for their support in building and running the ALICE detector: A. I. Alikhanyan National Science Laboratory (Yerevan Physics Insti-tute) Foundation (ANSL), State Committee of Science and World Federation of Scientists (WFS), Armenia; Austrian Academy of Sciences, Austrian Science Fund (FWF): [M
2467-N36] and Nationalstiftung f¨ur Forschung, Technologie und Entwicklung, Austria; Ministry
of Communications and High Technologies, National Nuclear Research Center, Azerbaijan;
Conselho Nacional de Desenvolvimento Cient´ıfico e Tecnol´ogico (CNPq), Financiadora de
Estudos e Projetos (Finep), Funda¸c˜ao de Amparo `a Pesquisa do Estado de S˜ao Paulo
(FAPESP) and Universidade Federal do Rio Grande do Sul (UFRGS), Brazil; Ministry of Education of China (MOEC) , Ministry of Science & Technology of China (MSTC) and National Natural Science Foundation of China (NSFC), China; Ministry of Science and Education and Croatian Science Foundation, Croatia; Centro de Aplicaciones
Tec-nol´ogicas y Desarrollo Nuclear (CEADEN), Cubaenerg´ıa, Cuba; Ministry of Education,
Youth and Sports of the Czech Republic, Czech Republic; The Danish Council for In-dependent Research — Natural Sciences, the VILLUM FONDEN and Danish National Research Foundation (DNRF), Denmark; Helsinki Institute of Physics (HIP), Finland;
Commissariat `a l’Energie Atomique (CEA), Institut National de Physique Nucl´eaire et de
Physique des Particules (IN2P3) and Centre National de la Recherche Scientifique (CNRS)
and R´egion des Pays de la Loire, France; Bundesministerium f¨ur Bildung und Forschung
(BMBF) and GSI Helmholtzzentrum f¨ur Schwerionenforschung GmbH, Germany; General
Secretariat for Research and Technology, Ministry of Education, Research and Religions, Greece; National Research, Development and Innovation Office, Hungary; Department of
JHEP04(2020)192
Atomic Energy Government of India (DAE), Department of Science and Technology, Gov-ernment of India (DST), University Grants Commission, GovGov-ernment of India (UGC) and Council of Scientific and Industrial Research (CSIR), India; Indonesian Institute of Science, Indonesia; Centro Fermi — Museo Storico della Fisica e Centro Studi e Ricerche Enrico Fermi and Istituto Nazionale di Fisica Nucleare (INFN), Italy; Institute for Innovative Science and Technology , Nagasaki Institute of Applied Science (IIST), Japanese Ministry of Education, Culture, Sports, Science and Technology (MEXT) and Japan Society for the Promotion of Science (JSPS) KAKENHI, Japan; Consejo Nacional de Ciencia
(CONA-CYT) y Tecnolog´ıa, through Fondo de Cooperaci´on Internacional en Ciencia y Tecnolog´ıa
(FONCICYT) and Direcci´on General de Asuntos del Personal Academico (DGAPA),
Mex-ico; Nederlandse Organisatie voor Wetenschappelijk Onderzoek (NWO), Netherlands; The Research Council of Norway, Norway; Commission on Science and Technology for
Sustain-able Development in the South (COMSATS), Pakistan; Pontificia Universidad Cat´olica del
Per´u, Peru; Ministry of Science and Higher Education and National Science Centre, Poland;
Korea Institute of Science and Technology Information and National Research Foundation of Korea (NRF), Republic of Korea; Ministry of Education and Scientific Research, Insti-tute of Atomic Physics and Ministry of Research and Innovation and InstiInsti-tute of Atomic Physics, Romania; Joint Institute for Nuclear Research (JINR), Ministry of Education and Science of the Russian Federation, National Research Centre Kurchatov Institute, Russian Science Foundation and Russian Foundation for Basic Research, Russia; Ministry of Ed-ucation, Science, Research and Sport of the Slovak Republic, Slovakia; National Research Foundation of South Africa, South Africa; Swedish Research Council (VR) and Knut & Al-ice Wallenberg Foundation (KAW), Sweden; European Organization for Nuclear Research, Switzerland; Suranaree University of Technology (SUT), National Science and Technol-ogy Development Agency (NSDTA) and Office of the Higher Education Commission under NRU project of Thailand, Thailand; Turkish Atomic Energy Agency (TAEK), Turkey; Na-tional Academy of Sciences of Ukraine, Ukraine; Science and Technology Facilities Council (STFC), United Kingdom; National Science Foundation of the United States of America (NSF) and United States Department of Energy, Office of Nuclear Physics (DOE NP), United States of America.
A Number density Nch and P pT distributions with ptrackT > 0.5 and
1.0 GeV/c
The fully corrected distributions of the averaged charged-particle number and summed-pT
densities as a function of pleadingT , in the Toward, Transverse, and Away regions for the
JHEP04(2020)192
ch N) ϕ ∆ η ∆ ev N 1/( 2 4 6 ALICE = 13TeV s pp, Data PYTHIA 8 Monash 2013 EPOS LHC | < 0.8 η , | c > 0.5 GeV/ track T p Toward region ) c (GeV/ leading T p 5 10 15 20 25 30 35 40 MC/Data 0.8 1 ) c (GeV/ T p Σ) ϕ ∆ η ∆ ev N 1/( 5 10 15 ALICE = 13TeV s pp, Data PYTHIA 8 Monash 2013 EPOS LHC | < 0.8 η , | c > 0.5 GeV/ track T p Toward region ) c (GeV/ leading T p 5 10 15 20 25 30 35 40 MC/Data 0.8 1 1.2 ch N) ϕ ∆ η ∆ ev N 1/( 1 2 3 ALICE = 13TeV s pp, Data PYTHIA 8 Monash 2013 EPOS LHC | < 0.8 η , | c > 0.5 GeV/ track T p Transverse region ) c (GeV/ leading T p 5 10 15 20 25 30 35 40 MC/Data 0.8 1 ) c (GeV/ T p Σ) ϕ ∆ η ∆ ev N 1/( 1 2 3 ALICE = 13TeV s pp, Data PYTHIA 8 Monash 2013 EPOS LHC | < 0.8 η , | c > 0.5 GeV/ track T p Transverse region ) c (GeV/ leading T p 5 10 15 20 25 30 35 40 MC/Data 0.8 1 ch N) ϕ ∆ η ∆ ev N 1/( 2 4 ALICE = 13TeV s pp, Data PYTHIA 8 Monash 2013 EPOS LHC | < 0.8 η , | c > 0.5 GeV/ track T p Away region ) c (GeV/ leading T p 5 10 15 20 25 30 35 40 MC/Data 0.8 0.9 1 1.1 ) c (GeV/ T p Σ) ϕ ∆ η ∆ ev N 1/( 2 4 6 8 ALICE = 13TeV s pp, Data PYTHIA 8 Monash 2013 EPOS LHC | < 0.8 η , | c > 0.5 GeV/ track T p Away region ) c (GeV/ leading T p 5 10 15 20 25 30 35 40 MC/Data 0.8 1 1.2Figure 11. Number density Nch (left) and P pT (right) distributions as a function of pleadingT compared to MC predictions in Toward (top), Transverse (middle), and Away (bottom) regions for ptrack
T > 0.5 GeV/c. The shaded areas in the upper panels represent the systematic uncertainties and vertical error bars indicate statistical uncertainties. In the lower panels, the shaded areas are the sum in quadrature of statistical and systematic uncertainties from the upper panels . No uncertainties are given for the MC calculations.
JHEP04(2020)192
ch N) ϕ ∆ η ∆ ev N 1/( 2 4 6 ALICE = 13TeV s pp, Data PYTHIA 8 Monash 2013 EPOS LHC | < 0.8 η , | c > 1.0 GeV/ track T p Toward region ) c (GeV/ leading T p 5 10 15 20 25 30 35 40 MC/Data 0.8 1 ) c (GeV/ T p Σ) ϕ ∆ η ∆ ev N 1/( 5 10 15 ALICE = 13TeV s pp, Data PYTHIA 8 Monash 2013 EPOS LHC | < 0.8 η , | c > 1.0 GeV/ track T p Toward region ) c (GeV/ leading T p 5 10 15 20 25 30 35 40 MC/Data 0.8 1 1.2 ch N) ϕ ∆ η ∆ ev N 1/( 1 2 3 ALICE = 13TeV s pp, Data PYTHIA 8 Monash 2013 EPOS LHC | < 0.8 η , | c > 1.0 GeV/ track T p Transverse region ) c (GeV/ leading T p 5 10 15 20 25 30 35 40 MC/Data 0.6 0.8 1 ) c (GeV/ T p Σ) ϕ ∆ η ∆ ev N 1/( 1 2 3 ALICE = 13TeV s pp, Data PYTHIA 8 Monash 2013 EPOS LHC | < 0.8 η , | c > 1.0 GeV/ track T p Transverse region ) c (GeV/ leading T p 5 10 15 20 25 30 35 40 MC/Data 0.6 0.8 1 ch N) ϕ ∆ η ∆ ev N 1/( 2 4 ALICE = 13TeV s pp, Data PYTHIA 8 Monash 2013 EPOS LHC | < 0.8 η , | c > 1.0 GeV/ track T p Away region ) c (GeV/ leading T p 5 10 15 20 25 30 35 40 MC/Data 0.8 0.9 1 1.1 ) c (GeV/ T p Σ) ϕ ∆ η ∆ ev N 1/( 2 4 6 8 ALICE = 13TeV s pp, Data PYTHIA 8 Monash 2013 EPOS LHC | < 0.8 η , | c > 1.0 GeV/ track T p Away region ) c (GeV/ leading T p 5 10 15 20 25 30 35 40 MC/Data 0.8 1 1.2Figure 12. Number density Nch (left) and P pT (right) distributions as a function of pleadingT and the comparisons to MC predictions in Toward (top), Transverse (middle), and Away (bottom) regions for ptrack
T > 1.0 GeV/c. The shaded areas in the upper panels represent the systematic uncertainties and vertical error bars indicate statistical uncertainties. In the lower panels, the shaded areas are the sum in quadrature of statistical and systematic uncertainties from the upper panels. No uncertainties are given for the MC calculations.
JHEP04(2020)192
Open Access. This article is distributed under the terms of the Creative Commons
Attribution License (CC-BY 4.0), which permits any use, distribution and reproduction in
any medium, provided the original author(s) and source are credited.
References
[1] P. Bartalini and J.R. Gaunt, Multiple parton interactions at the LHC,Adv. Ser. Direct. High Energy Phys. 29 (2018) 1[INSPIRE].
[2] UA1 collaboration, Hadronic jet production at the CERN proton-anti-proton collider,Phys. Lett. B 132 (1983) 214[INSPIRE].
[3] UA1 collaboration, Production of low transverse energy clusters in ¯pp collisions at √
s = 0.2 TeV to 0.9 TeV and their interpretation in terms of QCD jets,Nucl. Phys. B 309 (1988) 405[INSPIRE].
[4] UA1 collaboration, A study of the general characteristics of p¯p collisions at √s = 0.2 TeV to 0.9 TeV,Nucl. Phys. B 335 (1990) 261[INSPIRE].
[5] CDF collaboration, Charged jet evolution and the underlying event in p¯p collisions at 1.8 TeV,Phys. Rev. D 65 (2002) 092002[INSPIRE].
[6] CDF collaboration, The underlying event in hard interactions at the Tevatron ¯pp collider, Phys. Rev. D 70 (2004) 072002[hep-ex/0404004] [INSPIRE].
[7] R. Field, Min-bias and the underlying event at the LHC,Acta Phys. Polon. B 42 (2011) 2631[arXiv:1110.5530] [INSPIRE].
[8] CDF collaboration, Studying the underlying event in Drell-Yan and high transverse momentum jet production at the Tevatron,Phys. Rev. D 82 (2010) 034001
[arXiv:1003.3146] [INSPIRE].
[9] CMS collaboration, First measurement of the underlying event activity at the LHC with√ s = 0.9 TeV,Eur. Phys. J. C 70 (2010) 555[arXiv:1006.2083] [INSPIRE].
[10] ATLAS collaboration, Measurement of underlying event characteristics using charged particles in pp collisions at√s = 900 GeV and 7 TeV with the ATLAS detector,Phys. Rev. D 83 (2011) 112001[arXiv:1012.0791] [INSPIRE].
[11] ALICE collaboration, Underlying event measurements in pp collisions at √s = 0.9 and 7 TeV with the ALICE experiment at the LHC,JHEP 07 (2012) 116[arXiv:1112.2082] [INSPIRE].
[12] ATLAS collaboration, Measurement of the underlying event in jet events from 7 TeV proton-proton collisions with the ATLAS detector,Eur. Phys. J. C 74 (2014) 2965 [arXiv:1406.0392] [INSPIRE].
[13] ATLAS collaboration, Measurement of charged-particle distributions sensitive to the underlying event in√s = 13 TeV proton-proton collisions with the ATLAS detector at the LHC,JHEP 03 (2017) 157[arXiv:1701.05390] [INSPIRE].
[14] CMS collaboration, Measurement of the underlying event in the Drell-Yan process in proton-proton collisions at√s = 7 TeV,Eur. Phys. J. C 72 (2012) 2080[arXiv:1204.1411] [INSPIRE].
[15] ATLAS collaboration, Measurement of distributions sensitive to the underlying event in inclusive Z-boson production in pp collisions at√s = 7 TeV with the ATLAS detector,Eur. Phys. J. C 74 (2014) 3195[arXiv:1409.3433] [INSPIRE].


![Figure 7. Comparison of number density in the plateau of the Transverse region with lower energy data taken from [ 5 , 11 ] and dN ch /dη in minimum-bias events (scaled by 1/2π) [ 54 ]](https://thumb-eu.123doks.com/thumbv2/123dokorg/4918410.51181/19.892.240.653.128.602/figure-comparison-number-density-plateau-transverse-region-minimum.webp)
