eISSN: 2171-9845 http://dx.doi.org/10.5424/fs/2015243-07855 Instituto Nacional de Investigación y Tecnología Agraria y Alimentaria (INIA)
RESEARCH ARTICLE OPEN ACCESS
An index for the assessment of degraded Mediterranean forest
ecosystems
Giuseppe Modica1*, Angelo Merlino2, Francesco Solano2 and Roberto Mercurio1,3
1‘Mediterranea’ University of Reggio Calabria, Department of Agricultural, Food, and Environmental Sciences, Reggio Calabria, Italy. 2 University of Tuscia, Department of Agriculture, Forests, Nature and Energy (DAFNE), Viterbo, Italy. 3 Italian Society of Forest Restoration
(ISFR) c/o University of Tuscia, Department Department of Agriculture, Forests, Nature and Energy (DAFNE), Viterbo, Italy.
Abstract
Aim of study: Diagnosing the degradation degree of forest ecosystems is the basis for restoration strategies. However, there is
no literature documenting how to quantify the forest degradation degree by using synthetic indicators, also because there is not a widely accepted definition for “forest degradation” and “degraded forest”. Although there are many definitions of forest degradation that converge on the loss of ecosystem services, still today there are no largely accepted methods that give operational guidance to help in defining it. In the present research, with the aim to assess the degree of forest degradation, an integrated index - FDI, Forest Degradation Index - was developed.
Area of study: In this first application, the FDI was applied and validated at stand level in two different Mediterranean forest
types in two different case studies: Madonie and Nedrodi regional Parks (Sicily, Italy). The first dominated by sessile oak [Quercus
petraea (Matt.) Liebl. subsp. austrotyrrhenica Brullo, Guarino & Siracusa], the second dominated by cork oak (Quercus suber L.). Material and methods: FDI is a synthetic index structured starting from representative and relatively easily detectable parameters.
Here, we propose a set of six indicators that should be assessed to determine the forest degradation: Structural Index (SI), Canopy Cover (CC), Natural Regeneration Density (NRD), Focal Species of Degradation (FSD), Coarse Woody Debris (CWD), and Soil Depth (SD). FDI, here proposed and discussed, has been based on a MCDA (Multi-Criteria Decision Analysis) approach using the Analytic Hierarchy Process (AHP) technique, and implemented in order to contribute in finding simple indicators useful for forest restoration purposes that have an eco-functional basis.
Main results: An integrated index of forest degradation has been defined. FDI values are comprised in the closed interval [0, 10],
ranging from class I (Higher ecological functionality) to class IV (Lower ecological functionality). A forest fallen in the FDI-IV class can be defined degraded. In this first application, degradation occurs in SA-4 and in SB-4 where the lowest values (qualitative and quantitative) of the indicators were recorded and the FDI reach the minimum value.
Research highlights: FDI has proved to be a useful tool at stand level in identifying a threshold value below which a forest can
be termed as ‘degraded’. In turn, FDI assumes the meaning of descriptor of the ecological functionality. Future development of the FDI will provide an extension of the application at landscape scale exploiting the potential advantages in coupling MCDA and GIS (Geographical Information Systems) techniques.
Keywords: Forest Degradation Index (FDI); Sustainable Forest Management (SFM); Mediterranean Forest Landscape;
Multi-Criteria Decision Analysis (MCDA) approach; Analytic Hierarchy Process (AHP).
Abbreviations: Sustainable Forest Management (SFM); Decision-Making (DM); Multi-Criteria Decision Analysis (MCDA);
Decision Makers (DMs); Analytic Hierarchy Process (AHP); Forest Degradation Index (FDI); Site A (SA); Site B (SB); Structural Index (SI); Canopy Cover (CC); Coarse Woody Debris (CWD); Natural Regeneration Density (NRD); Focal Species of Degradation (FSD); Soil Depth (SD); Pairwise Comparison Matrix (PCM); Pairwise Comparison (PC); Consistency Index (CI); Random Index (RI); Consistency Ratio (CR); Weighted Linear Combination (WLC); Stems density (St); Aggregating Individual Judgment (AIJ); Degradation Index (DI); Restoration Index (RI); GIS (Geographical Information Systems).
Citation: Modica, G., Merlino, A., Solano, F., Mercurio, R. (2015). An index for the assessment of degraded Mediterranean
forest ecosystems. Forest Systems, Volume 24, Issue 3, e037, 13 pages. http://dx.doi.org/10.5424/fs/2015243-07855.
Received: 12 Apr 2015. Accepted: 20 Jul 2015
Copyright © 2015 INIA. This is an open access article distributed under the terms of the Creative Commons Attribution-Non
Commercial (by-nc) Spain 3.0 Licence, which permits unrestricted use, distribution, and reproduction in any medium, provided the original work is properly cited.
Funding: The autor(s) received no specific funding for this work.
Competing interests: The authors have declared that no competing interests exist. Correspondence should be addressed to Giuseppe Modica: [email protected]
Introduction
Mediterranean forests have been degraded since the ancient time mainly by overgrazing and forest fires (Quezel & Medail, 2003). As a response to widespread forest loss and degradation, restoration of forest eco-systems is increasingly being implemented in many parts of the world (Lamb et al., 2005; Rey Benayas et al., 2009; Van Andel & Aronson, 2012). In this direc-tion, forest degradation being increasingly considered in global policy processes that deal with biodiversity, climate change, and forest management (Thompson et al., 2013), and it is directly related to human well-being (depletion of water resources, spread of induced flooding, limitation of the forest resources use) (Mer-curio, 2010). This is specifically true for two of the most interesting forest native species such as Quercus suber L. and Quercus petraea (Matt.) Liebl.
Moreover, the restoration of the degraded sites should represents one of the major target for the conservation of biological diversity in Mediterranean area. Neverthe-less, still today one of the current scientific questions is focused on detecting a “degraded forest” (Holl & Aide, 2011). Assessing forest degradation is a very complex question, first because there is not an accepted definition of “forest degradation” and/or “degraded forest”. In fact, stakeholders differently perceive forest degradation in relation to their different cultural back-grounds (e.g., biodiversity conservation, carbon seques-tration, wood production, soil conservation, etc.) (Simula, 2009; Lund, 2009; Sasaki & Putz, 2009; Putz & Redford, 2010; FAO, 2011). The definition proposed by FAO (2001) according to which “Forest degradation is changes within the forest which negatively affect the structure or function of the stand or site, and thereby lower the capacity to supply products and/or services” represents the start point of the present research. Fol-lowing what stated in this definition, forest degradation must be expressed through indicators able to provide quantitative information, but to be of practical use they need to be easily measured, repeatable, cost-effective and of ecological significance. Lacking a holistic ap-proach, single-indicators are selected to face single aspects. In this way, if “forest degradation” focuses on biological conservation, indicators such as species com-position, stand structure and functional processes should be chosen (Larsson, 2001). On the other hand, if “forest degradation” is related to the global change mitigation, indicators should point out the loss of trees and their carbon stocks down (Sazaki et al., 2011). Synthetizing, a comprehensive index able to detect “forest degrada-tion” and to support the prioritization of sites for forest restoration is needed (Wang et al., 2010; Ochoa-Gaona et al., 2010; Orsi et al., 2011; Thompson et al., 2013).
Generally speaking, to guarantee adequate goods and services for future generations and solve many conser-vation problems, forest policies should be addressed according to three main lines: managing the forest areas sustainably, protecting remnant natural forests with minimal human alteration that provide the baselines for scientific research, and restoring the degraded for-est areas. Sustainable Forfor-est Management (SFM) re-quires methods and approaches that recognize many variables and conflicting objectives and constraints. In more details, requires Decision-Making (DM) ap-proaches that examine trade-offs between often compet-ing/conflicting managing objectives (timber harvesting, biodiversity conservation, recreation, etc.), according to the economic, environmental, and social dimension of sustainability. Multi-Criteria Decision Analysis (MCDA) can support Decision Makers (DMs) in evaluating alternatives by taking into account multiple criteria in an explicit manner. The analysis of the spe-cific literature shows that MCDA is a useful and widely used approach for suggesting solutions in the SFM. More specifically, MCDA methods and proce-dures have been widely applied over the last three decades in solving forest resource management prob-lems (Ananda & Herath, 2009) and several scholars have previously made a comprehensive review: Men-doza & Martins (2006) reviewed the use of MCDA in natural resource management while with specific refer-ence to the forest planning and management the works of Pukkala (2002), Kangas & Kangas (2005), Diaz-Balteiro & Romero (2008), Ananda & Herath (2009) provide the on-going state of the art. These reviews also highlight that there is an increasingly interest on MCDA by DMs and planners involved in forest plan-ning and management, also outside the scientific com-munity. To deal with numerous and often-conflicting objectives/alternatives, at least two critical issues must be faced in DM problems (Tzeng & Huang, 2011): defining the preference structure expressed by DMs and identifying the correct weights of criteria/alterna-tives matching their preferences. Over the last 50 years, an extensive literature has proposed several multi-criteria methods and techniques dealing with theoreti-cal and practitheoreti-cal issues on DM (Vizzari & Modica, 2013). Among these, the Analytic Hierarchy Process (AHP) (Saaty, 1977; Saaty, 1980) has been proposed to derive the relative criteria/alternatives weights ac-cording to the appropriate hierarchical system (Saaty, 1977; Saaty, 1980). Moreover, with specific reference to the objective of the present research, since its first application (Mendoza & Sprouse, 1989), AHP has been widely applied in forest planning and management.
Practitioners appreciate AHP for its simplicity and flexibility, and because it allows relationships between
factors – criteria and alternatives – to be established according to the DMs preferences expressed as ordinal language (judgments) and then converted into cardinal numbers. Considering its specific approach, AHP helps to capture both qualitative and quantitative aspects of a decision and provides a powerful yet simple way of weighting criteria, consequently reducing bias in DM. Indeed, most relevant criticism on the AHP concerns the lack of mathematical foundation of the scale used to convert ordinal judgments into cardinal numbers and the resulting limitation caused by this structure (Özcan et al., 2011). The use of a Pairwise Comparison Matrix (PCM) to obtain a ratio scale of measurement both for tangible and intangible factors is another recognized advantage of the AHP. In fact, the PCM effectively allows to overcome the human difficulty in simultane-ously evaluating the importance of all the factors in-cluded in the evaluation. The AHP does not assume the complete transitivity of DM’s preferences and a certain degree of inconsistency is allowed, which is realistic in most decision scenarios. In this respect, one of the most important advantages is that AHP allows for checking the inconsistencies in judgments provided by experts reducing bias in DM.
In the general framework of MCDA methods applied in defining SFM, the aim of the present research is to propose a transparent, synthetic and adaptive index at stand level – i.e. the Forest Degradation Index (FDI) – focusing on forest ecological functionality. FDI is a holistic index developed through an AHP-MCDA ap-proach and based on representative ecological and silvicultural parameters. Referring to the different
nature of data and indicators considered for the FDI implementation, the AHP procedure is currently one of the most popular methods for obtaining criteria weights in MCDA from a large amount of heterogeneous data.
Materials and Methods
Study-sites
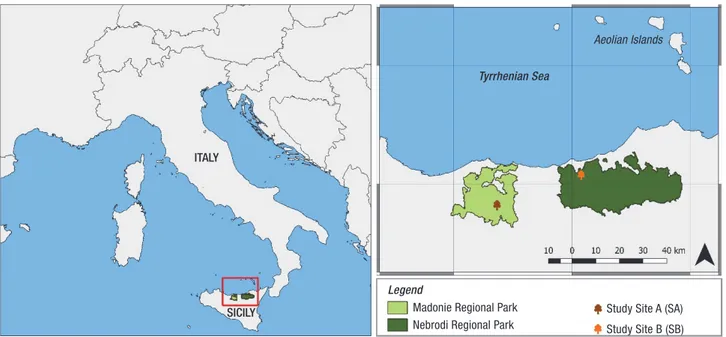
The first study-site [Site A (SA)] “Bosco Pomieri”, falls in the Madonie regional Park (Sicily, Italy), in a strict natural reserve (category 1a Dudley, 2008) be-tween 1,200 and 1,500 m a.s.l. (Figure 2).
Rainfall usually occurs between October and March, with an average of 779 mm per year. The average an-nual temperature is 13.8 °C (datasets refers to 84 years). According to the bioclimatic classification of Rivas-Martínez (2008), this site falls within the oce-anic-pluviseritonal Mediterranean bioclimatic unit, supramediterranean thermotype, lower humid ombro-type. The geological substratum is made up of nu-midic Flysch quartz arenite (Lentini & Vezzani, 1974). Soils are classified as Typic Xerochrepts, Lithic Xer-orthentsand Typic Xerorthents (Soil Survey Staff, 1999). The forest cover is dominated by Southern Ital-ian sessile oak [Quercus petraea (Matt.) Liebl. subsp. austrotyrrhenica Brullo, Guarino & Siracusa] (Brullo et al., 1999), whit a shrub layer of holly (Ilex aquifo-lium L.). The forest belongs to the Ilici-Quercetumaus-trotyrrhenicae (Ilici-Quercetumpetraeae Brullo & Marcenò) (Brullo, 1984) phytosociological association.
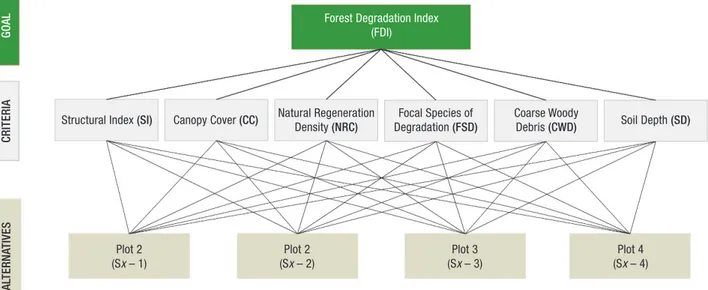
Figure 1. Decomposition of the Forest Degradation Index (FDI) into a hierarchy for each of the two investigated study-sites (Site
A, and Site B).
Forest Degradation Index (FDI)
Structural Index (SI) Canopy Cover (CC) Natural Regeneration Density (NRC) Degradation (FSD)Focal Species of Coarse Woody Debris (CWD) Soil Depth (SD)
Plot 4 (Sx – 4) Plot 3 (Sx – 3) Plot 2 (Sx – 2) Plot 2 (Sx – 1) GO AL CRITERIA AL TERNA TIVES
The second study-site [Site B (SB)] “Bosco Pantano Scuro”, falls in the Nebrodi regional Park (Sicily, Italy), in a general natural reserve (category II Dudley, 2008), between 400 and 800 m a.s.l. (Figure 2). Rainfall usu-ally occurs between September and March, with an average of 876 mm per year. The average annual tem-perature is 16.6 °C (datasets refers to 30 years). Ac-cording to the bioclimatic classification of Rivas-Martínez (2008), this site falls within the oceanic-pluviseritonal Mediterranean bioclimatic unit, lower meso-mediterranean thermotype, lower sub-humid ombrotype. The geological substratum is made up of Flysch (Lentini & Vezzani, 1974). Soils are clas-sified as Typic Haploxeralfs/Typic and/or Lithic Xer-orthents (Soil Survey Staff, 1999). The forest is domi-nated by cork oak (Quercus suber L.), sometimes mixed whit a holm oak (Quercus ilex L.), Gussone’s oak [Quercus gussonei (Borzì) Brullo] and downy oak (Quercus pubescens, Willd.). Phitosociologically it refers to the Genistoaristatae-Quercetumsuberis (Brullo, 1984) association.
Data survey
Based on a deep analysis of the specific scientific literature, a selection of the most significant descriptive parameters able to allowing a synthetic measure of forest degradation has been carried out. In more details, these parameters are able to express a gradient of eco-logical functionality and characterized by a relative ease of detection. With the aim to evaluate these pa-rameters in two representative Mediterranean forest
types, in year 2011 surveys have been carried out in 8 sample plots (4 per each study-site) based on qualitative and quantitative criteria of the variables under inves-tigation. Each sample plot of 2,500 m2 (50 m x 50 m)
differs in functionality degree, with maximum degree in sample Plot 1 and minimum degree in sample Plot 4, for each study-site (SA, SB). These plots were subjec-tively chosen to illustrate different degrees of degrada-tion.
Indicators of Forest Degradation
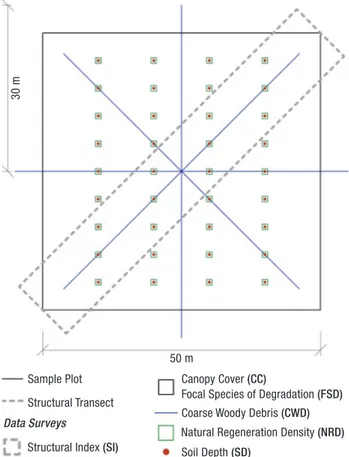
A set of six indicators was defined to implement FDI: Structural Index (SI), Canopy Cover (CC), Natu-ral Regeneration Density (NRD), Focal Species of Degradation (FSD), Coarse Woody Debris (CWD), and Soil Depth (SD). Figure 3 shows the adopted sampling scheme according to which data n indicators of forest degradation were surveyed in all 8 sample plots.
Structural Index (SI)
The Structural Index (SI) measures the stratification of trees (vertical distribution) according to different layers and can be used in measuring biodiversity in forest ecosystems (Kimmins, 1997; Barbeito et al., 2009). In each sample plot, a structural transect of 70.7 m x 12 m (848.4 m2) was located (Figure 3). For
each tree falling inside the transect, the following pa-rameters were collected: geographical position, DBH, total height, the height-to-base of the live crown,
Figure 2. Location of the two study-sites.
ITALY
SICILY
Legend
Madonie Regional Park Nebrodi Regional Park
Study Site A (SA) Study Site B (SB) Tyrrhenian Sea
4-crown radii (measured orthogonally in the N-S and E-W directions). Stand structure according to the Latham index was obtained using TSTRAT algorithm (Latham et al., 1998). TSTRAT defines multiple cut-off points based on tree heights and crown lengths and assigns individual trees to a vertical stratum depending on the relative position of tree crowns to these height cut-off points as follow:
CPS = 0.40 · CL + HBLC (1) where:
CPS is the cut-off point per stratum; CL is the crown length;
HBLC is the height-to-base of the live crown; 0.40 is a competition coefficient.
Canopy Cover (CC)
Canopy Cover (CC) is an important factor modulat-ing solar radiation along stand profile up to the ground level and involved in many ecological processes (McEl-hinny et al., 2005). In the present research, CC was calculated (in percent) by means of the Forest Vegeta-tion Simulator (FVS) software (USDA Forest Service) and corrected for crown overlap.
Natural Regeneration Density (NRD)
The analysis of the functional efficiency of the NR processes is a key element in assessing long-term population growth perspectives. NRD was sampled recording all tree species through systematic sampling of parallel alignment of subareas every 10 m along each alignment (5 subareas of 1 m2 per alignment) (Figure
3). It is considered NR all the tree species grown from seed with a DBH <2.5 cm (Mercurio, 2010). In each subarea, the number of seedlings, the species, the total height (in cm) was detected. Moreover, each subarea has been classified according to the position: (c) under canopy cover; (o) open area; (e) edge.
Focal Species of Degradation (FSD)
Many species are sensitive to forest degradation, and several examples are available about the effects of forest change on species populations and habitat quality (Lin-denmayer et al., 2002a; Lin(Lin-denmayer et al., 2002b; Colles et al., 2009). Some functional species (i.e. keystone spe-cies) are also the important ones that carry out roles in ecosystems affecting many other species, such that their loss results in progressive changes (Terborgh & Estes, 2010) and can indicate forest degradation (FAO, 2011).
For both two study-sites phytosociological surveys were carried out following the Braun-Blanquet (1964) method and its conventional scale of cover-abundance (+: very poor coverage, 1: <5%, 2: <5-25%, 3: 25-50%, 4: 50-75%, 5: coverage >75%). Every syntaxon was then classify as “focal species”, if typical of that as-sociation, or “unrelated species” if not.
To evaluate the real CC degree and therefore domi-nance/presence of the species, we proceeded to add together the individual degrees of coverage of the two types of species making then the ratio of the total using the following formula:
1−
∑
F−∑
nF F∑
−∑
nF ⎛ ⎝ ⎜⎜ ⎞⎠⎟⎟ (2) where:F is the sum of the coverage of focal species;
nF is the sum of the coverage of the unrelated species. Coarse Woody Debris (CWD)
Coarse Woody Debris (CWD), one of the Pan-Euro-pean indicators for SFM (MCPFE, 2007), is increas-ingly used as an indicator for the assessment of
biodiver-Figure 3. Sampling scheme of the field surveys.
50 m
30 m
Sample Plot Structural Transect Data Surveys
Structural Index (SI)
Canopy Cover (CC)
Focal Species of Degradation (FSD) Coarse Woody Debris (CWD) Natural Regeneration Density (NRD) Soil Depth (SD)
sity and forest ecosystems functionality (McComb & Lindenmayer, 2001; Humphrey et al., 2004). CWD consists of branches, stumps, stems of dead trees and shrubs that have fallen and lie on the ground (Zhou et al., 2007) and was estimated with the line intersect method (Van Wagner, 1968). Sampling was conducted along 9 sample lines of 30 m length (Figure 3). With reference to each piece of wood intersecting the sample line, only logs with a diameter >2.5 cm were recorded (length and diameter were detected). The CWD volume per hectare was calculated according to the following formula:
V =π2 8L di2⋅10000 i=1 n
∑
(3) where:V is volume of wood per hectare [m3 ha-1];
n is the number of intersecting logs; L is the length of the j-th sample line [m];
d is the diameter of the log where the sample line in-tersects the log [m];
10,000 is a correction factor [m2 ha-1].
Soil Depth (SD)
Soil Depth (SD) has a great importance on forest functionality and growth in the Mediterranean area (Romanyà & Vallejo, 2004). One of the direct effects of SD concerns the greater or smaller quantity of stor-able water exploitstor-able by the root (Dezi & Magnani, 2007), so that plant growth is directly influenced by soil water status (Campbell, 1985). Following the sam-pling scheme used for NRD, in each subarea SD was measured (in cm) through a soil auger.
The Forest Degradation Index (FDI)
The proposed FDI was tested and validated in two study-sites corresponding to two different Mediterra-nean forest types. The aggregation process of the above-mentioned parameters included in the FDI was carried out through the AHP, and differentiated for each of the two forest types investigated in the present re-search. Normally, in an AHP procedure, the decision problem is decomposed into a general objective, a set of criteria that specify the general objective decom-posed into sub-criteria, and, finally, to the lowest level of the hierarchy, the decision alternatives to be evalu-ated. In Figure 1, a decision tree showing the decom-position of FDI into a hierarchy has been provided.
FDI was implemented according to the following four steps.
Step 1. Weighting of indicators by means of AHP Following the AHP method, to derive indicators’ weights, judgments provided by the experts are organized as numeric data in a positive reciprocal matrix A (the PCM). Therefore, in a PCM if the priority of element i compared to element j is wij (relative weights), the
prior-ity of element j compared to element i is 1/wij. The
prior-ity of an element compared to it, is equal to 1 U (aii = 1).
So that, for a matrix of order n (where n is the total number of compared elements/criteria, also correspond-ing to the number of row/columns), (n (n–1)/2) com-parisons are required. The PCM is created starting from the PCs provided by the experts’ judgments. In formula:
A = a11 a12 ! a1n a21 a22 ! a2n " " # " an1 an2 ! ann ⎡ ⎣ ⎢ ⎢ ⎢ ⎢ ⎢ ⎤ ⎦ ⎥ ⎥ ⎥ ⎥ ⎥ (4) where
aij represents the PCs rating for attributes i and j.
Each expert makes a judgment wij of all pairs of the n
elements that include in the PCM as a number (aij)
fol-lowing the Saaty’s fundamental scale of absolute numbers (Saaty & Shang, 2011). In this scale, values range from 1 (indifference) to 9 (extreme importance, preference or likelihood); when compromise is needed, intermediate values 2,4,6,8 must be used (Saaty, 1977; Saaty, 1980; Saaty & Vargas, 2011; Saaty, 2013). In order to derive priorities, the eigenvector method has been proposed by Saaty (1980), in which the local priority vector w = (w1,...,
wn) is obtained by solving the equation Aw = λmaxw, where
λmax is the principal eigenvalue of the PCM. If all
judg-ments are perfectly consistent, then aik = aijajk for all i,j,
k =1,2,...,n. In practical problems with a large number of criteria/alternatives, PCMs quite inconsistent are gener-ally obtained. The degree of deviation from consistency of judgments is measured by means of a Consistency Index (CI) proposed by Saaty (1980):
CI =λmax−n
n −1 (5)
To obtain the Consistency Ratio (CR), the value of CI shall be divided by a correction value, the Random Index (RI) depending on the number of elements being compared. RI is the consistency index of a randomly generated PCM. In formula:
CR = CI
If the value of CR<0.10, the judgments expressed by the experts are consistent, otherwise it is necessary to revalue the PCM.
In this first application, two PCMs (one for each of forest types under investigation) were implemented. Considering that AHP supports group-DM through consensus (e.g., with the work of a facilitator), as well as by aggregating the individual PCMs, a consultation by means of a focus group of experts is expected in FDI implementation. Following the Aggregating Indi-vidual Judgment (AIJ) approach of Forman & Peni-wati (1998), individual preferences/judgments pro-vided by each expert are aggregated by means of a geometric mean. To this end, only consistent PCMs should be considered in the aggregation, excluding those not consistent (CR>0.1).
Step 2. Data normalization
Considering that the sox forest degradation indica-tors defining the FDI have different measurement scales, for their further processing a standardization procedure in a defined range of values is required. In the present research, the so-called Min-Max normaliza-tion technique has been used. This approach is suitable to find the best operating condition in cases where are known the limits of the scores produced by the variable (Min and Max values). Given a set of values {sk},
k = 1,2,….n, the normalized scores are given by:
′
s = s − min s
{ }
kmax s
{ }
k − min s{ }
k(7) The Min-Max distribution resultant maintains original distribution of the scores except for a scale factor, and shows all the scores in a common range [0, 1].
Step 3. Data aggregation
In order to obtain the FDI, the WLC method (Weight-ed Linear Combination) was appli(Weight-ed for each of the two PCMs. Therefore: FDI = 10⋅ xij⋅wij* j=1 n=6
∑
(8) where:10 is a correcting factor so as to obtain a [0, 10] range for the FDI;
n=6 is the number of input variables (i.e. the six indi-cators of forest degradation);
xij indicates the normalized value that the variable j-th
assumes (i.e. each of the six forest indicators);
wij*is the weight of each indicator of forest degradation
obtained following the AIJ approach and normalized so that the sum is equal to 1.
Step 4. Data classification
In this final step, the results were classified into four classes ranging from I to IV, and each representing a different condition of ecological functionality:
– I [8-10]; – II [6-8]; – III [3-6]; – IV [0-3].
A forest fallen in the FDI-I class shows a good eco-logical functionality while a forest fallen in the FDI-IV class can be defined as ‘degraded’.
Results
Site Analysis
The dendrometric characteristics (Table 1) vary between Plot 1 (higher functional levels) and Plot 4 (lower functional levels) of the two study sites. The Stems density (St) ranges from 428 to 224 ha-1 in SA,
with the minimum value higher than the ones found by Portoghesi et al. (2005) for Turkey oak woodlands (Q. cerris L.) of central Italy. In SB, St ranges from 352 to 124 ha-1, far below the values found for other
cork oak woodlands (Aronson et al., 2009; Barreca et al., 2010; Rives et al., 2012).There is a marked de-crease in G ha-1 (from 21.6 to 7.6 m2) in SA with values
below the minimum level of 13.1 m2 found for the same
species in France (Bergès et al., 2005; Bergès & Bal-andier 2009). In SB values decreased from 23.7 to 2.7 m2. Other authors reports 49.3 m2 of G ha-1
(Bar-reca et al., 2010) for cork oak woodlands in Italy and 23.9 m2 in Morocco (Ajbilou et al., 2006). Volume per
hectare (from 278.6 to 72 m3 in SA and from 191.2 to
10.1 m3 in SB) is, in most of the plots, far below the
minimum value of 250 m3 (Agrimi et al., 1991) and
396 m3 (Portoghesi et al., 2005) founded for other oaks
woodland in Italy.
Analyzing the results of the six indicators included in the FDI, coming from the surveyed two study- sites (Table 2), it is possible to note how in SA-1 and SB-1
rates which leads to strong negative effects on recruit-ment and adult survival of trees. Disturbance can be clearly highlighted analyzing the trend of the FSD indicator. In fact, the increase in percentage of coverage (and therefore presence) of the FSD, which is clear in SA-4 and SB-4, coupled with a marked decrease in the presence of typical species of the two forest types (Table 2). Most of the species found in the herbaceous and shrub undergrowth, are typical of open spaces or at least of regressive ecological phases (Manning et al., 2013).
Deep soils favor NR and long-term growth of forest vegetation (WDNR, 2011). In that sense, low values of SD founded in SA-4 and SB-4 (1.5 cm) can be con-the highest values of NRD were detected (respectively,
6.2 and 10 seedlings m-2) and so the stand can be
con-sidered well regenerated and therefore able to perpetu-ate itself, as well as report Kelly (2002), Ádám et al. (2013) and Ligot et al. (2013) for sessile oak stands and Aronson et al. (2009) for cork oak stands. Over-grazing and human disturbances (such as the removal of dead wood and illegal cuts) lead to the depletion of the floristic composition and the presence of synan-thropic species such as Asphodelus ramosus L., Urtica dioica L. e Pteridium aquilinum (L.) Kuhn detected in SA-4 and SB-4 where NR is absent. This indicates that impacts are significant, or that the disturbances, if re-peated over time, can drastically affect the net growth
Table 1. Topographic and dendrometric characteristics of the eight sample plots surveyed in the two study-sites (SA,
Study-site A; SB, Study-Study-site B). St: Stems density; G: Basal area; h: Height (min) average (max); DBH: Diameter at Breast Height (min) average (max); V: Volume; ±: standard deviation.
Plot Elevation [m a.s.l.] Aspect [n° haSt -1] [m2 haG -1] [m]h DBH[cm] V [m3 ha-1]
SA-1 1381 SE 428 21.6 (5.5) 19.5 (24)±4.7 (4) 30.3 (87)±20.2 278.6 SA-2 1310 N 912 30.4 (2) 12 (20)±2.8 (3) 20.1 (95)±26.6 272.2 SA-3 1322 N 727 13.3 (3) 10 (14)±3.4 (3) 15 (58)±15.4 83 SA-4 1334 N 224 7.6 (6) 9 (11)±4.7 (7) 15.1 (25)±8.9 72 SB-1 600 NW 352 23.7 (3.5) 11 (13.3)±2.1 (8) 29.3 (40)±7.5 191.2 SB-2 670 NW 408 14.2 (1.8) 8 (10.2)±1.9 (4) 21 (34)±6.8 58.5 SB-3 660 SW 280 15.5 (4.5) 7 (10)±1.3 (13) 26.5 (40)±5.8 61.6 SB-4 500 S 124 2.7 (5.4) 7 (8)±0.7 (14) 16.6 (20)±1.6 10.1
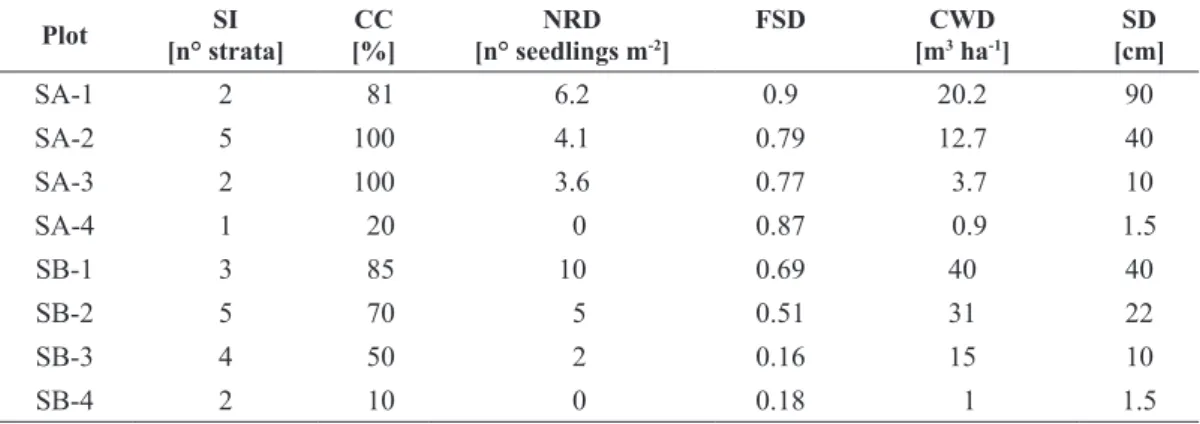
Table 2. Forest degradation indicators of the eight sample plots surveyed in the two study-sites (SA,
Study-site A; SB, Study-site B). SI, Structural Index; CC, Canopy Cover; NRD, Natural Regeneration Density; FSD, Focal Species of Degradation; CWD, Coarse Woody Debris; SD, Soil Depth
Plot [n° strata]SI [%]CC [n° seedlings mNRD -2] FSD [mCWD3 ha-1] [cm]SD
SA-1 2 81 6.2 0.9 20.2 90 SA-2 5 100 4.1 0.79 12.7 40 SA-3 2 100 3.6 0.77 3.7 10 SA-4 1 20 0 0.87 0.9 1.5 SB-1 3 85 10 0.69 40 40 SB-2 5 70 5 0.51 31 22 SB-3 4 50 2 0.16 15 10 SB-4 2 10 0 0.18 1 1.5
and Rural Landscape Planning. The discussion among experts allows us to evaluate and to share the relative importance of the considered factors in determining the FDI for both forest types investigated. At the end, all experts participating in the discussion expressed their own preferences each filling out a PCM. At the end, one PCM for sessile oak and three for cork oak were not consistent (CR>0.1), and therefore excluded from the aggregation. Therefore, individual PCMs for each of the two oak species under investigation were aggre-gated by means of the AIJ approach (Forman & Peni-wati, 1998), and the following parameters were obtained (Table 3): the importance weight of each indicator, the Consistency Index (CI) and the Consistency Ratio (CR).
As reported in Table 3, good values of these indices have been obtained: CI = 0.004 and CR = 0.003 for SA; CI = 0.005 and CR = 0.004 for SB. The eigen-value λmax, to which corresponds the normalized vector
of weights, is equal to 6.022 for SA and 6.027 for SB. The sum of the parameters value, multiplied by their importance weight, has provided a final value of the FDI for each plot of each site, according to the follow-ing general formulas:
Sessile oak (Site A)
FDI = [SI · (0,17)] + CC · (0,16) + NRD · (0,14) + + FSD · (0,22)] + CWD · (0,19) + SD · (0,12)] (9)
Cork oak (Site B)
FDI = [SI · (0,12)] + CC · (0,16) + NRD · (0,15) + + FSD · (0,21)] + CWD · (0,20) + SD · (0,16)] (10) sidered critical. In fact, seeds, once fallen on the ground
do not find the conditions to germinate and grow. In addition, it should also consider the loss of seed caused by bird predation and overgrazing. SI indicator is 1 in SA-4 and 2 in SB-4 (Table 2), where structure is greatly simplified due to the lack of a vertical articula-tion of the tree layer and for the absence of a shrub layer. These two plots have also a low degree of CC, 20 % in SA-4 and 10 % in SB-4, which corresponds to the minimum threshold in discriminating a forest ac-cording to FAO (2001).
The amount of CWD is equal to 0.9 m3 ha-1 in SA-4
(Table 2), below the threshold of 134 m3 ha-1 found in
sessile oak woodlands (Petritan et al., 2012), 91.4 and 214.2 m3 ha-1 (Schnitzler & Borlea, 1998; Wijdeven,
2004) in mixed woods with beech; in SB-4 is equal to 1 m3 ha-1 (Table 2), even this less than 65.4 m3 ha-1
(Carvalho, 2011) and 83 m3 ha-1 reported by Manning
et al. (2013). Both plots do not exceed the minimum threshold of 10 m3 ha-1, indicated by Vallauri (2005)
for the forests of the Central-Southern Italy. Application of the Forest Degradation Index (FDI)
As reported in the Material and methods section, considering significant ecological and silvicultural dif-ferences of the two forest types investigated in the present research, a different AHP procedure has been implemented for each of them. With the objective to discuss the general aspects of the problem and to assign judgments to PCMs according to the goal, in this first application, a focus group has been organized with 10 experts in the field of Ecology, Geobotanic, Silviculture
Table 3. Preferences and ranking of the six indicators of the Forest Degradation Index (FDI) coming from the two Pairwise
Comparison Matrices (PCMs): Sessile oak (Site A) and Cork oak (Site B)
Indicators
Sessile oak (Site A - SA) Cork oak (Site B - SB) Weighted Sum
Vector Normalized weight Weighted Sum Vector Normalized weight
(SI) – Structural Index 1.036 0.17 0.723 0.12
(CC) – Canopy Cover 0.9816 0.16 0.966 0.16
(NRD) – Natural Regeneration Density 0.8639 0.14 0.891 0.15
(FSD) – Focal Species of Degradation 1.3168 0.22 1.264 0.21
(CWD) – Coarse Woody Debris 1.1158 0.19 1.211 0.20
(SD) – Soil Depth 0.7085 0.12 0.970 0.16
λmax – Lambda max 6.022 6.027
CI – Consistency Index 0.004 0.005
CR – Consistency Ratio 0.003* 0.004*
there are many definitions of forest degradation that converge on the loss of ecosystem services (Simula, 2009), still today there are no largely accepted methods that give operational guidance to help in assessing it.
With specific reference to forest management, MCDA methods have been applied to better meet the many challenges that forest management is facing in evolving towards sustainable management/adaptive management (Kangas & Kangas, 2005; Ananda & Herath, 2009). These techniques can usefully contrib-ute in SFM by facilitating collaborative DM and con-flict resolution and a large number of operational ex-periences can be found in literature. Among these, due to the ease of application coupled with flexibility and transparency in its implementation, applications based on AHP demonstrated an actual proliferation in the last two decades. Using an AHP-MCDA approach it was possible to consider more elements at the same time considering the functionality of a forest ecosystem from an ecological and silvicultural point of view and over-coming the problem of working with individual indica-tors, which do not permit a complete analysis of the variables that lead to degradation. The AHP has allowed both the interaction than the feedback within the set of variables (internal dependency) and among variables (external dependency). This feedback loop better re-flects complex interaction effects in human society, especially when the risk and uncertainty are involved. The methodology has provided a way to combine evaluations and measurements to derive the scaling of the priorities for distribution of the influence of each parameter in the decision.
FDI here presented and discussed after its first ap-plication and validation in two Mediterranean forest types, has proved to be a useful tool at stand level in identifying a threshold value below which a forest subjected to a regime of continuous and repeated dis-turbances loses its ecological functionality and natural resilience, and therefore can be termed as ‘degraded’. Therefore it can be also useful in detecting the causes of degradation and the “tipping point” beyond which processes become irreversible if nothing is done. In addition, there is the possibility that the index can take a double biological meaning: as a Degradation Index (DI) for determining the threshold of ecological func-tionality and, in contrast, as a Restoration Index (RI) to evaluate increasing levels of functionality. In turn, the FDI assumes the meaning of descriptor of the eco-logical functionality. Furthermore, through the FDI it is possible re-defining a forest type joining, if neces-sary, the appropriate adjective “degraded”, thus iden-tifying those which require forest restoration practices. In this direction, FDI can represent a useful tool in defining planning actions leading to an effective SFM.
Discussion and Conclusions
According to the overall priority rating obtained by the AHP, FDI are sensitive mainly to two indicators, FSD and CWD. For example, in SA-4 and SB-4, as it results from the findings, high values of FSD coupled with the absence of NR and with a shallow soil affect the possibilities of success in regeneration dynamics, leading to a final value of FDI, which reaches the low-est values. This dynamic leads to a loss of functional-ity in agreement with what was found also by Dezi & Magnani (2007), Simula (2009) and FAO (2011). High levels of FDI correspond to high levels of ecological function and therefore a good chance of perpetuation over time. A forest fallen in the FDI-IV class can be defined degraded. Degradation occurs in SA-4 and in SB-4 where the lowest values (qualitative and quanti-tative) of the indicators were recorded and the FDI reach the minimum value (Class IV) (Figure 4).
Forest degradation is an arising topic issue in SFM. However, a rigorous evaluation to define the severity (especially at spatial large scales) (ITTO, 2002) is still lacking, also because of the different evaluations and the complexity characterizing these assessments. Although
Figure 4. Study-site A (left) and Study-site B (right). SA-1 and
SB-1): Plots where Forest Degradation Index (FDI) reached the highest values (I class); SA-4 and SB-4): Plots where FDI reached the lowest values (IV class).
SA1 SB1
Bergès L, Chevalier R, Dumas Y, Franc A, Gilbert JM, 2005. Sessile oak (Quercus petraea Liebl.) site index variations in relation to climate, topography and soil in even-aged high-forest stands in northern France. Ann For Sci 62: 391–402. http://dx.doi.org/10.1051/forest:2005035 Braun-Blanquet, J. 1964. Pflanzensoziologie. Grundzügeder
Vegetationskunde. Ed. 3. Springer Verlag, Wien, AU. 865 pp. Brullo S, 1984. Contributo alla conoscenza della vegetazione
delle Madonie Sicilia Settentrionale. Boll Acc Gioenia Sci Nat 16: 351–420.
Brullo S, Scelsi F, Siracusa G, Spampinato G, 1999. Syn-taxonomical and chorological considerations on the de-ciduous oak forest from Sicily and Calabria. Monti e Boschi 50: 16–29.
Campbell GS, 1985. Soil physics with BASIC: Transport mod-els for soil-plant systems. Developments in Soil Science vol. 14. Elsevier, Amsterdam, New York, USA. 149 pp. Carvalho JPF, 2011. Composition and structure of natural
mixed-oak stands in northern and central Portugal. For Ecol Manage 262: 1928–1937.
Colles A, Liow LH, Prinzing A, 2009. Are specialists at risk under environmental change? Neoecological, paleoeco-logical and phylogenetic approaches. Ecology Letters 12: 849–863. http://dx.doi.org/10.1111/j.1461-0248.2009. 01336.x
Dezi S, Magnani F, 2007. Effects of soil characteristics on functionality and growth of forest stands: a sensitivity analysis of the model 3-PG. For - RivSelvic Ed Ecol For 4: 298–309.
Diaz-Balteiro L, Romero C, 2008. Making forestry decisions with multiple criteria: A review and an assessment. For Ecol Manage. 255, 3222–3241.
FAO, Food and Agriculture Organization of the United Na-tions, 2001. Global Forest Resources Assessment 2000. Main Report. FAO Forestry Paper 140, Rome, Italy. FAO, Food and Agriculture Organization of the United
Na-tions, 2011. Assessing forest degradation - Towards the development of globally applicable guidelines. Forest Resource Assessment Working paper 177, Rome, Italy. Forman E, Peniwati K, 1998. Aggregating individual
judg-ments and priorities with the analytic hierarchy process. Eur J Oper Res 108: 165–169. http://dx.doi.org/10.1016/ S0377-2217(97)00244-0
Holl KD, Aide TM, 2011. When and where to actively restore ecosystems? Forest Ecology and Management 261: 1558–1563. http://dx.doi.org/10.1016/j.foreco.2010.07.004 Humphrey JW, Sippola AL, Lempérière G, Dodelin B, Al-exander KNA, Butler JE, 2004. Deadwood as an indicator of biodiversity in European forests: from theory to op-erational guidance. In: Monitoring and Indicators of For-est Biodiversity in Europe – From Ideas to Operational-ity. EFI Proceedings n. 51 (Marchetti M, ed). pp: 193–206. ITTO International Tropical Timber Organization, 2002.
ITTO guidelines for the restoration, management and rehabilitation of degraded and secondary tropical forests. Policy Development Series 13, 86 pp.
Kangas J, Kangas A, 2005. Multiple criteria decision support in forest management - the approach, methods applied, and experiences gained. For Ecol Manage 207: 133–143. The proposed index that will be further refined in
other forest types applications as well as further mon-itoring the two study-sites, can be considered advanta-geous both for its ease of application and the relative simplicity of the surveys to be made for the establish-ment of each indicator considered in the FDI calcula-tion. Future development of the FDI will provide an extension of the application at landscape scale exploit-ing the potential advantages in couplexploit-ing MCDA and GIS (Geographical Information Systems) techniques in the DM process. Moreover, a WebGIS platform al-lowing accessing to data and maps of the project through the Web will be provided. One of the most recognized advantages of this methodology is in pro-viding a very useful tool that improves land planning and decision making also by favoring the e-participa-tion of citizen since the earlier stages of the planning process (Pollino & Modica, 2013). In this direction, another development direction will deal with the in-volvement of local communities in order to improve public participation in forest management and planning.
References
Ádám R, Ódor P, Bölöni J, 2013. The effects of stand char-acteristics on the understory vegetation in Quercus petraea and Q. cerris dominated forests. Community Ecology 141: 101-109. http://dx.doi.org/10.1556/ComEc.14.2013.1.11 Agrimi M, Ciancio O, Portoghesi L, Pozzoli R, 1991. I
querceti di cerro e farnetto di macchia grande di Manzi-ana: struttura, trattamento e gestione. Cellul e Cart 5: 25-49.
Ajbilou R., Marañón T., Arroyo J, 2006. Ecological and bio-geographical analyses of Mediterranean forests of north-ern Morocco. Acta Oecologica 29: 104–113. http://dx.doi. org/10.1016/j.actao.2005.08.006
Ananda J, Herath G, 2009. A critical review of multi-criteria decision making methods with special reference to forest management and planning. Ecol Econ 68: 2535–2548. http://dx.doi.org/10.1016/j.ecolecon.2009.05.010 Aronson J, Pereira JS, Pausas JG, 2009. Cork Oak Woodlands
on the Edge: ecology, adaptive management and restora-tion. Island Press, Washington, D.C. USA. 315 pp. Barbeito I, Cañellas I, Montes F, 2009. Evaluating the
be-haviour of vertical structure indices in Scots pine forests. Ann For Sci 66: 710–710. http://dx.doi.org/10.1051/for-est/2009056
Barreca L, Marziliano P, Menguzzato G, Scuderi A, 2010. Stand structure and dead wood characterization in cork forest of Calabria region southern Italy. Forest@ 7: 158-168. http://dx.doi.org/10.3832/efor0628-007
Bergès L, Balandier P, 2009. Revisiting the use of soil water budget assessment to predict site productivity of sessile oak (Quercus petraea Liebl.) in the perspective of climate change. Eur J For Res 129: 199–208. http://dx.doi. org/10.1007/s10342-009-0315-1
Ochoa-Gaona S, Kampichler C, de Jong BHJ, Hernández S, Geissen V, Huerta E, 2010. A multi-criterion index for the evaluation of local tropical forest conditions in Mexico. For Ecol Manage 260: 618–627.
Orsi F, Geneletti D, Newton AC, 2011. Towards a common set of criteria and indicators to identify forest restoration priorities: An expert panel-based approach. Ecol Indic, 11: 337–347. http://dx.doi.org/10.1016/j.ec-olind.2010.06.001
Özcan T, Çelebi N, Esnaf Ş, 2011. Comparative analysis of multi-criteria decision making methodologies and imple-mentation of a warehouse location selection problem. Expert Syst Appl, 38: 9773–9779. http://dx.doi. org/10.1016/j.eswa.2011.02.022
Petritan AM, Biris IA, Merce O, Turcu DO, Petritan IC, 2012. Structure and diversity of a natural temperate sessile oak (Quercus petraea L.) – European Beech (Fagus sylvatica L.) forest. For Ecol Manage, 280: 140–149.
Pollino M, Modica G, 2013. Free Web Mapping Tools to Characterise Landscape Dynamics and to Favour e-Par-ticipation. In: Murgante B, Misra S, Carlini M, et al. eds ICCSA 2013, Part III. LNCS, vol. 7973. Springer, Berlin, Heidelberg, pp 566–581. http://dx.doi.org/10.1007/978-3-642-39646-5_41
Portoghesi L, Agrimi M, Bollati S, Corona P, Ferrari B, Lamonaca A, Plutino M, 2005. Observations on a Tur-key oak (Quercus cerris L.) forest and hypothesis of silvicultural treatment aiming at the diversification of stand structure and composition. Ital For e Mont, 4: 505–519.
Pukkala T, 2002. Multi-objective Forest Planning. Kluwer Academic Publishers. Springer Netherlands, Dordrecht. http://dx.doi.org/10.1007/978-94-015-9906-1 Putz FE, Redford KH, 2010. The Importance of Defining
“Forest”: Tropical Forest Degradation, Deforestation, Long-term Phase Shifts, and Further Transitions: Impor-tance of Defining “Forest”. Biotropica, 42: 10–20. http:// dx.doi.org/10.1111/j.1744-7429.2009.00567.x
Quézel P, Médail F, 2003. Ecologie et biogéographie des forêts du bassinméditerranéen. Elsevier, Paris, 571 pp. Rey Benayas JM, Newton AC, Diaz A, Bullock JM, 2009.
Enhancement of biodiversity and ecosystem services by ecological restoration: a meta-analysis. Science, 325: 1121–4. http://dx.doi.org/10.1126/science.1172460 Rivas-Martınez S, 2008. Global bioclimatics Clasificaciòn
Bioclimatica de la Tierra, version01-12-2008. Available in http://www.globalbioclimatics.org/book/bioc/global_ bioclimatics-2008_00.htm.
Rives J, Fernandez-Rodriguez I, Rieradevall J, Gabarrell X, 2012. Environmental analysis of raw cork extraction in cork oak forests in southern Europe Catalonia – Spain. Journal of Environmental Management, 110: 236-245. http://dx.doi.org/10.1016/j.jenvman.2012.06.024 Romanyà J, Vallejo V, 2004. Productivity of Pinus radiata
plantations in Spain in response to climate and soil. For Ecol Manage, 195: 177–189.
Saaty TL, 1977. A scaling method for priorities in hierarchi-cal structures. J Math Psychol, 15: 234–281. http://dx.doi. org/10.1016/0022-2496(77)90033-5
Kelly DL, 2002. The regeneration of Quercus petraea (ses-sile oak) in southwest Ireland: a 25-year experimental study. For Ecol and Manage, 166: 207–226.
Kimmins JP, 1997. Biodiversity and its relationship to eco-system health and integrity. For Chron, 73: 229–232. Lamb D, Erskine PD, Parrotta JA, 2005. Restoration of
De-graded Tropical Forest Landscapes. Science 310:(5754) 1628–1632. http://dx.doi.org/10.1126/science.1111773 Larsson TB, 2001. Biodiversity evaluation tools for
Euro-pean forests. Ecological Bulletins, Vol. 50. Oxford, UK. Blackwell Science.
Latham PA, Zuuring HR, Coble DW, 1998. A method for quantifying vertical forest structure. For EcolManage 104: 157–170.
Lentini F, Vezzani L, 1974. Carta geologica delle Madonie Sicilia centro-settentrionale alla scala 1:50.000. L.A.C., Firenze.
Ligot G, Balandier P, Fayolle A, Lejeune P, Claessens H, 2013. Height competition between Quercus petraea and
Fagus sylvatica natural regeneration in mixed and
uneven-aged stands. For Ecol Manage, 304: 391–398.
Lindenmayer DB, Cunningham RB, Donnelly CF, Lesslie R, 2002a. On the use of landscape surrogates as ecologi-cal indicators in fragmented forests. For Ecol Manage, 159: 203–216.
Lindenmayer DB, Manning AD, Smith PL, Possingham HP, Fischer J, Oliver I, McCarthy MA 2002b. The Focal-Species Approach and Landscape Restoration: a Critique. Conservation Biology, 16: 338–345. http://dx.doi. org/10.1046/j.1523-1739.2002.00450.x
Lund GH, 2009. What is a degraded forest? Forest Informa-tion Services. Gainesville, VA, USA.
Macharis C, Springael J, De Brucker K, Verbeke A, 2004. PROMETHEE and AHP: The design of operational syner-gies in multicriteria analysis. Eur J Oper Res, 153: 307– 317. http://dx.doi.org/10.1016/S0377-2217(03)00153-X Manning AD, Cunningham RB, Lindenmayer DB, 2013.
Bringing forward the benefits of coarse woody debris in ecosystem recovery under different levels of grazing and vegetation density. Biol Conserv, 157: 204–214. http:// dx.doi.org/10.1016/j.biocon.2012.06.028
McComb W, Lindenmayer D, 2001. Dying, dead, and down trees. Maint. Biodivers. For. Ecosyst., Malcom L. Cam-bridge University Press, CamCam-bridge, pp. 335–372. McElhinny C, Gibbons P, Brack C, Bauhus J, 2005. Forest
and woodland stand structural complexity: Its definition and measurement. For Ecol Manage, 218: 1–24.
MCPFE, 2007. State of Europe’s forests 2007-The MCPFE report on sustainable forest management in Europe. Liai-son Unit Warsaw. 263 pp.
Mendoza GA, Martins H, 2006. Multi-criteria decision analysis in natural resource management: A critical review of methods and new modelling paradigms. For Ecol Man-age, 230: 1–22.
Mendoza GA, Sprouse W, 1989. Forest planning and decision making under fuzzy environments: an overview and il-lustration. For Sci, 35: 481–502.
Mercurio R, 2010. Restauro della foresta mediterranea. Clueb, Bologna (Italy), 368 pp.
Thompson ID, Guariguata MR, Okabe K, Bahamondez R, Nasi R, Heymell V, Sabogal C, 2013. An Operational Framework for Defining and Monitoring Forest Degrada-tion. Ecol Soc 182, 20. http://dx.doi.org/10.5751/es-05443-180220
Tzeng GH, Huang J-J, 2011. Multiple attribute decision mak-ing: methods and applications. CRC Press, Boca Raton, FL. Vallauri D, 2005. Le Bois dit mort, une lacune des forêts en
France et en Europe. Bois mort à cavités, Tec & Doc. Lavoisierre, Paris, pp 9–17.
Van Andel J, Aronson J, 2012. Restoration Ecology: The New Frontier. Second edition. Wiley- Blackwell, Oxford, UK. http://dx.doi.org/10.1002/9781118223130
Van Wagner C, 1968. The line intersect method in forest fuel sampling. For Sci, 14: 26–27.
Vizzari M, Modica G, 2013. Environmental effectiveness of swine sewage management: a multicriteria AHP-based model for a reliable quick assessment. Environ Manage, 52(4): 1023-1039. http://dx.doi.org/10.1007/s00267-013-0149-y
Wang Z, Daun C, Yuan L, Rao J, Zhou Z, Li J, Yang C, Xu W, 2010. Assessment of the restoration of a degraded semi-humid evergreen broadleaf forest ecosystem by combined single-indicator and comprehensive model method. Ecol Eng, 36: 757-767. http://dx.doi. org/10.1016/j.ecoleng.2010.01.006
WDNR, 2011. Forest Soil Productivity. In: Wisconsin Forest Management Guidelines. WNDR, Madison, Wisconsin, 14 pp.
Wijdeven SMJ, 2004. Stand dynamics in Fontainebleu. Dy-namics in beech forest structure and composition over 17 years in La Tillaie forest reserve, Fontainebleu, France. Aterra-rapport 1124.
Zhou L, Dai L, Gu H, Zhong L, 2007. Review on the decom-position and influence factors of coarse woody debris in forest ecosystem. J For Res, 18: 48–54. http://dx.doi. org/10.1007/s11676-007-0009-9
Saaty TL, 1980. The analytic hierarchy process: planning, priority setting, resource allocation. McGraw-Hill Inter-national Book Co, New York.
Saaty TL, 2013. On the Measurement of Intangibles. A Prin-cipal Eigenvector Approach to Relative Measurement Derived from Paired Comparisons. Not Am Math Soc, 60, 192.http://dx.doi.org/10.1090/noti944
Saaty TL, Shang JS, 2011. An innovative orders-of-magni-tude approach to AHP-based mutli-criteria decision mak-ing: Prioritizing divergent intangible humane acts. Eur J Oper Res, 214, 703–715. http://dx.doi.org/10.1016/j. ejor.2011.05.019
Saaty TL, Vargas LG, 2011. The possibility of group choice: pairwise comparisons and merging functions. Soc Choice Welf, 38: 481–496. http://dx.doi.org/10.1007/s00355-011-0541-6
Sasaki N, Asner GP, Knorr W, Durst PB, Priyadi HR, Putz FE, 2011. Approaches to classifying and restoring de-graded tropical forests for the anticipated REDD+ climate change mitigation mechanism. iForest - Biogeosciences and Forestry, 4: 1–6.
Sasaki N, Putz FE, 2009. Critical need for new definitions of “forest” and “forest degradation” in global climate change agreements. Conservation Letters, 2: 226–232. http://dx.doi.org/10.1111/j.1755-263X.2009.00067.x Schnitzler A, Borlea F, 1998. Lessons from natural forests
as keys for sustainable management and improvement of naturalness in managed broadleaved forests. For Ecol Manage, 109: 293–303.
Simula M, 2009. Towards defining forest degradation: com-parative analysis of existing definitions. Forest Resourc-es AssResourc-essment. FAO Rome. Working Paper 154.
Soil Survey Staff, 1999. Soil Taxonomy. USDA-NRCS Agric Handb n 436.
Terborgh J, Estes JA, 2010. Trophic cascades: predators, prey, and the changing dynamics of nature. Island Press, Wash-ington [DC], 488 pp.