Microstructural White Matter Alterations in Men
With Alcohol Use Disorder and Rats With Excessive
Alcohol Consumption During Early Abstinence
Silvia De Santis, PhD; Patrick Bach, MD; Laura Pérez-Cervera, MSc; Alejandro Cosa-Linan, PhD; Georg Weil, MD; Sabine Vollstädt-Klein, MD; Derik Hermann, MD; Falk Kiefer, MD; Peter Kirsch, MD; Roberto Ciccocioppo, PhD; Wolfgang H. Sommer, MD, PhD; Santiago Canals, PhD
IMPORTANCEAlthough the detrimental effects of alcohol on the brain are widely acknowledged, observed structural changes are highly heterogeneous, and diagnostic markers for characterizing alcohol-induced brain damage, especially in early abstinence, are lacking. This heterogeneity, likely contributed to by comorbidity factors in patients with alcohol use disorder (AUD), challenges a direct link of brain alterations to the pathophysiology of alcohol misuse. Translational studies in animal models may help bridge this causal gap.
OBJECTIVETo compare microstructural properties extracted using advanced diffusion tensor imaging (DTI) in the brains of patients with AUD and a well-controlled rat model of excessive alcohol consumption and monitor the progression of these properties during early
abstinence.
DESIGN, SETTING, AND PARTICIPANTSThis prospective observational study included 2 cohorts of hospitalized patients with AUD (n = 91) and Marchigian Sardinian alcohol-preferring (msP) rats (n = 27). In humans cross-sectional comparison were performed with control participants (healthy men [n = 36]) and longitudinal comparisons between different points after alcohol withdrawal. In rats, longitudinal comparisons were performed in alcohol-exposed (n = 27) and alcohol-naive msP rats (n = 9). Human data were collected from March 7, 2013, to August 3, 2016, and analyzed from June 14, 2017, to May 31, 2018; rat data were collected from January 15, 2017, to May 12, 2017, and analyzed from October 11, 2017, to May 28, 2018. MAIN OUTCOMES AND MEASURES Fractional anisotropy and other DTI measures of white matter properties after long-term alcohol exposure and during early abstinence in both species and clinical and demographic variables and time of abstinence after discharge from hospital in patients.
RESULTS The analysis included 91 men with AUD (mean [SD] age, 46.1 [9.6] years) and 27 male rats in the AUD groups and 36 male controls (mean [SD] age, 41.7 [9.3] years) and 9 male control rats. Comparable DTI alterations were found between alcohol and control groups in both species, with a preferential involvement of the corpus callosum (fractional anisotropy Cohen d = −0.84 [P < .01] corrected in humans and Cohen d = −1.17 [P < .001] corrected in rats) and the fornix/fimbria (fractional anisotropy Cohen d = −0.92 [P < .001] corrected in humans and d = −1.24 [P < .001] corrected in rats). Changes in DTI were associated with preadmission consumption patterns in patients and progress in humans and rats during 6 weeks of abstinence. Mathematical modeling shows this process to be compatible with a sustained demyelination and/or a glial reaction.
CONCLUSIONS AND RELEVANCEUsing a translational DTI approach, comparable white matter alterations were found in patients with AUD and rats with long-term alcohol consumption. In humans and rats, a progression of DTI alterations into early abstinence (2-6 weeks) suggests an underlying process that evolves soon after cessation of alcohol use.
JAMA Psychiatry. 2019;76(7):749-758. doi:10.1001/jamapsychiatry.2019.0318
Published online April 3, 2019.
Supplemental content
Author Affiliations: Author
affiliations are listed at the end of this article.
Corresponding Authors: Wolfgang
H. Sommer, MD, PhD, Department of Psychopharmacology, Central Institute of Mental Health, University of Heidelberg, Square J5, Mannheim 68159, Germany (wolfgang.sommer @zi-mannheim.de); Santiago Canals, PhD, Instituto de Neurociencias de Alicante, Av Ramón y Cajal, sin número Campus de San Juan, 03550 San Juan de Alicante, Alicante, Spain ([email protected]).
T
he harmful use of alcohol is one of the largest risk fac-tors for death, disease, and disability (World Health Organization, 2018).1Population studies2,3
have sug-gested that alcohol-induced brain damage has no lower risk level boundaries; early detection of negative alcohol-related effects therefore has high priority.
Alcohol-induced brain damage can be revealed noninva-sively through diffusion tensor imaging (DTI).4
This tech-nique measures water diffusivity in brain and returns indices of microstructural integrity sensitive to tissue abnormalities occurring after alcohol consumption, even in regions that ap-pear normal according to imaging-based morphometry5,6
or after a single acute administration of alcohol.7
Despite much congruent evidence of microstructural al-terations in alcohol use disorder (AUD),6,8-10linking the changes observed in vivo to the pathophysiology of AUD is challeng-ing, owing to numerous comorbidity factors. In this context, animal models reproducing alcohol-induced brain damage can establish a causal link between the observed changes and al-cohol consumption.11,12Recently Cosa et al13reported DTI al-terations in rats after voluntary alcohol consumption; how-ever, extensive translational studies comparing rodent and human brain microstructure in AUD are missing.
Although relative consensus in literature exists on the white matter alterations in individuals with AUD compared with con-trols, progression of white matter alterations in early absti-nence is more controversial. Although DTI changes can be at least partially reversed after abstinence,5the time scale and extent of this recovery are unclear, especially in early abstinence.13-15Early abstinence is a key phase in the treat-ment of AUD because patients are more prone to relapse.16,17 Translational, longitudinal DTI studies in patients with AUD who are abstinent should help to characterize the course of micro-structural changes occurring in this important disease phase.
When interpreting DTI results, changes in imaging param-eters in AUD are generally explained as loss of tissue integrity due to demyelination or axonal damage.18-20
However, DTI is sensitive to the compound effect of all the different water pools in the tissue: intra-axonal and extra-axonal space, cell bodies, and glia. Clarifying how a particular change affects this bal-ance would dramatically improve the interpretation of results. In the present study, we aimed to (1) use DTI to disclose specific patterns of alcohol-related brain changes in treatment-seeking patients with AUD and rats with long-term alcohol con-sumption; (2) monitor this change longitudinally into early ab-stinence (up to 6 weeks); and (3) explore the differential contribution of distinct water pools to the DTI signal through simulations and demonstrate that the observed abnormali-ties may also be explained by fluid accumulation and a glial reaction.
Methods
Human Study
The participants included 127 men enrolled in the following 3 groups (eFigure 1 in theSupplement): (1) 36 healthy con-trols; (2) 48 treatment-seeking patients with AUD (cohort A)
undergoing DTI at 1 week after admission into the clinic and completion of detoxification treatment (TP1h-A) and after 2 to 3 weeks (TP2h-A); and (3) 53 treatment-seeking patients with AUD (cohort B) undergoing DTI after 2 to 3 weeks of admis-sion into the clinics (TP2h-B), 20 of whom underwent scan-ning again after 4 to 6 weeks of admission (TP3h-B). Cohorts A and B shared 10 patients. The study was conducted at the Central Institute for Mental Health in Mannheim, Germany. The Ethics Committee II of Heidelberg University, Mannheim, Ger-many, approved the study procedures in accordance with the Declaration of Helsinki.21Participants gave written consent and did not receive any stipend. Inclusion criteria and assess-ment are reported in the eMethods in theSupplement. De-scriptive statistics of demographic data and clinical descrip-tors appear in the Table.
Animal Study
All animal experiments were approved by the Animal Care and Use Committee of the Instituto de Neurociencias de Alicante, Alicante, Spain, and comply with the Spanish (law 32/2007) and European regulations (EU directive 86/609, EU decree 2001-486, and EU recommendation 2007/526/EC). A total of 36 male rats of the Marchigian Sardinian alcohol-preferring (msP) line22were used for the animal study. Of these, 27 rats had access to alcohol in a 2-bottle free-choice paradigm for 30 days (eFigure 9 in theSupplement). Eighteen rats underwent DTI before alcohol access (TP0r-A), after 4 weeks of alcohol access (TP1r-A), and after 6 weeks of abstinence (TP3r-A). Nine rats underwent DTI twice: after 4 weeks of alcohol drinking (TP1r-B) and after 2 weeks of abstinence (TP2r-B). Nine rats were used as age-matched alcohol-naïve controls. The time-line of DTI assessments is shown in eFigure 1 in the Supple-ment; procedure details including drinking data are de-scribed in the eMethods in theSupplement.
Image Processing
Human data were collected from March 7, 2013, to August 3, 2016; rat data were collected from January 15, 2017, to May 12, 2017. The DTI sequences for human and rats and preprocess-ing and analysis pipelines are reported in the eMethods in the
Key Points
QuestionCan commonly observed white matter defects in alcohol use disorder be linked to alcohol using a translational diffusion tensor imaging approach, and can it be used to monitor the progression of defects into early abstinence?
FindingsThis study of 91 men with alcohol use disorder, 36 healthy male controls, and 27 rats with a high preference for alcohol and 9 control rats found highly similar white matter alterations between species. A similar pattern of progression in diffusion tensor imaging alterations was found in patients and rats during early abstinence (2-6 weeks).
MeaningThe reproducible patterns of alterations in humans and rats support an association with alcohol, and the progression of diffusion tensor imaging alterations into early abstinence suggests an underlying process that evolves soon after cessation of alcohol use.
Supplement. For each participant, the following maps were computed: fractional anisotropy, mean diffusivity, axial dif-fusivity, and radial diffusivity.
Statistical Analysis
Human data were analyzed from June 14, 2017, to May 31, 2018; rat data were analyzed from October 11, 2017, to May 28, 2018. Whole-brain statistical analysis of group differences and cor-relation with clinical variables were achieved using tract-based spatial statistics (TBSS),23combined with an advanced normalization approach.24
For the cross-sectional analysis, a general linear model was used within a voxelwise, permutation-based, nonparametric statistical framework23to test for signifi-cant differences controlling for age and multiple comparisons across clusters using threshold-free cluster enhancement. For the longitudinal design, the statistic was applied on the differ-ence between maps acquired at different points. To check for lateralization of the group differences, the hemisphere by group interaction was tested using the TBSS_sym routine in FSL,23as described in the eMethods in theSupplement. To test correla-tion with severity of AUD, the analysis was repeated by includ-ing measures of severity as an independent regressor in the general linear model for all the data at TP2h (cohorts A and B).
We used 10 000 permutations, and a corrected voxelwise 2-sided P < .05 was considered statistically significant. Cluster location was achieved using a white matter DTI-driven parcel-lization for humans25and the Paxino-Watson atlas for rats.26 To compare the effect size across different designs, we defined voxel wise, in voxels with significant differences across conditions, the percentage of change in DTI parameters as ΔP = (P2-P1)/P1, where P indicates fractional anisotropy, mean diffusivity, axial diffusivity, or radial diffusivity; 1, initial or healthy condition; and 2, final or pathologic condition.
Tract-specific analysis was perfomed according to the trac-tometry approach.27
Significant differences between healthy controls and patients with AUD among the human partici-pants were calculated using a multivariate analysis of variance (MANOVA) on all microstructural parameters, with age as co-variate. In rats, significant differences between different DTI points were tested using a repeated-measures MANOVA. Both MANOVAs were followed by post hoc t tests, corrected for mul-tiple comparisons using the false discovery rate.28The effect size was calculated as the difference between the parameter in the alcohol group and in the healthy control group, divided by the pooled SD (Cohen d statistic). Survival analysis was performed as described in the eMethods in theSupplement.
Table. Demographic and Clinical Data for Healthy Controls and Patients
Characteristic
Patient Group, Mean (SE)
Statistic P Value Control (n = 36) AUD Cohort A (n = 48) AUD Cohort B (n = 53) Demographical variables
Age, mean (SE), y 41.7 (1.6)a 47.5 (1.4)a 45.1 (1.2) F
3,133= 2.939 .04
Educational attainment, No. of participantsa
No graduation 0 1 2
χ2
6= 19.996 .003
Primary school 5 16 16
Secondary school 5 13 20
Attended college or higher 26 18 14
Substance use patterns, mean (SE)
Ethanol intake (mean of last 90 d), g/d 6.4 (25.7)b,c 202.5 (22.0)b 196.4 (18.0)c F
3,132= 16.016 <.001
ADS (total score)d 2.1 (0.9)b,c 15.3 (0.8)b 14.2 (0.9)c F
3,129= 41.195 <.001
Smoking
No. of participants responding yes/no 4/31b,c 31/17b 41/11c χ2
2= 40.725 <.001
Cigarettes smoked per day, mean (SE) 1.3 (0.4) 1.9 (0.2) 1.9 (0.2) F3,74= 1.494 .22
FTND total score, mean (SE)e 4.8 (1.2) 6.1 (0.4) 6.0 (0.4) F
3,74= 0.507 .68
Clinical scales, mean (SE)
OCDS total scoref 1.5 (1.1)b,c 16.9 (0.9)b 16.4 (1.0)c F
3,128= 47.805 <.001
STAI trait total scoreg 30.5 (1.8)b,c 45.9 (1.6)b,h 40.0 (1.4)c,h F
3,126= 14.354 <.001
BDI total scorei 2.1 (1.5)b,c 17.2 (1.2)b,h 11.8 (1.2)c,h F
3,131= 20.830 <.001
Abbreviations: ADS, Alcohol Dependence Scale; AUD, alcohol use disorder; BDI, Beck Depression Inventory; FTND, Fagerström Test for Nicotine Dependence; OCDS, Obsessive-Compulsive Drinking Scale; STAI, State-Trait Anxiety Inventory.
a
Data were missing for 1 participant in the AUD patient cohort B. b
Significant post hoc differences between the control group and AUD patient cohort A with P < .05.
cSignificant post hoc differences between the control group and AUD patient cohort B with P < .05.
dScores range from 0 to 47, with higher scores indicating higher alcohol dependence severity.
eScores range from 0 to 10, with higher scores indicating more intense physical dependence on nicotine.
f
Scores range from 0 to 40, with higher scores indicating more intense subjective alcohol craving.
gScores range from 20 to 80, with higher scores indicating higher trait anxiety. h
Significant post hoc differences between AUD patient cohorts A and B with P < .05. Cohorts A and B share 10 patients.
iScores range from 0 to 63, with higher scores indicating more intense depressive symptoms.
Signal Simulation
Because all water pools present in cerebral tissue contribute to the measured diffusion tensor, we simulated the effect of combining restricted, highly anisotropic water pools (repre-senting water in axons) with an isotropic compartment of in-creasing volume fraction (which can represent glia and/or fluid accumulation). Details are reported in the eMethods in the Supplement.
Results
Difference Between Alcohol and Controls
in the Whole WM Skeleton
The analysis included 91 men with AUD (mean [SD] age, 46.1 [9.6] years) and 27 male rats in the AUD groups and 36 men (mean [SD] age, 41.7 [9.3] years) and 9 male rats in the control groups. Our first aim was to compare the maps measured in pa-tients with AUD at TP1h-A with those measured in controls. Pa-tients with AUD had widespread microstructural
abnormali-ties, namely reduced fractional anisotropy and axial diffusivity and increased mean and radial diffusivity, compared with con-trols (Figure 1A and B and eFigure 2A and B in the Supplement) at P < .05 level, corrected for multiple comparisons. The mean ΔP over the significant voxels was −7% for fractional anisot-ropy, 6% for mean diffusivity, −9% for axial diffusivity, and 11% for radial diffusivity. The differences followed a complex pat-tern, which depends on modality and region, with a preferen-tial involvement of frontal and superior white matter, and were most widespread in fractional anisotropy. According to the lat-eralization analysis results reported in eFigure 3 in the Supple-ment, voxels with significant differences were preferentially lo-cated in the right hemisphere for fractional anisotropy, mean diffusivity, and radial diffusivity, whereas they were more preva-lent in the left hemisphere for axial diffusivity.
Likewise, in the longitudinal rodent experiment, animals were exposed to alcohol for 1 month. During this period rats es-calated their alcohol consumption from 2 to 3 g/kg per day in the first 5 days to 5 to 6 g/kg per day from the tenth day on-ward. Such daily consumption levels led to pharmacologically Figure 1. Differences Between Alcohol Use Disorder (AUD) Cohorts and Controls in the White Matter Skeleton
Fractional anisotropy in humans
A
Fractional anisotropy in rats
C D Mean diffusivity in rats
Mean diffusivity in humans
B Controls (n =36) vs AUD cohort A (n=48) TP1h-Av Rats (n =18) TP0r-A Rats (n =18) TP1r-A 2-Bottle paradigm (4 wk) Negative Effect Positive Effect 0 0.1 Negative Effect Positive Effect 0 0.1
Tract-based statistical analysis shows cross-sectional differences in the white matter skeleton between controls and the AUD cohort undergoing diffusion tensor imaging 1 week after detoxification (TP1h-A) for fractional anisotropy and mean diffusivity and longitudinal differences between baseline (TP0r-A) and at 4 weeks (TP1r-A) of the 2-bottle free-choice paradigm in rats for fractional anisotropy and mean diffusivity. Thick tracts are significant tracts (P < .05 corrected, obtained using the fsl tool tbss_fill); thin tracts are points just below the P value threshold (P = .05 to P = .10). The results for the other
microstructural parameters (axial diffusivity and radial diffusivity) are reported in eFigure 2 in the
relevant blood alcohol levels as high as 1 g/L in msP rats.22This level of alcohol consumption caused widespread microstruc-tural abnormalities, namely reduced fractional anisotropy and axial diffusivity (Figure 1C and eFigure 2C in theSupplement) and increased mean diffusivity and radial diffusivity (Figure 1D and eFigure 2D in theSupplement) at TP1r-A compared with TP0-A. The mean ΔP across the significant voxels was −6% for fractional anisotropy, 4% for mean diffusivity, −3% for axial dif-fusivity, and 5% for radial diffusivity. The nature of these changes was comparable to the human finding; however, unlike in hu-mans, the observed changes were not lateralized.
To control for the age difference in the longitudinal rat study between TP0r-A and TP1r-A and discard potential age effects, we repeated the DTI acquisition in the same strain af-ter 1 month of normal aging. Importantly, we found that, for this period, fractional anisotropy was not affected and mean diffusivity was only marginally changed, with only 2 regions of interest (the second somatosensory cortex and the piri-form cortex) showing significant differences (eFigure 4 in the Supplement). Furthermore, the aging effect on mean diffu-sivity was a slight reduction, opposite to the clear enhancing effect of alcohol.
Difference Between AUD and Control Groups
in the Corpus Callosum and Fornix
Next, we focused on the corpus callosum and the fornix, 2 fiber tracts that are preferentially affected by alcohol according to literature,29using streamline-specific statistics to compare tract-specific DTI parameters between TP1h-A and controls in humans and TP1r-A and TP0r-A in rats. Alcohol exposure was associated with microstructural changes in the corpus callosum and fornix (Figure 2 and eFigure 5A-F in theSupplement). Specifically, in the corpus callosum, we observed a statistically significant re-duction of fractional anisotropy (Cohen d = −0.84 [P < .01]) and an increase in mean diffusivity (Cohen d = 1.05 [P < .001]), axial diffusivity (Cohen d = 0.73 [P < .05]), and radial diffusivity (Co-hen d = 0.95 [P < .001]), wherease in the fornix we observed a statistically significant reduction of fractional anisotropy (Cohen d = −0.92 [P < .001]). Alcohol intake was also associated with a statistically significant decrease in the tract volume compared with controls for the corpus callosum (Cohen d = −0.75 [P < .01]) and fornix (Cohen d = −0.74 [P < .01]).
Likewise, 1 month of excessive drinking in rats led to micro-structural changes in the corpus callosum and fornix tracts (Figure 2 and eFigure 5G-L in theSupplement). In the corpus cal-losum we observed a statistically significant reduction of frac-tional anisotropy (Cohen d = −1.17 [P < .001]) and an increase in mean diffusivity (Cohen d = 0.88 [P < .01]) and radial diffusiv-ity (Cohen d = 1.21 [P < .001]), whereas in the fornix we observed a statistically significant reduction of fractional anisotropy (Co-hen d = −1.24 [P < .001]). Alcohol exposure also was associated with a decrease in the tract, which was not significant (all ANOVA results are reported in eTables 1 and 2 in theSupplement).
Development of the Microstructural Changes
During Early Abstinence
To study the dynamics of microstructural changes, we com-pared DTI parameters measured at different points during
ab-stinence. In humans, we found a pattern of progressive de-crease of fractional anisotropy (Figure 3A-B) and an inde-crease of mean diffusivity (eFigure 6A-D in theSupplement) and ra-dial diffusivity (eFigure 6B-E in theSupplement) in most white matter tracts. Axial diffusivity decreased and increased (de-pending on the region) during the initial 2 to 3 weeks of absti-nence, but increased in most white matter between 2 to 3 weeks and 4 to 6 weeks. The mean ΔP over the significant voxels for TP2h-A vs TP1h-A was −6% for fractional anisotropy, 4% for mean diffusivity, 1% for axial diffusivity, and 8% for radial dif-fusivity; the ΔP over the significant voxels for TP3h-B vs TP2h-B was −7% for fractional anisotropy, 4% for mean diffusivity, 1% for axial diffusivity, and 9% for radial diffusivity. Notably, none of the microstructural parameters measured after early absti-nence normalized toward levels measured in healthy con-trols. On the contrary, the difference compared with healthy controls increased during early abstinence for all parameters, except axial diffusivity in some regions.
In rats, we found a widespread significant decrease in frac-tional anisotropy (Figure 3C) and in axial diffusivity (eFig-ure 6H in theSupplement) at TP2r-B compared with TP1r-B. At TP2r-A compared with TP1r-A, we found an even more wide-spread decreased fractional anisotropy (Figure 3D) and axial diffusivity (eFigure 6I in theSupplement) and increased ra-dial diffusivity (eFigure 6J in theSupplement). The mean ΔP over the significant voxels for TP2r-B vs TP1r-B was −4% for fractional anisotropy and −3% for axial diffusivity; and for TP3r-A vs TP1r-A, −0.2% for fractional anisotropy, −1% for axial diffusivity, and 0.2% for radial diffusivity. The pattern of fur-ther progression of microstructural changes during absti-nence was compatible with the human results.
Correlation With Clinical and Behavioral Measures
in Humans
In our next analysis, we investigated whether the microstruc-tural alterations found in humans were associated with clini-cal and behavioral measures. Correlation analysis between the microstructural parameters and alcohol use history in the com-bined AUD TP2h-A plus TP2h-B cohorts unveiled a signifi-cant negative association between fractional anisotropy and axial diffusivity and the mean ethanol daily intake before treat-ment (Figure 4A and eFigure 7 in theSupplement). Plots of age-adjusted fractional anisotropy vs ethanol intake in the corpus callosum and fornix are reported in Figure 4B-C. No signifi-cant correlations were found with the other measures of ad-diction reported in the assessment. Survival analysis did not reveal association of any DTI parameters with relapse risk within 3 months after discharge from the hospital.
Interpretation of the Imaging Results:
Simulations of Diffusion in Multiple Water Pools
To better interpret the observed DTI changes, we simulated the presence of an isotropic water pool of increasing volume frac-tion, compatible with a glial reaction and/or extracellular fluid accumulation, and determined the effect on the DTI indices. We report simulations for 2 different geometries of the re-stricted pool: single orientation (eFigure 8I in the Supple-ment, a model for highly coherent tracts like the corpus
cal-losum) vs 2 orthogonal populations (eFigure 8J in the Supplement, a model for most white matter tracts). In the single restricted orientation (eFigure 8A in theSupplement), frac-tional anisotropy showed a nonmonotonic increase in vol-ume fraction of the isotropic water pool, while it decreased monotonically when 2 restricted populations were present (eFigure 8E in theSupplement). Similarly, mean diffusivity and radial diffusivity had a nonmonotonic increase in volume frac-tion in single restricted orientafrac-tion (eFigure 8B and D in the Supplement), but they increased monotonically with 2 or-thogonal cylindrically restricted populations (eFigure 8F and H in theSupplement). Axial diffusivity always increased, but the rate depended on the volume of the restricted vs the hin-dered compartment (eFigure 8C and G in theSupplement). All
4 microstructural indices, following the same increase in the isotropic pool, can increase and decrease, depending on the fiber geometry (single or crossing fibers). This process sug-gests that a pattern of reduced fractional anisotropy, like that observed herein, can also be caused by a glial reaction and/or extracellular fluid accumulation.
Discussion
The most important findings from this translational neuroim-aging study are the coherence in white matter microstruc-tural changes observed after heavy alcohol exposure in a co-hort of patients and experimental animals and the progression Figure 2. Tract-Specific Differences Between Alcohol Use Disorder (AUD) Cohorts and Controls
P<.01 P<.001 P<.001 Corpus callosum B Tract reconstruction A Rat Cohort AUD Cohort A Fractional Anisotropy 0.75 0.45 0.50 0.55 0.60 0.65 0.70 Controls TP1 Tracts Size, cm 3 13 4 5 6 7 8 9 10 11 12 Controls TP1 Fractional Anisotropy 0.62 0.46 0.48 0.50 0.52 0.54 0.56 0.58 0.60 Controls TP1 Tracts Size, cm 3 10.5 6.0 6.5 7.0 7.5 8.0 8.5 9.0 9.5 10.0 Controls TP1 P<.001 P<.01 P<.001 Fornix C Fractional Anisotropy 0.38 0.18 0.20 0.22 0.24 0.26 0.28 0.30 0.32 0.34 0.36 Controls TP1 Tracts Size, cm 3 18 0 2 4 6 8 10 12 14 16 Controls TP1 Fractional Anisotropy 0.50 0.40 0.42 0.44 0.46 0.48 Controls TP1 Tracts Size, cm 3 0.14 0.05 0.06 0.07 0.08 0.09 0.10 0.11 0.12 0.13 Controls TP1
Healthy Controls Patients With AUD Rats at Baseline Rats after Exposure
fx cc fx cc fx cc fx cc I-S A L R P
A (left), Example of tract reconstruction in native space for 1 healthy control and 1 age-matched patient with AUD. The fornix and the corpus callosum are displayed using diffusion tensor imaging (DTI) color conventions, superimposed on the fractional anisotropy maps. B (left), Values of fractional anisotropy and the tract size in the corpus callosum are shown for the controls and the patients with AUD undergoing DTI 1 week after detoxification (TP1h-A). Mean values in each population are reported in blue for controls and in orange for patients with AUD. C (left), The same is shown in the fornix for fractional anisotropy and tract size. A (right), Example of tract reconstruction in native space for 1 rat before and after the 2-bottle free-drink paradigm. Both the fornix and the corpus
callosum are displayed using DTI color convention, superimposed on the fractional anisotropy maps. B (right), The values of fractional anisotropy and the tract size in the corpus callosum are shown for rats at baseline (TP0r) and for exposed rats (TP1r). Mean values in each population are reported in blue for baseline and in orange for exposed animals. C (right), The same is shown in the fornix for fractional anisotropy and for the tract size. P values represent significant difference in the analysis of variance test statistic, corrected for the false discovery rate. The plots for the other microstructural parameters (mean diffusivity, axial diffusivity, and radial diffusivity) are reported in eFigure 5 in theSupplement.
of such changes during early abstinence. Furthermore, by mathematical modeling of tissue diffusion properties, we chal-lenge the current interpretation of DTI changes as reflecting myelin and/or axonal damage; we present evidence that this phenomenon may be associated with, for instance, a glial reaction.
In humans, we found diffuse microstructural differences in patients with AUD compared with controls, which affects preferentially the right hemisphere and the frontal area, in agreement with recent literature.9,30
We also found a nega-tive correlation between fractional anisotropy and daily alco-hol intake before admission, consistent with recent work.31 Using an established rat model of excessive voluntary alcohol consumption, we demonstrated that alcohol consumption dur-ing a relatively short period (1 month, but significantly longer if adjusted for the different life span of rats compared with hu-mans) was associated with diffuse microstructural changes in DTI indices largely comparable to the findings in humans with AUD. Furthermore, using tractography to focus on the corpus callosum and the fornix, 2 tracts identified as particularly af-fected in AUD,8,10we demonstrated that the microstructural
changes have similar effect size (0.7-1.0) in humans and rats. Minor differences between the 2 analyses can be attributed to the different sensitivity of region of interest–based vs whole brain approaches.23We also found an association with re-duced tract volume in AUD, significant in humans only. This finding is consistent with magnetic resonance imaging volu-metric studies that report shrinkage of white matter tracts of alcohol-dependent individuals.29The lack of significance in rats suggests its association with longer exposition times and higher alcohol levels in patients vs the 1-month consumption period in rats, but other differences between humans with AUD and the rat model (eg, medication) cannot be excluded.
The fact that the findings in humans mirror those in rats may establish a relationship between the observed changes and alcohol consumption, which is difficult to verify based on hu-man results only, given the large heterogeneity of the abuse patterns, medication for relief of withdrawal symptoms, and comorbidities among patients with AUD. This result estab-lishes the utility of diffusion imaging for monitoring the brain status as a possible noninvasive biomarker of AUD progres-sion and, potentially, of treatment response.
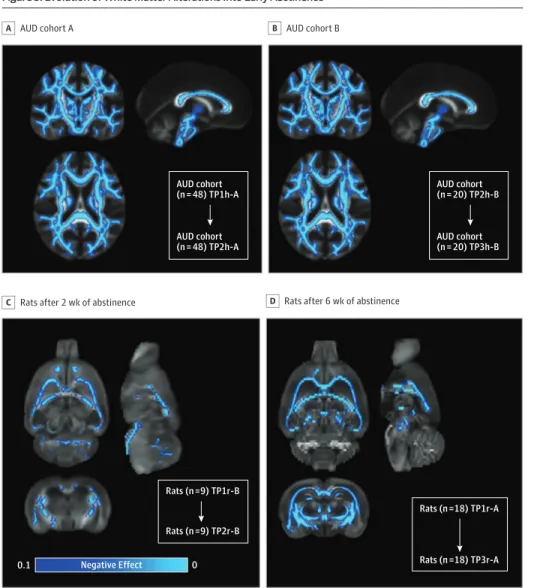
Figure 3. Evolution of White Matter Alterations Into Early Abstinence
AUD cohort A
A
Rats after 2 wk of abstinence
C D Rats after 6 wk of abstinence
AUD cohort B B AUD cohort (n = 48) TP1h-A AUD cohort (n = 48) TP2h-A AUD cohort (n = 20) TP2h-B AUD cohort (n = 20) TP3h-B Rats (n =9) TP1r-B Rats (n =9) TP2r-B Rats (n =18) TP1r-A Rats (n =18) TP3r-A Negative Effect 0 0.1
Tract-based statistical analysis shows longitudinal fractional anisotropy differences in the white matter skeleton between patients in alcohol use disorder (AUD) cohort A undergoing diffusion tensor imaging (DTI) at 2 weeks after detoxification (TP2h-A) vs 1 week after detoxification (TP1h-A) (A) and longitudinal DTI differences between patients in AUD cohort B undergoing DTI 4 to 6 weeks after admission (TP3h-B) vs 2 to 3 weeks after admission (TP2h-B) (B). The same analysis is shown in rats that underwent DTI after 4 weeks of alcohol access (TP1r-B) vs after 2 weeks of abstinence TP2r-B (C) and after 4 weeks of alcohol access (TP1r-A) vs after 6 weeks of abstinence (TP3r-A) (D). Thick tracts are significant tracts (P < .05, obtained using the fsl tool tbss_fill); thin tract are points just below P value threshold (P = .05 to P = .10). The results for the other
microstructural parameters (mean diffusivity, axial diffusivity, and radial diffusivity) are reported in eFigure 6 in theSupplement.
Although many previous studies have included individu-als with abstinence ranging from days to years or included in-dividuals during sustained remission (>1 year), the few works
focused on the early abstinence phase9,14,15present conflict-ing results. Herein we found that at 2 and 6 weeks of absti-nence, the microstructural changes progressed with further de-crease of fractional anisotropy and inde-crease of radial diffusivity in humans and rats. These results challenge the conventional idea that the microstructural alterations start to revert to con-trol values immediately after discontinuing alcohol consump-tion and provide insights into the neuroadaptaconsump-tions occur-ring duoccur-ring abstinence.
Only 1 parameter, axial diffusivity, showed differential de-velopment during abstinence between humans and rats. How-ever, its correlation with preadmission alcohol consumption in humans suggests its clinical relevance. Although axial dif-fusivity was initially proposed as a marker for axonal integ-rity, recent literature highlighted its pitfalls, expecially in disease32; our simulations showed that axial diffusivity was the only parameter with a nonmonotonic trend as a function of the restricted fraction, suggesting that more information is needed to understand the exact pathophysological underpin-ning of its contrast.
Given the lack of specificity of DTI, interpreting the un-derlying neurobiological substrate that produces the ob-served change is challenging. Alcohol use induces loss of mainly small fibers, myelin irregularity, and segmental demylination or remyelination,20accompanied by neuroinflammation.33 Ex-cessive intracellular and extracellular fluid accumulation was also proposed to explain DTI changes in AUD.8
Our simula-tion results challenge the idea that we might infer the specific microstructural alteration causing the observed changes, show-ing that a different balance among restricted, hindered, and isotropic water pools affects the observed DTI indices. We showed that an increase in the proportion of the isotropic pool, which can be a model for a glial reaction, was associated with an increase of fractional anisotropy in areas of single fibers, and a decrease of fractional anisotropy in areas of crossing fi-bers. The observed further decrease of fractional anisotropy in early abstinence may thus be explained by progressive my-elin and axonal damage, but also by a glial or a cellular reac-tion, for instance, during an ongoing inflammatory process.
Limitations
Aging is a possible confounder in this longitudinal study be-cause DTI indices also change with normal aging. However, in humans, the effect size of the change is too small to explain the observed changes, because the annual rate of change is smaller than or equal to 1%.34,35
For rats, we reported no change in fractional anisotropy and marginal changes in mean diffu-sivity after 1 month of aging, with mean diffudiffu-sivity and changes going in the opposite direction compared with alcohol-induced changes. Another recent study reported similar trends in Sprague-Dawley rats.36
Other limitations include differences in the age composi-tion of the 3 human cohorts (healthy controls and AUD cohorts A and B), although these were controlled for in the sta-tistical analysis. The alleviation of severe withdrawal symp-toms is a medical requirement; although the direct pharma-cological effects of benzodazepines have been avoided by the study design, little is known about their long-term effect on Figure 4. Correlation Between Diffusion Tensor Imaging Parameters
and Ethanol Daily Intake
Ethanol intake at baseline
A 0.6 0.5 0.4 0.3 0.2 0.1 0 Fornix C Age-Corrected Anisotropy r2 = 0.31 P <.001 Ethanol Intake, g/d 0 200 400 600 800 1000 1200 0.80 0.75 0.70 0.65 0.60 0.55 0.50 0.45 0.40 Corpus callosum B Age-Corrected Anisotropy Ethanol Intake, g/d r2 = 0.14 P <.001 r2 = 0.14 P <.001 0 200 400 600 800 1000 1200 Negative Correlation 0 0.1
Tract-based statistical analysis of the correlation between fractional anisotropy measures in patients with alcohol use disorder (AUD) and ethanol intake at baseline, corrected for age (A). Thick tracts are significant tracts (P < .05, obtained using tbss_fill); thin tracts are points just below P value threshold (P = .05 to P = .10). Scatterplots between age-corrected fractional anisotropy (using the multiparametric regression α + β × age + γ × ethanol) and ethanol intake are shown for the genu of the corpus callosum (B) and the fornix (C).
DTI parameters. To address this limitation, we have pre-sented data from well-controlled animal models.
Only male participants were included in the study, be-cause most patients with AUD admitted to our inpatient care are male. The prevalence of alcohol dependence in women, al-though lower than in men, is nevertheless significant. Thus, sex effects on the observed microstructural alterations need to be investigated more closely in the future.
On the methodological side, the limitations of the tensor model, especially in accounting for crossing fibers, are well known. Future studies with multishell diffusion data and more advanced diffusion models are needed to increase specificity and sensitivity.
Conclusions
This study reported diffuse white matter microstructural changes observed after heavy alcohol exposure in patients that mirrors changes obtained in experimental animals. We found that in hu-mans and rats, a progression of DTI alterations into early absti-nence (2-6 weeks), suggesting an underlying process that evolves soon after alcohol cessation. Owing to the inherent lack of speci-ficity of diffusion MRI, further studies are needed to clarify the biological underpinings of the observed signature. This study may lead the way for biomarker development with translational value and suitable for big data approaches.
ARTICLE INFORMATION
Accepted for Publication: January 14, 2019. Published Online: April 3, 2019.
doi:10.1001/jamapsychiatry.2019.0318 Author Affiliations: Instituto de Neurociencias de
Alicante, Consejo Superior de Investigaciones Científicas–Universidad Miguel Hernández de Elche, Sant Joan d’Alacant, Alicante, Spain (De Santis, Pérez-Cervera, Canals); Department of Addiction Medicine, Central Institute of Mental Health, University of Heidelberg, Mannheim, Germany (Bach, Weil, Vollstädt-Klein, Hermann, Kiefer, Sommer); Department of
Psychopharmacology, Central Institute of Mental Health, University of Heidelberg, Mannheim, Germany (Cosa-Linan, Sommer); Department of Clinical Psychology, Central Institute of Mental Health, University of Heidelberg, Mannheim, Germany (Kirsch); School of Pharmacy, University of Camerino, Camerino, Italy (Ciccocioppo).
Author Contributions: Drs Sommer and Canals
contributed equally to this work. Dr De Santis had full access to all the data in the study and takes responsibility for the integrity of the data and the accuracy of the data analysis.
Concept and design: De Santis, Vollstaedt-Klein, Hermann, Kiefer, Ciccocioppo, Sommer, Canals. Acquisition, analysis, or interpretation of data: De Santis, Bach, Pérez-Cervera, Cosa Linan, Weil, Vollstaedt-Klein, Hermann, Kirsch, Ciccocioppo, Sommer, Canals.
Drafting of the manuscript: De Santis, Bach, Sommer, Canals.
Critical revision of the manuscript for important intellectual content: Bach, Pérez-Cervera, Cosa Linan, Weil, Vollstaedt-Klein, Hermann, Kiefer, Kirsch, Ciccocioppo, Sommer, Canals. Statistical analysis: De Santis, Bach.
Obtained funding: Pérez-Cervera, Kiefer, Kirsch, Sommer, Canals.
Administrative, technical, or material support: Bach, Weil, Vollstaedt-Klein, Hermann, Kiefer,
Ciccocioppo.
Supervision: Vollstaedt-Klein, Hermann, Ciccocioppo, Sommer, Canals.
Conflict of Interest Disclosures: Dr Bach reported
grants from Horizon 2020 program, Era-NET NEURON, and Deutsche Forschungsgemeinschaft (DFG) during the conduct of the study. Dr Weil reported grants from European Union and DFG during the conduct of the study. Dr Hermann reported grants from European Union Horizon 2020 research and innovation programme under
grant agreement 668863 (SyBil-AA) during the conduct of the study and personal fees from Indivior, Camurus, and Servier outside the submitted work. Dr Kirsch reported grants from DFG during the conduct of the study.
Dr Ciccocioppo reported grants from the National Institute of Alcohol Abuse and Alcoholism during the conduct of the study. Dr Sommer reported grants from European Union and DFG during the conduct of the study. Dr Canals reported grants from European Research Council and grants from Spanish State Research Agency during the conduct of the study. No other disclosures were reported.
Funding/Support: This study was supported by
grant 668863-SyBil-AA from the European Union’s Horizon 2020 research and innovation programme, grants FKZ 01EW1112-TRANSALC and
PIM2010ERN-00679 from the ERA-Net NEURON program, grant SEV- 2017-0723 from the Spanish State Research Agency through the Severo Ochoa Program for Centres of Excellence in R&D, and Center grant SFB636 from the Deutsche Forschungsgemeinschaft. Further financial support was obtained from grant BFU2015-64380-C2-1-R from the Ministerio de Economía y Competitividad (MINECO) and FEDER funds (Dr Canals), Ministerio de Sanidad, Servicios Sociales e Igualdad grant 2017I065 (Dr Canals), Young Investigator Grant 25104 from the National Alliance for Research on Schizophrenia and Depression (Dr De Santis), and Marie Skłodowska-Curie Individual Fellowship 749506 from the European Research Council.
Role of the Funder/Sponsor: The funders/
sponsors had no role in the design and conduct of the study; collection, management, analysis, and interpretation of the data; preparation, review, or approval of the manuscript; and decision to submit the manuscript for publication.
Additional Contributions: Begoña Fernández,
HCN, Instituto de Neurocienicas Alicante, Spain, provided excellent technical assistance, which was not compensated.
REFERENCES
1. World Health Organization; Poznyak V and
Rekve D, eds. Global Status Report on Alcohol and Health 2018. Published 2018. ISBN: 978-92-4-156563-9
2. Topiwala A, Allan CL, Valkanova V, et al.
Moderate alcohol consumption as risk factor for adverse brain outcomes and cognitive decline: longitudinal cohort study. BMJ. 2017;357:j2353. doi:10.1136/bmj.j2353
3. GBD 2016 Alcohol Collaborators. Alcohol use
and burden for 195 countries and territories, 1990–2016: a systematic analysis for the Global Burden of Disease Study 2016. Lancet. 2018;392 (10152):1015-1035. doi: 10.1016/S0140-6736(18)31310-2
4. Basser PJ, Mattiello J, LeBihan D. Estimation of
the effective self-diffusion tensor from the NMR spin echo. J Magn Reson B. 1994;103(3):247-254. doi:10.1006/jmrb.1994.1037
5. Pfefferbaum A, Sullivan EV, Hedehus M,
Adalsteinsson E, Lim KO, Moseley M. In vivo detection and functional correlates of white matter microstructural disruption in chronic alcoholism. Alcohol Clin Exp Res. 2000;24(8):1214-1221. doi:10. 1111/j.1530-0277.2000.tb02086.x
6. Pfefferbaum A, Sullivan EV. Microstructural but
not macrostructural disruption of white matter in women with chronic alcoholism. Neuroimage. 2002;15(3):708-718. doi:10.1006/nimg.2001.1018 7. Kong LM, Zheng WB, Lian GP, Zhang HD. Acute
effects of alcohol on the human brain: diffusion tensor imaging study. AJNR Am J Neuroradiol. 2012; 33(5):928-934. doi:10.3174/ajnr.A2873
8. Pfefferbaum A, Sullivan EV. Disruption of brain
white matter microstructure by excessive intracellular and extracellular fluid in alcoholism: evidence from diffusion tensor imaging. Neuropsychopharmacology. 2005;30(2):423-432. doi:10.1038/sj.npp.1300623
9. Yeh PH, Simpson K, Durazzo TC, Gazdzinski S,
Meyerhoff DJ. Tract-based spatial statistics (TBSS) of diffusion tensor imaging data in alcohol dependence: abnormalities of the motivational neurocircuitry. Psychiatry Res. 2009;173(1):22-30. doi:10.1016/j.pscychresns.2008.07.012 10. Pfefferbaum A, Rosenbloom M, Rohlfing T,
Sullivan EV. Degradation of association and projection white matter systems in alcoholism detected with quantitative fiber tracking. Biol Psychiatry. 2009;65(8):680-690. doi:10.1016/j. biopsych.2008.10.039
11. Luo J, Shen Z, Chen G, Wang D, Yu X. Pontine
changes in metabolites and axonal fibres of rats following four-week alcohol exposure: in vivo diffusion tensor imaging and 1h-magnetic resonance spectroscopy study at 7.0 T.Alcohol Alcohol. 2017;52(2):145-150.
12. Pfefferbaum A, Zahr NM, Mayer D, Rohlfing T,
Sullivan EV. Dynamic responses of selective brain white matter fiber tracts to binge alcohol and
recovery in the rat. PLoS One. 2015;10(4):e0124885. doi:10.1371/journal.pone.0124885
13. Cosa A, Moreno A, Pacheco-Torres J, et al.
Multi-modal MRI classifiers identify excessive alcohol consumption and treatment effects in the brain. Addict Biol. 2017;22(5):1459-1472. doi:10.1111/ adb.12418
14. Alhassoon OM, Sorg SF, Taylor MJ, et al. Callosal
white matter microstructural recovery in abstinent alcoholics: a longitudinal diffusion tensor imaging study. Alcohol Clin Exp Res. 2012;36(11):1922-1931. doi:10.1111/j.1530-0277.2012.01808.x
15. Zou Y, Murray DE, Durazzo TC, Schmidt TP,
Murray TA, Meyerhoff DJ. Effects of abstinence and chronic cigarette smoking on white matter microstructure in alcohol dependence: diffusion tensor imaging at 4T. Drug Alcohol Depend. 2017; 175:42-50. doi:10.1016/j.drugalcdep.2017.01.032 16. Heilig M, Egli M, Crabbe JC, Becker HC. Acute
withdrawal, protracted abstinence and negative affect in alcoholism: are they linked? Addict Biol. 2010;15(2):169-184. doi:10.1111/j.1369-1600.2009. 00194.x
17. Bach P, Weil G, Pompili E, et al. Incubation of
neural alcohol cue reactivity after withdrawal and its blockade by naltrexone. [published online February 12, 2019]. Addict Biol. doi:10.1111/adb.12717 18. Harper C, Kril J, Daly J. Does a “moderate”
alcohol intake damage the brain? J Neurol Neurosurg Psychiatry. 1988;51(7):909-913. doi:10. 1136/jnnp.51.7.909
19. Harper C, Kril J. Patterns of neuronal loss in
the cerebral cortex in chronic alcoholic patients. J Neurol Sci. 1989;92(1):81-89. doi: 10.1016/0022-510X(89)90177-9
20. Koike H, Mori K, Misu K, et al. Painful alcoholic
polyneuropathy with predominant small-fiber loss and normal thiamine status. Neurology. 2001;56 (12):1727-1732. doi:10.1212/WNL.56.12.1727
21. Rickham PP. Human experimentation: code of
ethics of the World Medical Association: Declaration of Helsinki. BMJ. 1964;2(5402):177. doi:10.1136/bmj.2.5402.177
22. Ciccocioppo R, Economidou D, Cippitelli A,
et al. Genetically selected Marchigian Sardinian alcohol-preferring (msP) rats: an animal model to study the neurobiology of alcoholism. Addict Biol. 2006;11(3-4):339-355. doi:10.1111/j.1369-1600.2006. 00032.x
23. Smith SM, Jenkinson M, Johansen-Berg H, et al.
Tract-based spatial statistics: voxelwise analysis of multi-subject diffusion data. Neuroimage. 2006; 31(4):1487-1505. doi:10.1016/j.neuroimage.2006. 02.024
24. Klein A, Andersson J, Ardekani BA, et al.
Evaluation of 14 nonlinear deformation algorithms applied to human brain MRI registration. Neuroimage. 2009;46(3):786-802. doi:10.1016/j.neuroimage. 2008.12.037
25. Mori S, Oishi K, Jiang H, et al. Stereotaxic white
matter atlas based on diffusion tensor imaging in an ICBM template. Neuroimage. 2008;40(2):570-582. doi:10.1016/j.neuroimage.2007.12.035
26. Paxinos G, Watson C. The Rat Brain in
Stereotaxic Coordinates. Orlando, FL: Elsevier/Academic Press; 2009.
27. De Santis S, Drakesmith M, Bells S, Assaf Y,
Jones DK. Why diffusion tensor MRI does well only some of the time: variance and covariance of white matter tissue microstructure attributes in the living human brain. Neuroimage. 2014;89:35-44. doi:10. 1016/j.neuroimage.2013.12.003
28. Groppe DM, Urbach TP, Kutas M. Mass
univariate analysis of event-related brain potentials/fields, I: a critical tutorial review. Psychophysiology. 2011;48(12):1711-1725. doi:10.1111/ j.1469-8986.2011.01273.x
29. Pfefferbaum A, Lim KO, Desmond JE,
Sullivan EV. Thinning of the corpus callosum in older
alcoholic men: a magnetic resonance imaging study. Alcohol Clin Exp Res. 1996;20(4):752-757. doi:10. 1111/j.1530-0277.1996.tb01682.x
30. Oscar-Berman M, Marinković K. Alcohol:
effects on neurobehavioral functions and the brain. Neuropsychol Rev. 2007;17(3):239-257. doi:10. 1007/s11065-007-9038-6
31. Chumin EJ, Goñi J, Halcomb ME, Durazzo TC,
Dzemidzic M, Yoder KK. Differences in white matter microstructure and connectivity in
nontreatment-seeking individuals with alcohol use disorder. Alcohol Clin Exp Res. 2018;42(5):889-896. doi:10.1111/acer.13629
32. Wheeler-Kingshott CA, Cercignani M. About
“axial” and “radial” diffusivities. Magn Reson Med. 2009;61(5):1255-1260. doi:10.1002/mrm.21965 33. Alfonso-Loeches S, Pascual-Lucas M,
Blanco AM, Sanchez-Vera I, Guerri C. Pivotal role of TLR4 receptors in alcohol-induced
neuroinflammation and brain damage. J Neurosci. 2010;30(24):8285-8295. doi:10.1523/JNEUROSCI. 0976-10.2010
34. Sexton CE, Walhovd KB, Storsve AB, et al.
Accelerated changes in white matter
microstructure during aging: a longitudinal diffusion tensor imaging study. J Neurosci. 2014;34(46): 15425-15436. doi:10.1523/JNEUROSCI.0203-14.2014 35. Engvig A, Fjell AM, Westlye LT, et al. Memory
training impacts short-term changes in aging white matter: a longitudinal diffusion tensor imaging study. Hum Brain Mapp. 2012;33(10):2390-2406. doi:10.1002/hbm.21370
36. Cheung MM, Hui ES, Chan KC, Helpern JA, Qi L,
Wu EX. Does diffusion kurtosis imaging lead to better neural tissue characterization? a rodent brain maturation study. Neuroimage. 2009;45(2):386-392. doi:10.1016/j.neuroimage.2008.12.018