OPTIMAL DESIGNS TO DEVELOP AND SUPPORT AN
EXPERIMENTAL STRATEGY ON INNOVATION OF
THERMOFORMING PRODUCTION PROCESS
Fabrizio Ronchi, Luigi Salmaso1Dipartimento di Tecnica e Gestione dei Sistemi Industriali, Università di Padova, Vicenza, Italia
Mattia De Dominicis
Reckitt Benckiser plc, R&D center, Slough, United Kingdom
Juergen Illert, Krzysztof Krajewski, Rainer Link
Reckitt Benckiser plc, R&D center, Heidelberg, Germany
Luca Monti
Reckitt Benckiser plc, R&D center, Mira, Italia
1. INTRODUCTION
Innovation in thermoforming is a complex challenge. Thermoforming process is affected by various controlled and uncontrolled factors. Definition of factors, oper-ating ranges and a deep understanding of their impact on the final product, is fun-damental. Furthermore, innovating a process requires to exit the paradigm under which people are used to operate, so a full understanding of the existing process has to be achieved in order to be able to explore new solutions.
A research aimed to design a new thermoforming production process has been conducted. The new process should allow to produce a packaging releasing detergent in dishwasher at a well-defined moment during main wash. Key part of the process and focus of this study is the sealing of polymeric film. As result of the research, an experimental strategy on innovation of thermoforming for functional packaging has been developed.
Previous studies on multilayer polymeric films investigated the influence of pro-duction parameters on their performances (Butler and Morris, 2012), the heat sealing properties of packages (Yamadaet al., 2012), and the influence of processing con-ditions on heat sealing behavior (Iwasakiet al., 2016; Zhao and Lu, 2008). Use of statistical approach in thermoforming is well spread. Design of experiment (DOE) is used for process optimization (Morales and Candal, 2006; Labonte and Dubois, 2011; Smith and Vaidya, 2013), and for quality improvement (Sameh Ibrahimet al., 2012), but there is no evidence in scientific literature of use of DOE for innovation of thermoforming production processes for active packaging.
In this study the approach to the problem was based on the principle of DOE. In fact, "The application of experimental design techniques early in process devel-opment can result in: improved process yields; reduced variability and closer con-formance to nominal or target requirements; reduced development time; reduced overall costs" (Montgomery, 2000). DOE was applied starting from the choice of raw material to the final test in dishwasher. Three control factors were initially cho-sen by a team of expert in thermoforming, that are temperature, time and pressure. These factors are commonly used to control material sealing in production line. The experimental approach revealed larger impact with current common technology of other factors such as pre-heating temperature and line pace. Final result was the de-velopment of a procedure that could allow selection of raw material and of factors’ levels combination according to the desired packaging performance by means of an advanced DOE. There are several contributions and examples in scientific literature on techniques used in this study such as optimal design construction (Onukogu and Iwundu, 2007) and response surface (Bertiet al., 2006).
This paper illustrates the experimental strategy. A case study provides an ex-ample of its development and helps to illustrate steps and benefits of a structured experimental design.
2. PRODUCT AND PRODUCTION LINE
The product under development is a single-dose bottle for detergent. It is made out of a polymeric film bent, formed and sealed. The bottle consists of two chambers. Polymeric material is sealed all around the bottle. Two different seals are required. The first seal, from now on named Strong seal, is all around the bottle, apart from the upper part. The second seal, from now on named Weak seal, is in the top of the two chambers. Strong seal is commonly easy to achieve and it is a common application of polymeric film for packaging. Strong seal has to guarantee resistance to shock during transportation, safe use for customers handling packaging, and permanent sealing in time. Weak seal is the challenge of this research. Weak seal has to open at a well-defined moment under external conditions created during washing cycle in dishwasher. It has to be weaker than strong seal that does not have to open under the same conditions. Nevertheless, it has to resist to transportation shocks and guarantee safety of final customer.
In order to understand the complexity of the analysis it is key to comprehend the product mechanism principle. The two seal types’ relation is used with combination of the specific polymer film with ability to retain the memory of shape. During thermoforming process the film is being heated to the glass transition temperatures softening the flat 2D structure to be ready for forming into the new 3D shape defined by the mould. At this stage the material is being stretched, building tensions between polymer chains. Then the mould is cooling down the polymer rapidly "freezing" the tensions. This phenomenon is later used as engine for product release performance in the dishwashing machine. In the cleaning cycle temperature rises above critical level again for the film, unfreezing the tensions, causing material shrinkage. This opposite direction movement of the film (from 3D to 2D) is creating pressure inside of the container. When the pressure is reaching critical level weak seal is breaking but the strong seal remains intact. Thus maintaining a safe margin between strengths ratio of the two seals is critical for the effective opening and release of the product in
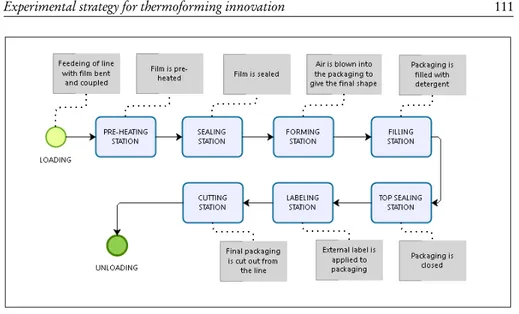
Figure 1 – Scheme of production line.
the right moment in the given environment.
Production lines of packaging based on thermoforming of a polymeric film have a modular structure. Each module or station is devoted to a specific task, and as-sembly of stations is designed according to the desired packaging following general and established rules of thermoforming production. Film is in big rolls and produc-tion is continuous. Scheme of a producproduc-tion line devoted to producproduc-tion of a generic packaging for detergents is given in Figure 1.
3. THE EXPERIMENTAL STRATEGY
The experimental strategy developed thanks to principles of DOE is composed of three phases:
1. Material characterization. Objective: material selection.
Success criteria: i) differentiability between Weak and Strong seal; ii) low vari-ability of seal performance related to small fluctuation of production control factors; iii) low variability of seal performance related to level of control fac-tors.
Factors: i) temperature of sealing jaws; ii) time of sealing; iii) force per cm2
Response: seal strength value. 2. Production in pilot line.
Objective: Weak seal investigation, and selection of samples for dishwasher test. Success criteria: i) same behavior between left and right chamber; ii) low vari-ability of seal performance related to levels and small fluctuation of production control factors.
Factors: i) pre-heating station temperature; ii) pace of the line; iii) time of seal-ing.
3. Performance of final product.
Objective: find successful factor level combinations, and correlation between pressure test results and dishwasher test results.
Success criteria: i) time of opening; ii) complete release of detergent. Response: electric conductivity of water.
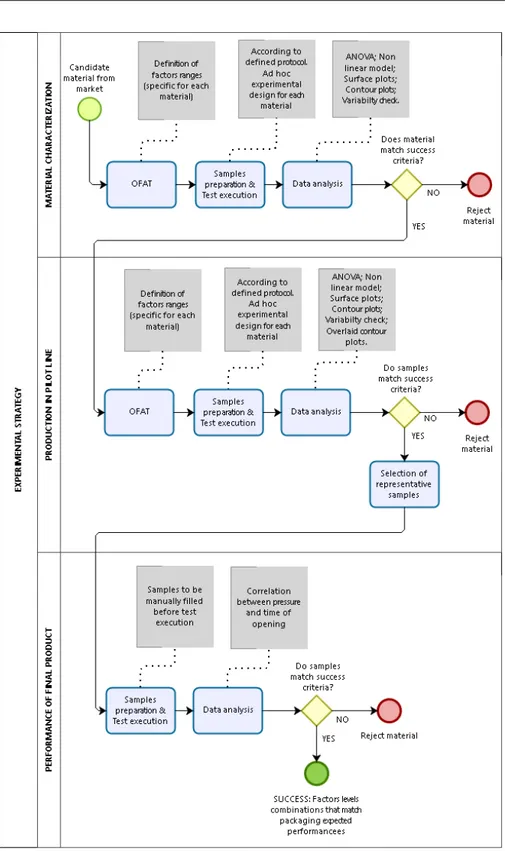
Final result is the selection of factor level combinations in production accord-ing to the desired packagaccord-ing performance takaccord-ing into account peculiar features of material, and correlation between factor level combination and performance. The strategy is summarized in Figure 2.
4. MATERIALS CHARACTERIZATION
The market of polymeric film for thermoforming applications is huge and so is prod-ucts offer from each supplier. Coupled PET/PE films in the market have different features, and selection is made according to the specific industrial application. In the present specific case, novelty is given by the fact that same material is required to perform in two clearly different ways when sealed.
Objective of characterization is the description of features of material based on a certain response variable measured on seals obtained according to different con-figurations of production control factors: i) temperature of sealing jaws, ii) time of sealing, and iii) force per cm2applied to the material. Sealing was performed
control-ling the three factors. Response variable is measured by a tensile strength test giving the force needed to open the seal tearing apart the two extremities. The idea is that the force needed to open the seal is representative of the final performance required to the packaging. The measure is obtained by a dynamometer.
Most important features of material according to the purpose of this study are: 1. Differentiability between weak and strong seal.
Differentiability between weak and strong seal is fundamental. Response vari-able cannot vary within a small interval. It has to show enough difference be-tween values observed at different factor level combinations in order to achieve the control in production of weak and strong seal.
2. Low variability of seal performance related to small fluctuation of production con-trol factors.
Industrial production is in general affected by variability of input factors com-pared to laboratory experimental environment. To gain the control of produc-tion process, levels of control factors have to be chosen among those configura-tions that shows small effects on response variable as consequence of common fluctuations of input factors.
3. Low variability of seal performance related to level of control factors.
Previous experiences of the team involved in the project revealed high variabil-ity of strength test at certain levels of control factors depending on the mate-rial. In presence of such high variability, the phenomenon under investigation is out of control. Industrial production of packaging would be impossible at those factor level combination that gives high and uncontrolled variability in response.
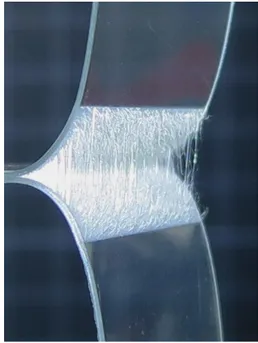
Figure 3 – The seal opening during the tensile strength test of material A. The test measures the force necessary to open the seal tearing apart the extremities of the stripe.
4.1. The experiment
Characterization of first candidate material was performed. In laboratory flat foils were sealed and tested. Sealing procedure was according to a protocol in order to reduce variability of response: flat foil were cut in squares 10 cm x 10 cm, randomly coupled and sealed always at the same distance from the border; sealing bars were steel made Teflon coated in order to avoid sticking to foil surface; temperature stabi-lization time of sealing bars was 10 minutes; once sealed, an overnight curing time have been respected in order to allow stabilization of polymeric bonds; 15 mm width stripes were cut out from the sealed squares and prepared to be tested; external stripes were excluded from analysis to avoid distortions given by border effects. There was a protocol for tensile strength test as well: threshold force before start 0.1 N; dis-placement speed of grippers 50 mm/min; initial gap between grippers 35 mm. Both sealing and testing were performed by the same expert operator for the whole ex-perimental design to avoid variance introduced by different operators. The result of tensile strength test is the maximum force measured to open the seal tearing apart the two extremities, from now on named Seal strength. Measure of seal strength value is in N/15 mm because the opening of the seal is orthogonal to the length that is 15 mm. In Figure 3 seal opening during the tensile strength test.
4.2. Experimental design
At the beginning a one factor at time (OFAT) experiment allowed to identify op-erative ranges of factors for candidate material. Some ramps have been performed for each factor with the other two factors fixed at common levels for sealing, and
ranges for factors were defined: Temperature 120 - 150◦C; Time 1 - 1.6 s; Force 20
- 60 N/cm2. Operative ranges are specific for candidate material. Their definition
should avoid inconsistent or inhomogeneous seal pattern that means too weak seal. At the opposite ranges definition should avoid even too strong seal that lead to mate-rial delamination that occurs when the two layers of PET and PE detach and matemate-rial breaks but seal does not open.
There are different options to design the experiment. Central composite de-signs are commonly used but best option for this study is optimal design to avoid problems with non-cuboidal regions (Anderson and Whitcomb, 2014). In fact, pre-liminary experiments revealed that the factorial space defined according to selected ranges couldn’t be explored entirely without falling into meaningless data regions, that is inconsistent seal pattern or material delamination. Therefore an optimal fac-torial design (Draper and Pukelsheim, 1996; Johnsonet al., 2011) with 3 factors and 4 levels each was used to explore the response space in an effective and resource sav-ing way. Levels of each factor have been selected in order to have almost homoge-nous intervals in the ranges (Table 1). Reduction of number of combination from the full factorial design (64 combinations) to the fractional factorial design (38 com-binations) were achieved according to D-optimality criteria to minimize the vari-ance in the regression coefficients of the fitted design model. The model selected includes terms up to order two, so that second order interactions can be estimated (D-efficiency=0.6825575). Sequence of factors levels combination was random dur-ing specimens preparation. Number of replicates was 8. The number of replicates is precautionary in order to guarantee high power of inferential tests that could be necessary in this explorative phase and taking into account that this test does not need long time to be performed. When needed a sequential experiment is useful to zoom in the factors levels.
TABLE 1
Levels of control factors selected for the experimental design.
Temperature Time Force per cm2 level code value[◦C] level code value [s] level code value [N/cm2]
1 120 1 1.0 1 20
2 130 2 1.2 2 35
3 140 3 1.4 3 45
4 150 4 1.6 4 60
4.3. Analysis of data
The analysis of response variable aims to understand the impact of control factors on the most important features of the material, and to describe how response varies ac-cording to different factor level combinations. Analysis of variance of a full quadratic model allowed evaluating both main factors and interactions. A full quadratic model takes into account all linear terms, all quadratic terms, and all two-way (linear*linear) interactions. Then a backward stepwise model selection procedure at a significance levelα = 0.05 has been applied to obtain the most parsimonious model with all the significant effects and interactions (Table 2).
TABLE 2
ANOVA table of the final model for material A. T= Temperature, t = Time, F = Force per cm2.
Source of variation DF Sum of squares Mean square F-value p-value
Model 7 588.270 84.039 188.30 0.000 T 1 351.874 351.874 788.44 0.000 t 1 39.248 39.248 87.94 0.000 F 1 4.310 4.310 9.66 0.002 T2 1 131.648 131.648 294.98 0.000 t2 1 4.054 4.054 9.08 0.003 T*t 1 8.919 8.919 19.98 0.000 T*F 1 5.655 5.655 12.67 0.000 Residual 296 132.102 0.446 Total 303 720.372
According to p-values the model and the three main factors are significant to explain the response variable. That is the means of the response variable are different at a confidence level of 95% between at least two factor levels. Only two interactions are significant. Interaction between Time and Force per cm2has not a significant impact on the seal strength. Coefficient of determination (R2) of model is 81.66%. Analysis of residuals for ANOVA assumptions does not emphasize particular trends in data patterns, that is no violation of assumptions.
The impact of the terms of final model can be assessed (Table 3). To reduce the impact of non-orthogonal terms, the model was fitted in coded units. The effect of Temperature is much bigger than effect of Time, which in turn is bigger than effect of Force per cm2. Low level of variance inflation factor (VIF) shows absence
of multicollinearity and confirms the goodness of the model.
TABLE 3
Effects of the terms of the final model in coded units and VIF. T= Temperature, t = Time, F = Force per cm2.
Term Effect VIF T 2.9388 1.04 t 0.9818 1.03 F 0.3412 1.04 T2 -2.9797 1.01 t2 -0.5319 1.05 T*t -0.6427 1.04 T*F -0.5334 1.07
The model allows obtaining a nonlinear regression equation for Seal strength: S= −154.60 + 2.014T + 18.96t + 1.286F − 0.006622T2− 2.955t2
− 0.0714T · t − 0.00889T · F ,
where S= Seal strength, T = Temperature, t = Time, and F = Force per cm2.
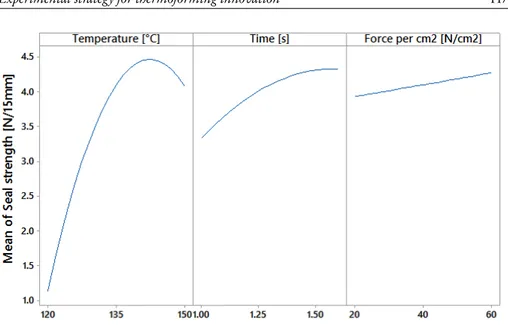
Figure 4 – Main effects plot for Seal strength, fitted means: mean of Seal strength vs. Temper-ature, Time, and Force per cm2.
that have not been tested during the experiment (only in the investigated ranges of factors values).
The effect on the response variable of each factor can be graphically analyzed (Figure 4). The analysis is based on the nonlinear regression equation. Temperature has a high impact on Seal strength. The range of observed values of Seal strength mean is wide (between 0.92 and 4.35 N/15 mm) at Temperature varying. There are steep slopes moving from a level of Temperature to the next one. There is a maximum at approximately 140◦C, then Seal strength decreases at 150◦C. Time effect plot has
generally a positive slope with a flat zone at higher values. Force per cm2effect is
the less evident. Range of observed values of Seal strength mean is between 2.93 and 3.41 N/15 mm at Force per cm2 varying. Graphical analysis of interactions
revealed general interaction between Temperature and Force per cm2, and between
the Temperature and Time only at high levels.
Nonlinear regression equation allows graphical analysis thanks to surface and contour plots. Surface plots show response variable in a 3D space for each couple of factors, while contour plots show response variable in a 2D space for each couple of factors. The remaining factor is fixed at a predefined level.
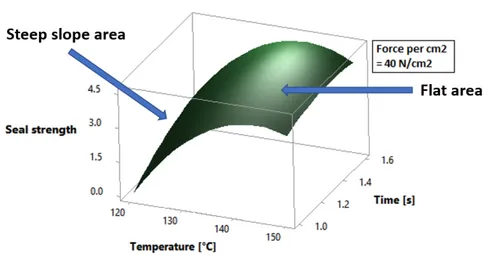
Surface plot gives a clear vision of the factors levels impact on response variable. Surface plots in Figures 5, 6 and 7 are the most representative of the plots analyzed. They show Seal strength versus each couple of factors holding the third at intermedi-ate level. So, for instance, Figure 5 show Seal strength versus Time and Temperature, while Force per cm2is fixed at 40 N/cm2that by the way is not one of the levels of
experimental design. This type of graphs provides interesting information about the impact of factors. In Figure 5 Flat area and Steep slope area are highlighted. Flat area individuates configurations of the two plotted factors levels that have a stable impact on response given the third level fixed. In fact, small variations of the factors don’t
Figure 5 – Surface plot of Seal strength vs. Time and Temperature.
show effects on response. This information is very important in industrial produc-tion to have full control of producproduc-tion process. Small fluctuaproduc-tions of input factors are common and they could have an impact on the stability of output. This informa-tion must be crossed with impact of the third factor taking into account at the same time the plots versus the three couple of factors. On the other hand, steep slope area reveals high impact of variation of factors.
The three plots have been analyzed varying the third factor along the whole range. Flat area and steep slope area have been individuated and assessed for can-didate material.
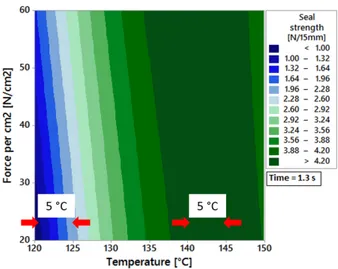
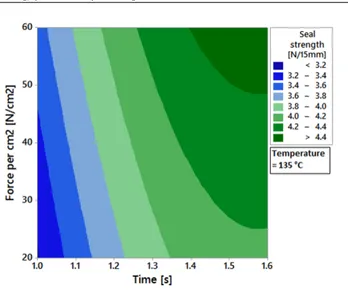
Contour plot is similar to surface plot but it is in two dimensions. In a contour plot two factors are in the axes, while the response variable is shown by different colored areas. The remaining factor is fixed at a predefined level. Contour plots in Figures 8, 9 and 10 are the most representative of the plots analyzed. They show Seal strength versus each couple of factors holding the third at intermediate level. In Figure 8 there is an example of how differentiation between strong and weak seal can be achieved by changing the level of Time and Temperature. Seal strength goes from lowest values in point A (approximately 0.5 N/15 mm) to the highest in point B (approx. 4.2 N/15 mm) holding Force per cm2at 40 N/cm2. Areas contours are
not straight but elliptical because of the combined effect of Temperature and Time. In Figure 9 there is a different representation of the concept of flat area and steep slope area. In fact from 120◦C an increase of 5◦C temperature produces an increase
in the Seal strength of more than 1 N/15 mm (steep slope area). At 140◦C the same
increase does not produce an increase in the Seal strength (flat area). Areas contours are almost straight, the higher impact of Temperature compared to Force per cm2is
evident.
The three plots have been analyzed varying the third factor along the whole range. Differentiability between weak and strong seal has been individuated and assessed for candidate material.
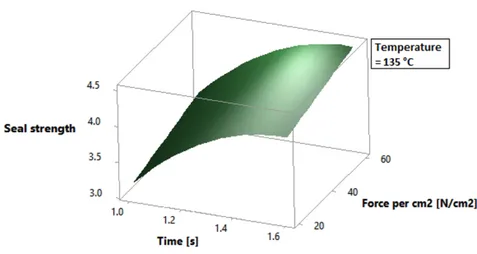
Figure 6 – Surface plot of Seal strength vs. Force per cm2and Temperature.
Figure 8 – Contour plot of Seal strength vs. Time and Temperature.
Figure 10 – Contour plot of Seal strength vs. Force per cm2and Time.
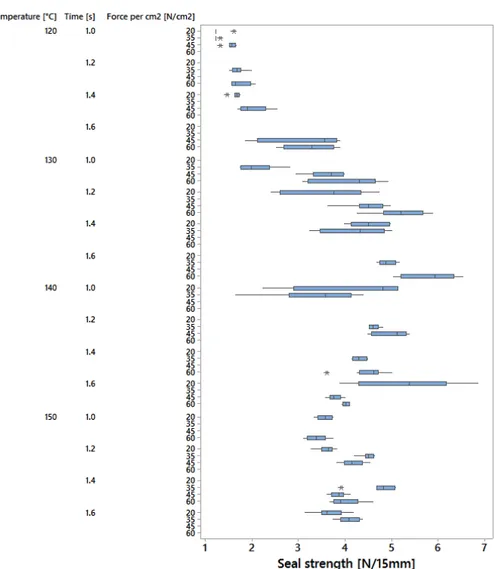
one concerning data variability at certain factor level combinations. Graph in Fig-ure 11 shows Seal strength distributions according to the 38 factors levels combina-tions of the experimental design. Response of candidate material has large variability at certain factor level combinations. Variability could affect properties of final prod-uct since a narrow window is expected for weak seal acceptable performance.
Material characterization is performed to select candidate materials from market according to the most important features required for production. It allows studying differentiability between weak and strong seal, variability of seal performance related to small fluctuation of production control factors, and variability of seal performance related to level of control factors. Candidate material revealed to be a good candidate for scale up to production line.
5. PRODUCTION IN PILOT LINE
The objective of the research is production of packaging from one material, and the challenge is to achieve weak and strong seals. Stations that could impact on seal per-formance are pre-heating station and sealing station. Pre-heating station prepares film before sealing. Film goes through the station, and two hot plates provide ther-mal energy. Temperature of pre-heating station is a control factor. Sealing station is composed of two faced molds that close cyclically and seal the film. Temperature, time and force per cm2are control factors in sealing station.
Traditional approach to packaging production by thermoforming process consid-ers temperature, time and force per cm2the most important factors to control seal
features, while temperature in pre-heating station is used to control film performance in forming station. In fact, pre-heated material is soft and can be easily modelled by blowing air to achieve the final shape, then packaging is cooled down to fix the shape. Traditional approach make sense for traditional packaging, but production of weak seal for the new functional packaging challenged it.
seal and one for the strong seal. These two materials are embedded in one mold, and control of time and force per cm2is independent for the two materials so
differentia-tion is allowed according to these two factors. Temperature control is unique for the whole mold and differentiation is achieved by the different thermal conductivity. A confirmatory experiment based on levels of factors used in laboratory for candidate material was thus performed. Despite temperature, time and force per cm2
condi-tions for weak sealing jaws were the same as the ones used for the experiments in the laboratory, results obtained in the pilot production line were completely different. Weak sealing failed. The systematic experimental approach allowed to individuate the source of failure in the differentiation by thermal conductivity. Laboratory ex-periment settings on flat film are not transferrable to pilot production line taking into account current production system.
As per results of lab experiments for characterization of candidate material, tem-perature has the biggest impact on seal performance compared to time and force per cm2. New factors that could allow control of transferred thermal energy were
investigated. Pre-heating station gives thermal energy to the film. Preliminary ex-periments allowed to select three main control factors for weak seal production in pilot line: i) pre-heating station temperature; ii) pace of the line; iii) time of sealing. Pace of the line is measured in cycles per minute and it allows control of the time the film spends in the preheating station. Control of thermal energy transferred to the film is achieved by combination of pre-heating station temperature and pace of the line. Note that according to material characterization results, force per cm2was
considered negligible as control factor in production line. Sealing was performed controlling the three factors.
The experimental response variable is measured by a burst test giving the pressure needed to open the seal by injecting air into the bottle. The idea is that the packaging shrinks when temperature in dishwasher raises because of the memory form effect of thermoformed polymeric material. The effect of shrinkage is the increase of internal pressure that at the end leads to the packaging opening. The pressure needed to open the seal is thus representative of the final performance required to the packaging.
The final objective is to produce a packaging releasing detergent in dishwasher at a well-defined moment during main wash. Response variable analysis should allow to select samples for dishwasher test in order to find a correlation between packag-ing performance in dishwasher and production factors levels, and in case of success to find the best factors setting for production. The reason of making a selection by means of pressure test before dishwasher test is that the latter is highly time consum-ing.
5.1. The experiment
Candidate material was used to produce batches of finite empty bottles according to an experimental design. In production line presence of uncontrolled factors and of fluctuations of controlled factors is higher compared to lab environment. Production was according to a protocol in order to reduce variability of response: production was in steady state; temperature stabilization time of pre-heating station was 10 minutes; sealing station temperature was fixed at 120◦C; force per cm2applied to weak seal
was 410 N/cm2. A curing time of at least 1 day have been respected in order to
air is injected in a flat area of packaging far from seals; air is blown into the bottle according to a pressure ramp with steps of amplitude 0.02 bar; interval between steps is 5 seconds; pressure ramp starts at 0.05 bar and upper limit is 0.5 bar. Burst test were performed by the same expert operator for the whole experimental design to avoid variance introduced by different operators. The result of burst test is the minimum pressure needed to open the bottle. Pressure test device provides the relative pressure (over atmospheric pressure) as percentage of 1 bar.
The experiment is focused on weak seal. In fact, proven that candidate material allowed differentiability of performance in material characterization section, time and force per cm2for strong seal in sealing station were tentatively chosen in order
to guarantee a minimum pressure at burst test of 0.5 bar.
5.2. Experimental design
At the beginning a OFAT experiment allowed to identify operative ranges of factors (Table 4). Some ramps have been performed for each factor with the other two fac-tors fixed at common levels for production, and ranges for facfac-tors were defined: pre-heating temperature 120 - 130◦C; pace of the line 11 - 14 cycles per minute; sealing
time 1.6 - 2.2 s. Operative ranges are specific for candidate material. Defined ranges should avoid inconsistent or inhomogeneous seal pattern that means too weak seal. At the opposite ranges definition should avoid even too strong seal that prevents bottle opening in dishwasher. As per the first experimental campaign best option to design the experiment is Optimal Design in order to avoid problems with non-cuboidal regions. Therefore an optimal factorial design with 3 factors and 4 levels each was used to explore the response space in an effective and resource saving way. Levels of each factor have been selected in order to have almost homogenous inter-vals in the ranges. Reduction of number of combination from the full factorial design (64 combinations) to the fractional factorial design (38 combinations) were achieved according to D-optimality criteria to minimize the variance in the regression coeffi-cients of the fitted design model. The model selected includes terms up to order two, so that second order interactions can be estimated.
Packaging is composed of two chambers: left chamber and right chamber. They were tested separately, that is for each packaging only left or right chamber were tested. In fact packaging is asymmetric and different geometry between the cham-bers could have an impact on weak seal performance. Number of replicates was 10, 5 to test left chamber and 5 to test right chamber. The number of replicates is precau-tionary in order to guarantee high power of inferential tests that could be necessary in this explorative phase.
TABLE 4
Levels of control factors selected for the experimental design. Pre-heating temperature Pace of the line Sealing time level code value[◦C] level code value[cycles/min] level code value[s]
1 120 1 11 1 1.6
2 123 2 12 2 1.8
3 127 3 13 3 2.0
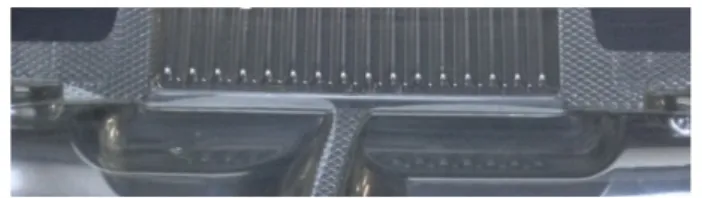
Figure 12 – Weak seal of left chamber and right chamber of the bottle.
5.3. Analysis of data
Data analysis was based on the same approach used for material characterization. General steps of analysis are here briefly summarized. For each chamber, Analysis of Variance of a full quadratic model allowed evaluating both main factors and in-teractions taking into account all linear terms, all squared terms, and all two-way (= linear*linear) interactions. Then a backward stepwise model selection procedure at a significance levelα = 0.05 has been applied to obtain the most parsimonious model with all the significant effects and interactions. The impact of the terms of final model was assessed. VIF was useful to exclude multicollinearity. The models allowed obtaining a nonlinear regression equation for response variable. Graphical analysis of the effect on the response variable of each factor and second order inter-actions was performed as well as analysis of surface and contour plots. Last but not least, graphical analysis of data variability at different factors levels combinations.
In general, an experiment performed in industrial plant presents a limit in data analysis compared to one performed in laboratory. Surface and contour plots graph-ical analysis in material characterization allowed to assess impact of fluctuation of factors. In fact, laboratory environment enables high control of factors, and variabil-ity observed at a certain factors levels combination is mainly related to uncontrolled factor, as for instance homogeneity of material. In production line, control of factors is affected by typical variability of industrial environment and sensors are in general less sensitive. The effect of fluctuation of control factors is thus confounded with the effect of variability of uncontrolled factors. This limit should be taken into account when drawing conclusion from data analysis.
Range of observed values was from 0% to 50%, meaning that choice of factor levels allowed investigation of the whole interval of interest of response values. The three factors pre-heating station temperature, pace of the line and time of sealing are significant in the model of both chambers. Pace of the line is the most important factor when considering the impact on pressure value required to open the weak seal of both chambers of the samples. Pressure value increases at low levels of cycles per minute, while it decreases at high levels of cycles per minute.
One important result was that the test revealed a non-symmetric behavior of the left and right chamber of the bottle. Geometry influences the way the chambers open. In Figure 12 weak seal area of the two chambers. Different distributions of response values were observed between the two chambers for many factor level com-binations. As a consequence, nonlinear regression equations obtained from the mod-els of left and right chambers were different. A well performing packaging should guarantee that detergent is delivered from the two chambers at around the same time during washing cycle. Therefore, those factor level combinations that could allow
Figure 13 – Overlaid contour plot of Pressure of right chamber and left chamber vs. Pace of the line and Preheating temperature. Interval of response from 25% to 30%.
similar performance were investigated.
Response contour plots of the two chambers were compared by overlapping them two by two. The analysis of overlaid contour plots was performed for each couple of factors. Analysis allowed identification of areas where predicted responses were similar. Examples of overlaid contour plots in Figures 13, 14 and 15 are for interval of response from 25% to 30%. Intervals in the whole range of response have been investigated. Furthermore, the three plots have been analyzed varying the third fac-tor along the whole range. The statistical model allowed to select those facfac-tor level combinations that results in a similar behavior of the two chambers.
Pilot line experiments are performed on those materials that show promising re-sults according to material characterization. The objective is the selection of samples showing different performances at pressure test to perform the most significant test: the test in dishwasher. Selection must consider: i) coverage of different pressure test performances, ii) similar behavior of the two chambers, and iii) low variability of re-sponse according to factor level combinations. Candidate material allowed selection of samples to be tested in dishwasher.
6. PERFORMANCE OF FINAL PRODUCT
Performance of final product can be evaluated according two dimensions: i) time of opening during washing cycle, ii) complete vs. partial release of detergents. These two dimensions are representative of the expectations of final customer. In fact, pack-aging has to deliver detergent on or before a defined threshold so that there is enough time for detergent for an effective cleaning. Furthermore, complete release of deter-gent is given as qualifier by marketing.
The two dimensions were investigated by a dishwasher test. Time of opening was established measuring the electric conductivity of water in dishwasher. Electric conductivity changes when detergent is released because of chemical composition.
Figure 14 – Overlaid contour plot of Pressure of right chamber and left chamber vs. Time and Pace of the line. Interval of response from 25% to 30%.
Figure 15 – Overlaid contour plot of Pressure of right chamber and left chamber vs. Time and Preheating temperature. Interval of response from 25% to 30%.
Figure 16 – Observed electric conductivity of water[mS/cm], water temperature [◦C], and
amount of water[l] during a washing cycle.
The amount of delivered detergent was observed at the end of washing cycle. This test is time consuming (a washing cycle is about 100 minutes) so packaging samples to be tested were selected according to their response at the pressure test.
6.1. The experiment
Packaging samples were manually filled with detergent. They were tested individu-ally in an intensive washing cycle (70◦C) without dish load, all with the same
dish-washer. Sensor measured i) electric conductivity of water[mS/cm], ii) water temper-ature[◦C], and iii) amount of water [l]. In Figure 16 there is an example of measured
values during an experimental run.
Measured data provide the exact moment in which the two chambers open. Ob-server can’t discriminate between left and right chamber, but only between first and second release. Crossing electric conductivity data with water temperature and amount, it can be established even in which part of washing cycle the two chambers open. Main wash last from minute 22 to minute 80. In Figure 16, for instance, first chamber opens during main wash, while second chamber opens during rinse that by the way is too late.
Samples produced according 8 different factor level combinations were tested. Factors levels combination were classified according to pressure test in three groups: pressure< 20%, pressure 20% - 30%, and pressure > 30%.
6.2. Analysis of data
Analysis of data aims to individuate those factors levels combinations that satisfy minimum criteria in the dimensions under investigation. Furthermore, a correlation between pressure test and opening time is investigated. Mean data observed are in Table 5.
TABLE 5
Observed opening time[minutes] and leftover liquid [%].
Classification in Pressure test Opening time Leftover liquid pressure test left right 1st 2nd left right
chamber chamber release release chamber chamber
< 20% 15.4 13.8 N/A N/A N/A N/A
20%-30% 21.4 21.4 57 91 20 10 20%-30% 22.5 22.2 56 89 20 10 20%-30% 29.0 25.8 58 90 10 10 20%-30% 29.4 23.0 56 86 10 10 20%-30% 28.2 25.0 58 90 10 10 > 30% 40.0 33.8 98 N/A 100 40 > 30% 39.4 33.8 99 N/A 100 50
In general, test reveals a basic correlation between product release and pressure: − Pressure test value < 20%: packaging does not satisfy minimum safety criteria
for customer; detergent leak out during manual activation before placing in dishwasher.
− Pressure test value 20 - 30%: first detergent release is in the main wash at minute interval 56 - 58, second release is during rinse cycle; product release is in the range from 80% to 90%.
− Pressure test value > 30%: only one chamber opens at the end of the rinse cycle; there is partial detergent release.
None of the selected samples reached the minimum quality criteria. Candidate ma-terial revealed unsatisfactory performance in the final product. Only a systematic approach allowed the investigation of the whole factorial space and the final evidence based assessment of the material.
7. CONCLUSIONS
An experimental strategy on innovation of thermoforming production process has been developed. DOE techniques were used in designing and analyzing all the phases of the strategy. DOE enhanced innovation capability allowing reduction of system-atic errors and distortions, full exploration of factorial space, and reduction of num-ber of tests (Montgomery, 2000; Johnsonet al., 2011). The experimental strategy allows selection of material and correlation of control factor levels to packaging per-formance for each tested material.
Traditional approach (Iwasakiet al., 2016; Zhao and Lu, 2008) to production con-trol in thermoforming process was challenged. DOE allowed to identify and over-come the mismatch between control factors in laboratory and in production line.
Anyway, mismatch suggests development of 2 separated sealing stations: one for strong seal and one for weak seal. In this way same control factors could be used in laboratory and in production line. Result would be a direct correlation between per-formance in dishwasher and control factors in laboratory. The experimental chain would be shorter and a significant reduction of number of tests should be allowed.
ACKNOWLEDGEMENTS
The authors wish to thank the Associate Editor and the anonymous Referees for the precious comments which helped to improve the quality of the paper.
REFERENCES
J. ANDERSON, P. WHITCOMB(2014). Practical aspects for designing statistically op-timal experiments. Journal of Statistical Science and Application, 2, no. 3, pp. 85–92.
G. BERTI, S. BONNINI, M. MONTI, L. SALMASO(2006).Response surface modelling of thermo-mechanical fatigue in hot forging. Statistica, 66, no. 2, pp. 171–182. T. BUTLER, B. MORRIS(2012). Pe-based multilayer film structures. In S. EBNESAJ
-JAD(ed.),Plastic Films in Food Packaging: Materials, Technology and Applications, Elsevier Inc., New York, NY, pp. 21–52.
N. DRAPER, F. PUKELSHEIM(1996).An overview of design of experiments. Statistical Papers, 37, no. 1, pp. 1–32.
T. IWASAKI, W. TAKARADA, T. KIKUTANI(2016).Influence of processing conditions on heat sealing behavior and resultant heat seal strength for peelable heat sealing of multilayered polyethylene films. Journal of Polymer Engineering, 36, no. 9, pp. 909–916.
R. JOHNSON, D. MONTGOMERY, B. JONES(2011).An expository paper on optimal design. Quality Engineering, 23, no. 3, pp. 287–301.
M. LABONTE, C. DUBOIS (2011). Optimization of molding conditions of a plug-assisted thermoformed thin containers in a high speed and volume production context. InAnnual Technical Conference - ANTEC, Conference Proceedings. vol. 3, pp. 2515– 2519.
D. MONTGOMERY (2000). Design and Analysis of Experiments. John Wiley & Sons,Inc., Danvers, MA.
R. MORALES, M. CANDAL(2006).Thermoforming process optimization by using the experiment design technique. In Annual Technical Conference - ANTEC, Conference Proceedings. vol. 5, pp. 2641–2645.
I. ONUKOGU, M. IWUNDU(2007). A combinatorial procedure for constructing d-optimal exact designs. Statistica, 67, no. 4, pp. 415–423.
M. SAMEHIBRAHIM, M. MANSOUR, M. ABED(2012). Improving the quality of thermoforming process using a proposed analysis algorithm (a case study). Applied Mechanics and Materials, 110-116, pp. 1466–1476.
J. SMITH, U. VAIDYA(2013). Processing optimization of deformed plain woven ther-moplastic composites. Applied Composite Materials, 20, no. 6, pp. 1265–1272. K. YAMADA, H. MATSUURA, K. MIYATA, Y. OYA, H. HAMADA(2012).
Peelabil-ity and morphology of easy-peel films. In Annual Technical Conference - ANTEC, Conference Proceedings. vol. 2, pp. 1361–1365.
M. ZHAO, L. LU(2008).Effect of heat sealing temperature on heat-sealing performance of pet/al/pe packaging laminated film. Hecheng Shuzhi Ji Suliao/China Synthetic Resin and Plastics, 25, no. 1, pp. 57–61.
SUMMARY
The experimental strategy developed thanks to the DOE methodology enhance innovation capability in the field of thermoforming production processes for active packaging. It is com-posed of three phases: i) material characterization, ii) production in pilot line, and iii) perfor-mance of final product. It allows selection of material, and correlation between control factors in production and performances of final product. Use of optimal designs allows reduction of number of tests, and in the meantime a full exploration of factorial space.
Keywords: Thermoforming; Production process; Active packaging; Optimal design; Design of experiment.