EXTENDED NEW GENERALIZED LINDLEY DISTRIBUTION
D. S. Shibu1
Department of Statistics, University College, Trivandrum -695 034, India.
M. R. Irshad
Department of Statistics, University College, Trivandrum -695 034, India.
1. Introduction
In many applied sciences such as economics, engineering and finance, amongst others, modeling and analyzing lifetime data are crucial. Life time distributions are used to describe, statistically the length of the life of a system. Lindley (1958) introduced a one-parameter life time distribution, known as Lindley distribution (1LD), whose probability density function (pdf) is obtained by mixing the den-sities exponential (θ) and gamma (2, θ) with mixing probabilities 1+θθ and 1+θ1 respectively. Thus the pdf of one parameter Lindley distribution is given by
f1(x) =
θ2
1 + θ(1 + x)e
−θx; x > 0, θ > 0. (1)
The corresponding cumulative distribution function (cdf) F1(x) has been obtained
by using the definition,
F1(x) = x ∫ 0 f (t)dt = x ∫ 0 θ2 1 + θ(1 + t)e −θtdt.
Simple algebra provides F1(x) = 1−
θ + 1 + θx 1 + θ e
−θx; x > 0, θ > 0, (2)
where θ is the scale parameter. Although the Lindley distribution has drawn little attention in the statistical literature over the great popularity of the well known exponential distribution. Recently some researchers have proposed new
classes of distributions based on modification of the one parameter Lindley distri-bution. Ghitany et al. (2008) have studied various properties of this distribution and showed that (1) provides a better model for some applications than the ex-ponential distribution. Mazucheli and Achcar (2011) discussed the applications of Lindley distribution to competing risks life time data. A discrete version of this distribution has been suggested by Deniz and Ojeda (2011) having its ap-plications in count data related to insurance. Shanker et al. (2013) introduced a two-parameter Lindley distribution (2LD) for modeling waiting and survival times data. Its pdf is given by
f2(x) =
θ2
θ + α(1 + αx)e
−θx; x > 0, θ > 0, α >−θ. (3)
Zakerzadeh and Dolati (2009) obtained a generalized Lindley distribution (GLD) and discussed various properties having the following pdf
f3(x) =
θ2(θx)α−1(α + γx) (γ + θ)Γ(α + 1) e
−θx; x > 0, α, θ, γ > 0. (4)
Bakouch et al. (2012) obtained an extended Lindley distribution and discussed some of its properties and applications. Elbatal et al. (2013) introduced a new generalized Lindley distribution (NGLD) with pdf
f4(x) = 1 1 + θ [ θα+1xα−1 Γ(α) + θβxβ−1 Γ(β) ] e−θx; x > 0, θ, α > 0. (5) Ghitany et al. (2012) introduced Marshall-Olkin extended Lindley distribution and investigate its structural properties. Hassan (2014) have proposed new classes of distributions by modifying the Lindley distribution and studied several properties of his proposed generalization. Liyanage and Pararai (2014) introduced a gen-eralized power Lindley distribution and explore its properties. Bhati and Malik (2015) developed Lindley exponential distribution. Ashour and Eltehiwy (2015) developed exponentiated power Lindley distribution and narrated its necessity compared with other models. Application of the weighted form of new Lindley distribution are discussed by Asgharzadeh et al. (2016) . Bayes estimates of Lind-ley distribution under linux loss function are extensively discussed by Metiri et al. (2016). Shanker et al. (2016) discussed the role of Quasi Lindley distribution for modeling lifetime data. Nedjar and Zeghdoudi (2016) introduced gamma Lindley distribution and documented the superiority of their model based on simulation study. Kadilar and Cakmakyapan (2016) introduced in the literature, the Lindley family of distributions.
To increase the flexibility for modeling purposes it will be useful to consider further extensions of this distribution. Hence in this paper our aim is to intro-duce an extended version of the new generalized Lindley distribution and called it as extended new generalized Lindley distribution (ENGLD), which offers a more flexible distribution for modeling lifetime data.
The content of the paper is organized as follows. In section 2 , we introduce an extended new generalized Lindley distribution and discussed some of its ba-sic properties. Certain important properties of extended new generalized Lindley
distribution, such as reliability measures, inequality measures and expression for R´enyi entropy are discussed in section 3 . The estimation of parameters of ex-tended new generalized Lindley distribution using method of moments and method of maximum likelihood are given in section 4 . A real life situation is considered here for comparing the performance of extended new generalized Lindley distri-bution with other Lindley forms of distridistri-butions.
2. Extended new generalized Lindley distribution
In this section, we present definition and some important properties of the ex-tended new generalized Lindley distribution. Here after we use the short form ENGLD for extended new generalized Lindley distribution.
DEFINITION 1. A continuous random variable X is said to follow ENGLD if its pdf f (x) has the following form.
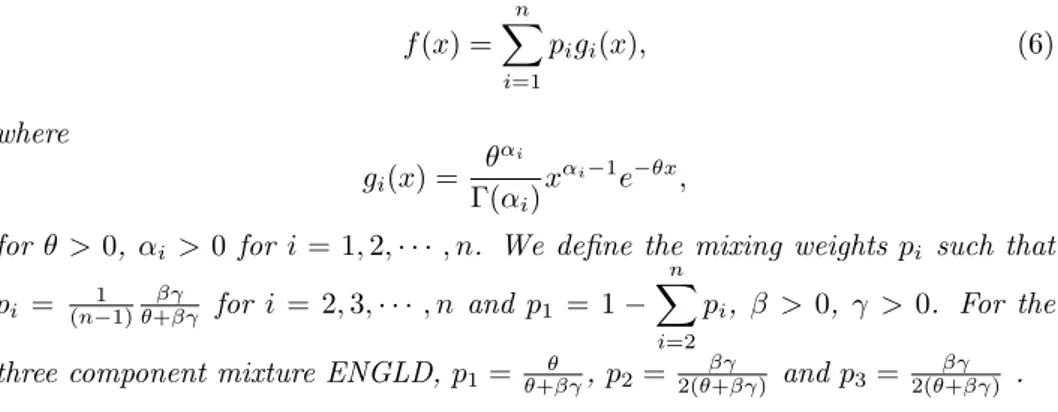
f (x) = n ∑ i=1 pigi(x), (6) where gi(x) = θαi Γ(αi) xαi−1e−θx,
for θ > 0, αi > 0 for i = 1, 2,· · · , n. We define the mixing weights pi such that
pi = (n−1)1 θ+βγβγ for i = 2, 3,· · · , n and p1 = 1− n
∑
i=2
pi, β > 0, γ > 0. For the
three component mixture ENGLD, p1= θ+βγθ , p2= 2(θ+βγ)βγ and p3= 2(θ+βγ)βγ .
Figure 1, represents the graph of the pdf of ENGLD for different set of parameters.
Figure 1 – Plots of the pdf of ENGLD for different values of parameters.
Special cases:
(1). If n = 2, α1 = 1, α2 = 2, β = 1 and γ = 1, then ENGLD becomes one
(2). If n = 2, α1= 1, α2= 2 and γ = 1, then ENGLD becomes the two parameter
Lindley distribution (2LD).
(3). If n = 2, α1= α, α2= α+1 and β = 1, then ENGLD becomes the generalized
Lindley distribution (GLD).
(4). If n = 2, α1 = α, α2 = δ β = 1 and γ = 1 then ENGLD becomes the new
generalized Lindley distribution (NGLD).
RESULT 1. The cdf of ENGLD is related to the cdf of its components by the relation, F (x) = n ∑ i=1 pi Γ(αi) γ(αi, θx). (7) Proof. We have F (x) = x ∫ 0 f (t)dt = x ∫ 0 n ∑ i=1 pi θαi Γ(αi) tαi−1e−θtdt = n ∑ i=1 pi Γ(αi) x ∫ 0 θ(tθ)αi−1e−θtdt = n ∑ i=1 pi Γ(αi) γ(αi, θx), where γ(s, t) = t ∫ 0 xs−1e−xdx, is called lower incomplete gamma function.
REMARK 1. The survival function of ENGLD is obtained as F (x) = 1− F (x) = 1 − n ∑ i=1 pi Γ(αi) γ(αi, θx). (8)
RESULT 2. The density function of ENGLD is log-concave.
Proof. To prove the density function of ENGLD is log-concave, it is enough to prove that, second derivative of the logarithm of density function is negative. The first and second derivative of logf (x) are obtained as,
d dxlogf (x) = 1 x n ∑ i=1 (αi− 1) − nθ
and d2 dx2logf (x) =− 1 x2 n ∑ i=1 (αi− 1).
Evidently dxd22logf (x)≤ 0. This proves the result.
Since the density function is log-concave the MLE of the parameters of ENGLD are unique under the parametric restrictions (see, Puig (2003) ).
RESULT 3. The moment generating function (mgf ) of ENGLD is related to the mgf of its components by the relation,
MX(t) = n ∑ i=1 pi ( 1− t θ )−αi
Proof. By definition of moment generating function, we have MX(t) = E(etX) = ∞ ∫ 0 etxf (x)dx = ∞ ∫ 0 etx n ∑ i=1 pi θαi Γ(αi) xαi−1e−θxdx = n ∑ i=1 pi θαi Γ(αi) ∞ ∫ 0 e−(θ−t)xxαi−1dx = n ∑ i=1 pi ( 1−t θ )−αi .
RESULT 4. The rthraw moment about origin of ENGLD is related to the rth raw moment about origin of its components by the relation,
µ′r= n ∑ i=1 pi Γ(αi) Γ(αi+ r) θr ; r = 1, 2,· · · (9)
Proof. By definition, we have
µ′r= n ∑ i=1 pi θαi Γ(αi) ∞ ∫ 0 xαi+r−1e−θxdx = n ∑ i=1 pi θαi Γ(αi) Γ(αi+ r) θαi+r = n ∑ i=1 pi Γ(αi) Γ(αi+ r) θr .
Taking r = 1, 2, 3 and 4 in (9), the first four raw moments about origin are obtained as, µ′1= n ∑ i=1 piαi θ , µ ′ 2= n ∑ i=1 pi(αi+ 1)αi θ2 , µ ′ 3= n ∑ i=1 pi(αi+ 2)(αi+ 1)αi θ3 and µ′4= n ∑ i=1 pi(αi+ 3)(αi+ 2)(αi+ 1)αi θ4 . Also, Variance, µ2= n ∑ i=1 piα2i + ( 1− n ∑ i=1 piαi ) n ∑ i=1 piαi θ2 .
REMARK 2. The ENGLD is over dispersed for all values of 0 < θ < 1, αi> 0 for i = 1, 2,· · · , n and 0 < pi < 1 irrespective of values of β and γ. That
is, the variance of the distribution is greater than the mean. In all other cases mean is greater than the variance, that is the distribution is under dispersed.
3. Certain measures of reliability, inequality and entropy
In this section we derived expressions for certain reliability measures such as hazard rate function, reversed hazard rate function, cumulative hazard rate function, vitality function and mean residual life function associated to ENGLD. Also we have obtained certain inequality measures.
3.1. Hazard rate function
The hazard rate provides the trajectory of risk and is widely used in lifetime stud-ies. Let X denote a lifetime variable with distribution function F (x) = P r(X≤ x) and probability density function f (x) = dF (x)dx . Then the hazard rate function is given by
h(x) = f (x) F (x),
where F (x) = 1− F (x) is the survival function of X. That is, h(x)dx represents the instantaneous chance that an individual will die in the interval (x, x+dx) given that this individual is alive at age x. Simple algebra provides that the hazard rate function of the ENGLD is obtained as
h(x) = n ∑ i=1 pi θαi Γ(αi) xαi−1e−θx 1− n ∑ i=1 pi Γ(αi) γ(αi, θx) . (10)
3.2. Reversed hazard rate function
Reversed hazard rate (RHR) function is an important measure as a tool in the analysis of the reliability of both natural and man-made systems. Let X be a non-negative random variable representing life-times of individuals having absolutely continuous distribution function F (x) and pdf f (x). Then the reversed hazard rate function is given by
T (x) = f (x) F (x). For ENGLD, T (x) is obtained as
T (x) = n ∑ i=1 pi θαi Γ(αi) xαi−1e−θx n ∑ i=1 pi Γ(αi) γ(αi, θx) .
3.3. Cumulative hazard rate function
Cumulative hazard rate function is the total number of failure or deaths over an interval of time, and it is defined as
H(x) =−logF (x), where F (x) is the survival function. Clearly H(x) is a non-decreasing function of x satisfying;
(a) H(0) = 0 and (b) lim
x→∞H(x) =∞.
Using (8), the H(x) of ENGLD is obtained as
H(x) =−log [ 1− n ∑ i=1 pi Γ(αi) γ(αi, θx) ] . 3.4. Vitality function
If X is a non-negative random variable having an absolutely continuous distri-bution function F (x) with pdf f (x). The vitality function associated with the random variable X is defined as
ν(x) = E[X|X > x] (11)
In the reliability context (11) can be interpreted as the average life span of compo-nents whose age exceeds x. It may be noted that the hazard rate reflects the risk of sudden death within a life span, where as the vitality function provides a more direct measure to describe the failure pattern in the sense that it is expressed in terms of increased average life span.
RESULT 5. The vitality function of ENGLD, has the following form ν(x) = 1 θ n ∑ i=1 pi Γ(αi) Γ(αi+ 1, θx) 1− n ∑ i=1 pi Γ(αi) γ(αi, θx) (12)
Proof. The equation (11) can be written as,
ν(x) = 1 F (x) ∞ ∫ x tf (t)dt. (13) Also, we have ∞ ∫ x tf (t)dt = ∞ ∫ x t n ∑ i=1 pi θαi Γ(αi) tαi−1e−θtdt = n ∑ i=1 pi θαi Γ(αi) ∞ ∫ x e−θttαidt = 1 θ n ∑ i=1 pi Γ(αi) Γ(αi+ 1, θx) (14)
using the upper incomplete gamma function
Γ(s, t) =
∞
∫
x
xs−1e−xdx.
Substituting (8) and (14) in (13), we get the required result.
3.5. Mean residual life function
Mean residual life function or remaining life expectancy function at age x is defined to be the expected remaining life given survival to age x. For a continuous random variable X, with E(X) <∞, then mean residual life function (MRLF) is defined as the Borel measurable function
m(x) = E[X− x|X > x] = 1 F (x) ∞ ∫ x F (t)dt. (15)
MRLF is sometimes considered as a superior measure to describe the failure pat-tern as compared to hazard rate since the former focuses attention on the average lifetime over a period of time while the latter on instantaneous failure at a point of
time. Also MRLF can be expressed in terms of vitality function. That is, equation (15) can also be written as
m(x) = ν(x)− x.
The mean residual life function, m(x) of ENGLD is obtained as,
m(x) = 1 θ n ∑ i=1 pi Γ(αi) Γ(αi+ 1, θx) 1− n ∑ i=1 pi Γ(αi) γ(αi, θx) − x (16) 3.6. Inequality measures
Lorenz and Bonferroni curves are income inequality measures that are widely use-ful and applicable to some other ares including reliability, demography, medicine and insurance (see, Bonferroni (1930) ). Also Zenga curve introduced by Zenga (2007) are another widely used inequality measure. In this section, we will derive Lorenz, Bonferroni and Zenga curves for the ENGLD. The Lorenz curve is defined by LF(x) = x ∫ 0 tf (t)dt E(X) . (17)
Simple algebra provides the Lorenz curve for ENGLD is given by
LF(x) = n ∑ i=1 pi Γ(αi) γ(αi+ 1, θx) n ∑ i=1 piαi . (18)
Also, the Bonferroni curve is defined by
BF(x) = x ∫ 0 tf (t)dt E(X)F (x). (19)
The Bonferroni curve for ENGLD is obtained as
BF(x) = n ∑ i=1 pi Γ(αi) γ(αi+ 1, θx) n ∑ i=1 piαi n ∑ i=1 pi Γ(αi) γ(αi, θx)
and the Zenga curve is defined by
AF(x) = 1−
µ−(x)
where µ−(x) = x ∫ 0 tf (t)dt F (X) = n ∑ i=1 pi Γ(αi) γ(αi+ 1, θx) θ n ∑ i=1 pi Γ(αi) γ(αi, θx) . Also µ+(x) = ∞ ∫ x tf (t)dt 1− F (x) = n ∑ i=1 pi Γ(αi) Γ(αi+ 1, θx) θ { 1− n ∑ i=1 pi Γ(αi) γ(αi, θx) }.
Substituting the values of µ−(x) and µ+(x) in (20), we get the value of AF(x).
Plots of Lorenz, Bonferroni and Zenga curves corresponding to the distribution function F (x) are given in Figure 2.
Figure 2 – Plots of Lorenz, Bonferroni and Zenga curves.
3.7. Entropies
In information theory, the study of entropy has gained momentum in the theo-retical perspective as well as in terms of its applications. Among the number of entropies available in the literature, one of the most popular entropy measure is
R´enyi entropy (see, Renyi (1961)). If X has the pdf f (x), then R´enyi entropy is defined by Hϑ(x) = 1 1− ϑlog ∞ ∫ 0 fϑ(x)dx; ϑ > 0 and ϑ̸= 1.
Theorem 1. The R´enyi entropy function for ENGLD has the following form
Hϑ(x) = 1 1− ϑlog n ∑ i=1 ( piθαi Γ(αi) )ϑ Γ(ϑ(αi− 1) + 1) (θϑ)(ϑ(αi−1)+1) . (21)
Proof. Using the definition of R´enyi entropy, we have
Hϑ(x) = 1 1− ϑlog ∞ ∫ 0 ( n ∑ i=1 pi θαi Γ(αi) xαi−1e−θx )ϑ dx = 1 1− ϑlog n ∑ i=1 pϑ iθϑαi (Γ(αi))ϑ ∞ ∫ 0 xϑ(αi−1)e−θϑxdx = 1 1− ϑlog n ∑ i=1 ( piθαi Γ(αi) )ϑ ∞∫ 0 xϑ(αi−1)+1−1e−θϑxdx = 1 1− ϑlog n ∑ i=1 ( piθαi Γ(αi) )ϑ Γ(ϑ(αi− 1) + 1) (θϑ)(ϑ(αi−1)+1) .
Hence the proof. Moreover, the Shannon entropy is defined by E[logf (x)]. This is a special case derived from R´enyi entropy. That is when ϑ −→ 1 in (21), it reduces to Shannon entropy.
4. Estimation
In this section we discuss the estimation of parameters of the ENGLD by method of moments and method of maximum likelihood. In the method of moment estima-tion, the first five population moments of ENGLD are equated to the corresponding sample moments and obtain the following system of equations:
n ∑ i=1 piαi θ = m ′ 1 n ∑ i=1 pi(αi+ 1)αi θ2 = m ′ 2 n ∑ i=1 pi(αi+ 2)(αi+ 1)αi θ3 = m ′ 3
n ∑ i=1 pi(αi+ 3)(αi+ 2)(αi+ 1)αi θ4 = m ′ 4 n ∑ i=1 pi(αi+ 4)(αi+ 3)(αi+ 2)(αi+ 1)αi θ5 = m ′ 5.
Now the moment estimators of the parameters of ENGLD are obtained by solving the non-linear system of equations numerically by using mathematical softwares such as MATHCAD, MATHEMATICA, MATHLAB etc.
In method of maximum likelihood estimation (MLE), the parameters of the ENGLD are estimated by maximizing the following log likelihood function with respect to the parameters.
logL = n ∑ i=1 log ( g ∑ i=1 pi θαi Γ(αi) xαi−1 i e−θxi ) = n ∑ i=1 log ( p1 θα1 Γ(α1) xα1−1 i e−θxi+ p2 θα2 Γ(α2) xα2−1 i e−θxi ) . ∂logL ∂α1 = 0 =⇒ n ∑ i=1 1 ( p1Γ(αθα1 1)x α1−1 i e−θxi+ p2Γ(αθα2 2)x α2−1 i e−θxi ) × p1e−θxi θα1 Γ(α1) (α1− 1)x (α1−2) i + x(α1−1) i Γ(α1)θα1)logθ− θα1 ∞ ∫ 0 e−xxα1−1logxdx [Γ(α1)]2 = 0. ∂logL ∂α2 = 0 =⇒ n ∑ i=1 1 ( p1Γ(αθα1 1)x α1−1 i e−θxi+ p2Γ(αθα2 2)x α2−1 i e−θxi ) × p2e−θxi θα2 Γ(α2) (α2− 1)x (α2−2) i + x(α2−1) i Γ(α2)θα2logθ− θα2 ∞ ∫ 0 e−xxα2−1logxdx [Γ(α2)]2 = 0. ∂logL ∂θ = 0 =⇒ n ∑ i=1 1 [ θ θ+βγ θα1 Γ(α1)x α1−1 i e−θxi+ βγ θ+βγ θα2 Γ(α2)x α2−1 i e−θxi ] ×x α1−1 i Γ(α1) [ (θ + βγ)[θα1+1e−θxi(−x i) + e−θxi(α1+ 1)θα1 ] − θα1+1e−θxi (θ + βγ)2 ] +x α2−1 i βγ Γ(α2) [ (θ + βγ)[θα2e−θxi(−x i) + e−θxi(α2)θα2−1 ] − θα2e−θxi (θ + βγ)2 ] = 0.
∂logL ∂β = 0 =⇒ n ∑ i=1 1 [ θ θ+βγ θα1 Γ(α1)x α1−1 i e−θxi+ βγ θ+βγ θα2 Γ(α2)x α2−1 i e−θxi ] × θγe−θxi (θ + βγ)2 [ θα2 Γ(α2) xα2−1 i − θα1 Γ(α1) xα1−1 i ] = 0. ∂logL ∂γ = 0 =⇒ n ∑ i=1 1 [ θ θ+βγ θα1 Γ(α1)x α1−1 i e−θxi+ βγ θ+βγ θα2 Γ(α2)x α2−1 i e−θxi ] × θβe−θxi (θ + βγ)2 [ θα2 Γ(α2) xα2−1 i − θα1 Γ(α1) xα1−1 i ] = 0.
Figure 3 – Plot of the fitted densities of the data.
Now on solving the above system of non-linear equations using mathematical software like MATHCAD, MATHEMATICA, MATHLAB etc, one can obtain the maximum likelihood estimators of parameters of ENGLD.
We consider the fitting of ENGLD to real life data sets by the method of moments and method of maximum likelihood and are presented in Table 1. The data set considered here is the survival times (in days) of 72 guinea pigs infected with virulent tubercle bacilli, observed and reported by Bjerkedal et al. (1960). The data are as follows:
0.1, 0.33, 0.44, 0.56, 0.59, 0.72, 0.74, 0.77, 0.92, 0.93, 0.96, 1, 1, 1.02, 1.05, 1.07, 1.07, 1.08, 1.08, 1.08, 1.09, 1.12, 1.13, 1.15, 1.16, 1.2, 1.21, 1.22, 1.22, 1.24, 1.3, 1.34, 1.36, 1.39, 1.44, 1.46, 1.53, 1.59, 1.6, 1.63, 1.63, 1.68, 1.71, 1.72, 1.76, 1.83, 1.95, 1.96, 1.97, 2.02, 2.13, 2.15, 2.16, 2.22, 2.3, 2.31, 2.4, 2.45, 2.51, 2.53, 2.54, 2.54, 2.78, 2.93, 3.27, 3.42, 3.47, 3.61, 4.02, 4.32, 4.58, 5.55.
From Table 1, it is obvious that the ENGLD is the best fitted model to the given data when compared with the existing models such as 1 LD, 2LD, GLD and NGLD for both methods of estimation, viz. methods of moments and methods of maximum likelihood. Figure 3, represents the graph of the fitted densities of the data.
54 D. S. Shibu and M. R. TABLE 1
Comparison of fit of ENGLD using different methods of estimation
Count Observed Expected frequency by method of moments Expected frequency by MLE
1 LD 2 LD GLD NGLD ENGLD 1 LD 2 LD GLD NGLD ENGLD 0-0.5 3 15 16 20 4 4 10 8 10 4 4 0.5-1 10 13 14 15 13 12 12 12 15 13 12 1-1.5 23 11 12 11 16 17 14 15 14 18 19 1.5-2 13 9 9 8 14 14 9 9 8 10 11 2-2.5 9 7 7 6 10 9 7 7 7 10 8 2.5-3 6 5 5 4 6 7 9 9 9 9 7 3-4 4 6 5 4 6 6 5 6 4 4 6 4-5 3 3 2 2 2 2 4 5 3 3 4 5-∞ 1 3 2 2 1 1 2 1 2 1 1 Total 72 72 72 72 72 72 72 72 72 72 72 df 4 3 2 2 1 4 3 2 2 1
Estimated values of parameters θ=0.868ˆ α=1.3ˆ α=0.9ˆ α=3.62ˆ αˆ1=3.8 θ=0.90ˆ α=1.5ˆ α=0.86ˆ α=3.60ˆ αˆ1=3.78
ˆ θ=1 γ=0.9ˆ β=2.8ˆ αˆ2=2.5 θ=0.95ˆ γ=0.91ˆ β=2.74ˆ αˆ2=2.61 ˆ θ=1 θ=1.86ˆ β=1ˆ θ=0.90ˆ θ=1.88ˆ β=1ˆ ˆ γ=1 γ=1ˆ ˆ θ=1.86 θ=1.75ˆ χ2 27.27 24.45 34.17 4.29 3.01 13.64 11.40 16.35 3.87 2.15
Acknowledgements
The authors are highly thankful for some of the helpful comments of the referee.
References
S. K Ashour, M. A. Eltehiwy (2015). Exponentiated power Lindley distribu-tion. Journal of Advanced Research, 6: 895-905.
A. Asgharzadeh, H. S. Bakouch, S. Nadarajah, S. Sharafi (2016). A new weighted Lindley distribution. Brazilian Journal of Probability and Statistics,
30: 1-27.
H. S. Bakouch, B. M. Al-Zahrani, A. A. Al-Shomrani, V. A. A. Marchi, F. Louzada (2012). An extended Lindley distribution. Journal of the Korean Statistical Society, 41: 75-85.
D. Bhati, M. A. Malik (2015). Lindley-exponential distribution: properties and applications. Metron, 73: 335-357.
T. Bjerkedal (1960). Acquisition of resistance in guinea pigs infected with differ-ent doses of viruldiffer-ent tubercle bacilli. American Journal of Hygiene, 72: 130-148. C. E. Bonferroni (1930): Elementi di statistica generale. Libreria Seber,
Firenze.
E. G. Deniz, E. C. Ojeda (2011). The discrete Lindley distribution properties and applications. Journal of Statistical Computation and Simulation, 81: 1405-1416.
I. Elbatal, F. Merovci, M. Elgarhy (2013). A new generalized Lindley dis-tribution. Mathematical Theory and Modeling, 3: 30-47.
M. E. Ghitany, B. Atieh, S. Nadarajah (2008). Lindley distribution and its applications. Mathematics and Computers in Simulation, 78: 493-506.
M. E. Ghitany, D. K. Al-Mutairi, F. A. Al-Awadhi, M. M. Al-Burais (2012). Marshall-Olkin extended Lindley distribution and its application. Inter-national Journal of Applied Mathematics, 25: 709-721.
M. K. Hassan (2014). On the convolution of Lindley distribution. Columbia International Publishing: Contemporary Mathematics and Statistics, 2: 47-54. G. O. Kadilar, S. Cakmakyapan (2016). The Lindley family of distributions:
properties and applications. Hacettepe University Bulletin of Natural Sciences and Engineering Series B: Mathematics and Statistics.
D. V. Lindley (1958). Fiducial distributions and Baye’s theorem. Journal of the Royal Statistical Society, Series B, 20: 102-107.
G. W. Liyanage, M. Pararai (2014). A generalized power Lindley distribution with applications. Asian Journal of Mathematics and Applications, 1-23.
J. Mazucheli, J. A. Achcar (2011). The Lindley distribution applied to com-peting risks lifetime data. Computer Methods and Programs in Biomedicine,
104: 188-192.
F. Metiri, H. Zeghdoudi, M. R. Remita (2016). On Bayes estimates of Lindley distribution under linux loss function: informative and non informative priors. Global journal of Putre and Applied Mathematics, 12: 391-400.
S. Nedjar, H. Zeghdoudi (2016). On gamma Lindley distribution: properties and simulations. Journal of Computational and Applied Mathematics, 298: 167-174.
P. Puig (2003). Characterizing additively closed discrete models by a property of their MLEs, with an application to generalized Hermite distributions. Journal of American Statistical Association, 98: 687-692.
A. R´enyi (1961). On measures of entropy and information. Proceedings of the Fourth Berkeley Symposium on Mathemtical Statistics and Probability, 1: 547-561.
R. Shanker, S. Sharma, R. Shanker (2013). A two-parameter Lindley distri-bution for modeling waiting and survival times data . Applied Mathematics, 4: 363-368.
R. Shanker, H. Fesshaye, S. Sharma (2016). On quasi Lindley distribution and its application to model lifetime data . International Journal of Statistical Distributions and Applications, 2: 1-7.
H. Zakerzadeh, A. Dolati (2009). Generalized Lindley distribution. Journal of Mathematical Extension, 3: 13-25.
M. Zenga (2007). Inequality curve and inequality index based on the ratios be-tween lower and upper arithmetic means. Statistica and Applicazioni, 4: 3-27.
Summary
In this paper, we consider an extended version of new generalized Lindley distribution (NGLD). We refer to this new generalization as the extended new generalized Lindley distribution (ENGLD). A comprehensive account of the mathematical properties of the new distribution including estimation is presented. A real life data set is considered here to illustrate the relevance of the new model and compared it with other forms of Lindley models using method of moment estimation and method of maximum likelihood estimation.
Keywords: Lindley distribution; Maximum likelihood estimator; Inequality measures;