Università Politecnica delle Marche
Scuola di Dottorato di Ricerca in Scienze dell’Ingegneria
Corso di Dottorato in Ingegneria Industriale
Technology Evolution of Natural Gas systems from
Renewable Energy Sources: CNG and LNG
Evoluzione dei Sistemi Energetici per il Gas Naturale da
Fonte Rinnovabile: CNG e LNG
Ph.D. Dissertation of:
Marco Spitoni
Supervisor:
Prof. Comodi Gabriele
Co – Supervisor
Prof. Alessia Arteconi
Co – Supervisor:
Prof. Carlo Maria Bartolini
Ph.D. Course coordinator:
Prof. F. Mandorli
1
ABSTRACT
At present, there is an increasing focus on environmental issues and air pollution. Emissions
are mainly related to electricity and heat generation sector, accounting for about 42% of total
emissions. With about 24% of total CO
2emissions from fuel combustion, transport sector
represents a major item in air pollution. The emission trend for this sector is constantly
increasing. Provisions declare an increase of 50% by 2030 and 80% by 2050. In order to
reduce this trend and meet the target for the Green House Gas (GHG) emissions, international
institutions and national governments have established several regulation policies. Such
policies are varying from a region to another, but the common adopted scheme is based on the
mechanism of incentive / penalty. For the transport sector, such policies are focused on the
biofuels production and utilization. Historically, the most common used biofuels were
bioethanol and biodiesel. During the years, several incentive schemes caused some issues
associated with the production of these biofuels, such as the rise of food prices, the intensive
land utilization and so on. Thus, other regulations are ongoing in order to produce biofuels in
a more sustainable way. On the other hand, biogas production encountered a weak
development if compared to that of those biofuels. However, it is growing quickly and at
present several countries are adopting specific incentives for this biofuel. This is also because
of the biogas potential to be used as vehicle fuel. In fact, after been purified, it is almost pure
methane, which is a clean source of energy. In Italy, a specific incentive scheme designed for
biomethane exists. If the produced biomethane is used for the transport sector, the incentive
is higher and biomethane becomes really interesting, since it can be used as Compressed or
Liquefied Biogas (CBG – LBG). However, at present, the base incentive is still not available
and some estimation were proposed to evaluate its minimum value.
In the first Chapter, a brief introduction regarding the environmental issues associated with
the GHG emissions is presented. Emissions are divided on the base of producing region and
sector. Biofuels policies are shortly presented as well as the role of natural gas and biogas.
In the second Chapter, a review over the governmental policies adopted worldwide is
presented. Critical aspects and provisions are also discussed. The biogas fuel is analyzed as
well as biomethane. Their potential as vehicle fuels and achievable production is presented
for the European region and the Chinese regions. Considering the Italian incentive scheme, a
feasibility analysis for the LBG production is also carried out. The main objective was to
evaluate the minimum incentive in order to make the LBG production economically possible.
Some cases were analyzed to explore its potentiality. Depending on the biomass composition
and business model, the minimum value of the base incentive was estimated to vary from 0.10
€ Sm
3to 0.42 € Sm
3.
In the third Chapter, the Compressed Natural Gas (CNG) refueling technology is presented
and investigated. The possibility of combining biogas plant production and upgrading with
CNG refueling stations allows the production of the Compressed BioGas (CBG). In order to
evaluate the potential of an alternative refueling station, a comparison was proposed with a
traditional buffer station. Results show that the alternative station presents lower required
2
power and a higher compression efficiency. On the other hand, the overall performances of
the station are too low and a further detailed sizing of the station would be required.
In the fourth Chapter, the Liquefied Natural Gas (LBG) technology is briefly presented.
Considering the biogas fuel, the possibility to achieve Liquefied BioGas (LBG) is
investigated. Taking into account the state-of-the-art technology for the LBG production, a
particular cryogenic separation technology is proposed to achieve carbon dioxide removal and
LBG production. The process presented a specific energy consumption ranging from 1.284
kWh kg
-1to 1.982 kWh kg
-1. A further optimization of the plant to investigate the carbon
dioxide liquefaction to be sold as by-products was also conducted. Results show a specific
energy consumption of 1.093 kWh kg
-1. Finally, the possibility to achieve carbon dioxide and
hydrogen sulfide was investigated. The ternary mixture was analyzed to find operative
parameters of the plant. A final specific energy consumption of 1.526 kW kg
-1was found.
However, in this case, carbon dioxide cannot be recovered because of the hydrogen sulfide.
In the last Chapter, conclusions of the thesis are reported, with potential future works.
4
List of Figures
Figure 1.1. GHG emissions trend over the last 150 years (IEA, 2017)
Figure 1.2. Combustion fuel share in GHG emissions and energy supply (IEA, 2017) Figure 1.3. GHG emissions share per region (IEA, 2017)
Figure 1.4. GHG emissions share per sector (IEA, 2017)
Figure 1.5. Biofuels production over the last 40 years; comparison between ethanol and biodiesel profiles (Sorda, 2010)
Figure 2.1. Yearly biofuel production per region
Figure 2.2. Food price index trend over the last 25 years (Araujo, 2017)
Figure 2.3. China weight-based passenger vehicle fuel consumption limits (Phases I, II and III) for automatic transmission (AT) and manual transmission (MT) vehicles (ICET, 2014).
Figure 2.4. Schematic processes involved in biogas production. Figure 2.5. Schematic view of the covered lagoon system Figure 2.6. Schematic view of the agricultural biogas plant
Figure 2.7. European biogas plants distribution by country. Germany has 9000 plants, not represented (Source: Stambasky, 2015)
Figure 2.8. Considered business models.
Figure 2.9. Schematic of the liquefaction cycle (Arteconi et al., 2015).
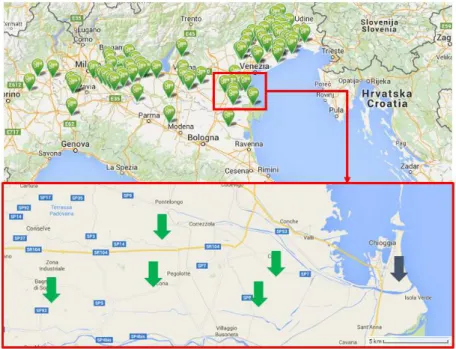
Figure 2.10. Partial map of the existing biogas plants in Italy and the related map of the 3rd business model.
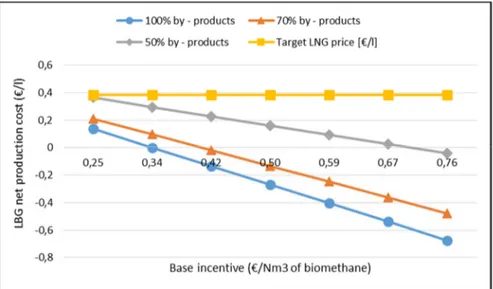
Green arrows stand for the existing biogas plant considered, blue arrow indicates the LBG facility location. Figure 2.11. Net LBG production cost by varying the base incentive for third scenario, when revenues from incentives are accounted for.
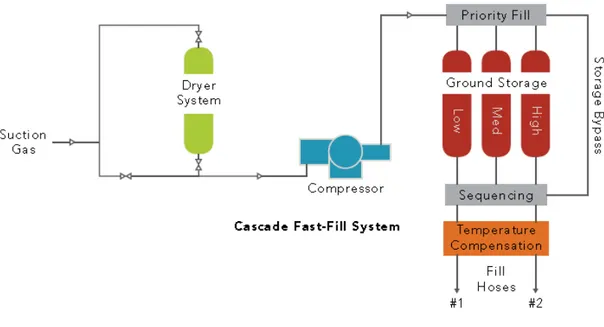
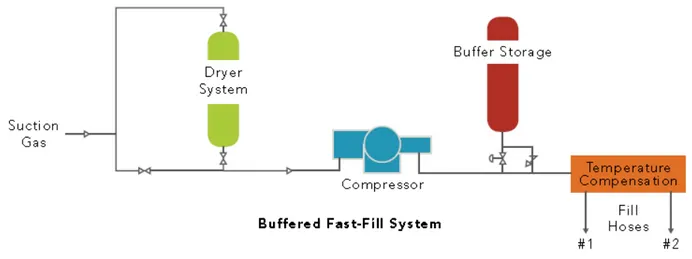
Figure 3.1. Schematic view of the Cascage Fas-Filling CNG station Figure 3.2. Schematic view of the Buffer Fast -Filling CNG station Figure 3.3. Schematic view of the Time-Filling CNG station Figure 3.4. Schematic view of an L-CNG refueling station
Schematic view of the mobile ‘Mother-Daughter’ process (Source: Mobile Fuel & Fuelling System Safety, Gijsbrecht van Schoonhoven, at Clean Fuels Consulting Critical Issues Workshop, CNG & LNG SAFETY: Perception & Reality, Brussels, October 2014.)
Figure 3.6. Schematic representation of the alternative CNG refueling station (S.TRA.TE.G.I.E. s.r.l. patent)
Figure 3.7. Detailed view of the alternative CNG station
Figure 3.8. Schematic view of the compressor cylinder and its cinematic governed by the crankshaft (Habing, 2005)
Figure 3.9. Thermodynamic ideal cycle for the single stage compressor Figure 3.10. Compression stages and associated valve displacement Figure 3.11. Analysis of the piston and crankshaft cinematics
Figure 3.12. Schematic view of a multistage intercooled reciprocating compressor
Figure 3.13. Comparison between the compression process of the single and multistage compressor Figure 3.14. Schematic view of the plate valve movement
Figure 3.15. Schematic view of the plate valve model and flowing gas
Figure 3.16. α-semiempirical coefficient as a function of the relative valve displacement Figure 3.17. Balance of the forces and pressures acting on the valve (Habing, 2005) Figure 3.18. Pressure vs Temperature diagram of the compression phase
Figure 3.20. Schematic view of the storage and onboard cylinder system during the FFP. Figure 3.21. FFP process analysis and modeling
5
Figure 3.23. Comparison between models [bar] Figure 3.24. Comparison between models [kg]
Figure 3.25. Schematic view of the cold-water box providing storage refrigeration Figure 3.26. Algorithm definition and implementation on MathWorks®. Matlab software Figure 3.27. Pressure profile inside of the three storages of the alternative CBG refueling station Figure 3.28. Pressure profile inside of the storage of the buffer CBG refueling station
Figure 3.29. Figure 3.29. Temperature vs Mass Flow Rate in onboard cylinder during FFP in alternative station
Figure 3.30. Pressure vs Mass Flow Rate in onboard cylinder during FFP in alternative station Figure 3.31. Filled Mass vs Pressure in onboard cylinder during FFP in alternative station Figure 3.32. Temp. vs Mass Flow Rate in onboard cylinder for the buffer CBG
Figure 3.33. Press. vs Mass Flow Rate in onboard cylinder for the buffer CBG Figure 3.34. Filled Mass vs Mass Flow Rate in onboard cylinder for the buffer CBG Figure 3.35. Pressure comparison between CBG systems
Figure 3.36 Mass Flow Rate comparison between CBG systems
Figure 3.37. Comparison between the relative pressure levels inside the alternative station and the buffer station.
Figure 4.1. Generic cooling curve for NG refrigeration and liquefaction Figure 4.2. Schematic view of the C3MR system
Figure 4.3. Schematic view of the ConocoPhillips system Figure 4.4. Schematic view of the MFCP
Figure 4.5. Schematic view of the Shell DMR Process Figure 4.6. Schematic view of the Scandinavian GtS system Figure 4.7. Schematic view of the Terracastus system
Figure 4.8. Closed cycle, nitrogen Brayton/Joule reverse cycle Figure 4.9. Open cycle, Claude cycle
Figure 4.10. Schematic view of the Linde cycle Figure 4.11. CO2 solubility in LNG diagram
Figure 4.12. Phase diagram of CH4 – CO2 binary system
Figure 4.13. Schematic view of the proposed plant.
Figure 4.14. Schematic view of the triple pressure Linde cycle (Arteconi et al., 2015).
Figure 4.15. Specific cost comparison between the traditional upgrading plus liquefaction process and PLNG technology.
Table 4.1. Energy performance of the proposed liquefaction plants.
Figure 4.16. Influence of final CO2 concentration on the specific energy consumption.
Figure 4.17. Schematic view of the cryogenic separation plant Figure 4.18. CO2 phase diagram
Figure 4.19. Schematic view of the L-CO2 and cold recovery unit
Figure 4.20a. Detail of the L-CO2 recovery
Figure 4.20b. Simulation scheme of recovery process
Figure 4.21. Schematic view of the triple expansion Linde cycle
Figure 4.22. Comparison between technologies in a specific energy consumption point of view Figure 4.23. Yearly revenue and costs associated with the various technologies
Figure 4.24. Parallel coordinates chart. Each grey line represents a considered plant configuration. Figure 4.25. Pearson correlation coefficient analysis.
Figure 4.26. Chart of the factor analysis. The higher the absolute effect associated with the variable, the higher its effect on the objective function.
Figure 4.27. Specific consumption vs Operative pressure as function of the inlet biogas composition Figure 4.28. LBG and L-CO2 mass flow produced as function of the inlet biogas composition
6
Figure 4.29. Hourly cost and revenue as a function of the inlet biogas composition Figure 4.30. P vs T for CH4-CO2 and CH4-H2S binary systems
Figure 4.31. Schematic view of the cryogenic separation process for the CO2 and H2S compounds
Figure 4.32. Specific energy consumption comparison
8
List of Tables
Table 1.1. GHG potential for CO2, CH4 and N2O compounds (IPCC, 2013).
Table 1.2. GHG emissions of the ten larger emitters, during 1990, 2005, 2015, and further furcated emissions in 2020
Table 2.1. Biofuels production per region over the last 7 years (BP Statistical Review, 2017) Table 2.2. Biofuel properties and requirements (Araujo, 2017)
Table 2.3. Feedstock properties and requirements (Araujo, 2017) Table 2.4. Biofuels thermos-physical characteristics (Araujo, 2017)
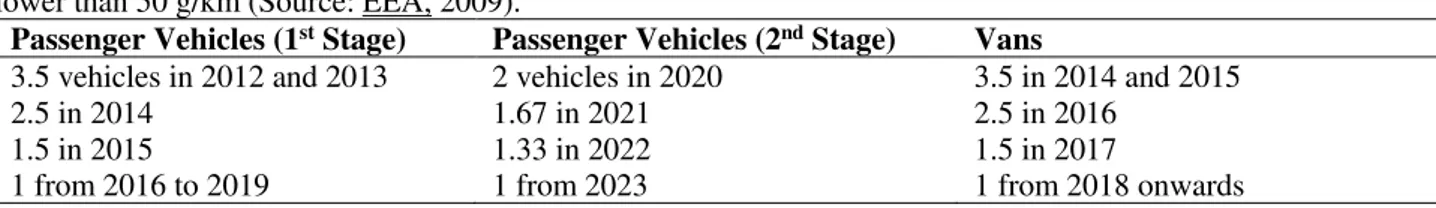
Table 2.5. Incentive for those manufacturers able to produce passenger vehicles or vans with an emission level lower than 50 g/km (Source: EEA, 2009).
Table 2.6. NGVs situation in the main European countries (NGVA, 2014a).
Table 2.7. Natural Gas stations situation in the main European countries (NGVA, 2014a).
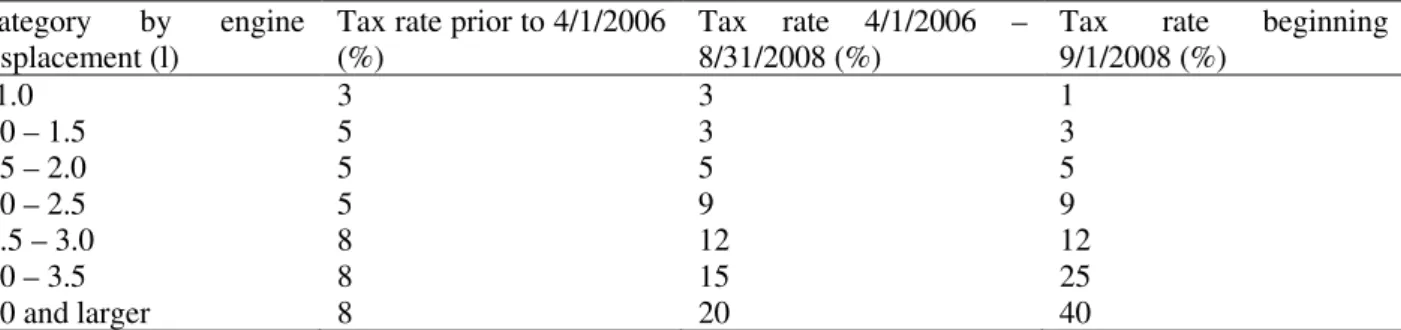
Table 2.8. Tax rate over the years depending on the engine displacement (United Nations Environment Programme, 2015).
Table 2.9. Natural gas vehicles market comparison between different countries (Source: Li Y., 2015). Table 2.10. CNG vehicles and refuelling stations in China over the years (Source: Li Y., 2015). Table 2.11. LNG vehicles and refuelling stations in China over the years (Source: Li Y., 2015). Table 2.12. Biomass feedstock and biomethane potential in Europe (Source: Stambasky, 2015) Table 2.13. Biomass feedstock and biogas potential in China (Source: Bischoff, 2014)
Table 2.14. (Jaffrin et al. 2003; Persson et al. 2006)
Table 2.15. Performances of the described desulphurization technologies Table 2.16. Performances of the described upgrading processes
Table 2.17. Energy performance of the liquefaction cycle.
Table 2.18. Summary of the Italian incentives scheme for biomethane from digesters. Table 2.19. Biogas and biomethane specific production costs
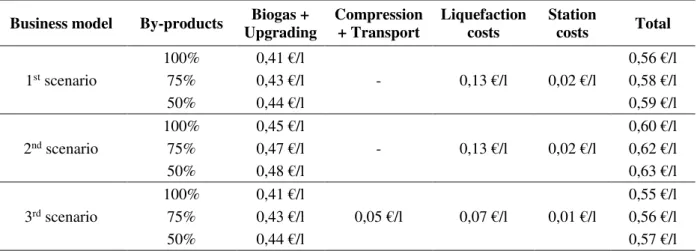
Table 2.20. Specific costs for each phase of every considered scenario, referred to the LBG produced. Table 2.21. Minimum identified incentives for each business model. Base values (CIC) and total incentive accounting for the multipliers of the specific case.
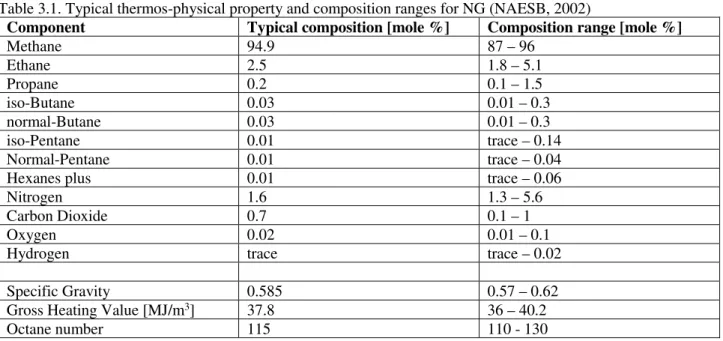
Table 3.1. Typical thermos-physical property and composition ranges for NG (NAESB, 2002) Table 3.2. Results of the present model compared with experimental results
Table 3.3. Initial characteristic parameters for the compressor sizing (FORNOVOGAS®) Table 3.4. Results of the sizing algorithm for each compressor stage
Table 3.5. CBG station information for the FFP
Table 3.6. Onboard cylinder geometric and material properties Table 3.7. Storage geometric parameters and specifications
Table 3.8. Results of the comparative analysis between proposed CBG configurations Table 3.9. Pressure inside of the alternative station storages at the end of the FFP Table 4.2. DOE matrix definition parameters and algorithms
Table 4.3. Input parameter of the cryogenic cycle Table 4.4. Considered constraints
Table 4.5. Optimization procedure and results Table 4.6. Optimum input variable set
Table 4.7. Comparison with traditional technologies
Table 4.8. Input variable ranges from parallel coordinates chart analysis.
Table 4.9. Effects of factors on the specific energy consumption. Factors are intended to be variables and their combinations.
9
Table 4.11. Typical composition of biogas from AD, landfills and NG Table 4.12. Results of the simulation
11
Contents
ABSTRACT ... 1
List of Figures ... 4
List of Tables ... 8
1. INTRODUCTION ... 16
1.1. The Environmental Background ... 16
1.2. Emissions by sector ... 18
1.3. The Waste Management ... 19
1.4. Biofuels Policies Introduction ... 20
1.5. Natural Gas and Biogas Considerations... 21
1.6. Structure of the Thesis ... 22
1.7. References ... 24
2. BIOFUELS AND BIOGAS OVERVIEW – AN ITALIAN CASE STUDY ... 27
2.1. The Biofuels Market Evolution ... 27
2.2. Biofuels Critical Aspects ... 31
2.3. Governmental Policies ... 33
2.3.2. The United States ... 34
2.3.3. Argentina ... 35
2.3.4. Brazil ... 35
2.3.5. Brazil biofuels annual 2017 (reference) ... 36
2.3.6. Colombia ... 36
2.3.7. The European Union ... 36
2.3.8. China ... 37 2.3.9. India ... 37 2.3.10. Indonesia ... 38 2.3.11. Malaysia ... 38 2.3.12. Thailand ... 38 2.3.13. Australia ... 39
2.4. European and Chinese Situation in Transport Sector ... 39
2.4.1. The European situation ... 39
2.4.2. The Chinese situation ... 42
2.5. Biogas and Biomethane ... 45
2.5.1. Introduction to Biogas ... 45
2.5.1.1. Covered lagoon biogas systems ... 46
12
2.5.1.3. Industrial biogas plants ... 48
2.5.1.4. Sludge treatment plants ... 49
2.5.1.5. Solid waste – dry fermentation ... 49
2.5.1.6. Environmental Impacts of Anaerobic Digestion ... 49
2.5.2. Biogas Potential in European and Chinese Context ... 50
2.5.2.1. European situation ... 50
2.5.2.2. Chinese situation ... 51
2.6. Biomethane from Biogas Methane Enrichment ... 51
2.6.1. H2O removal process ... 53
2.6.2 H2S removal processes ... 53
2.6.2.1. In-Situ Precipitation Process ... 53
2.6.2.2. Adsorption Process ... 53
2.6.2.3. Absorption Process ... 53
2.6.2.4. Membrane Separation Process ... 54
2.6.3. CO2 Removal Processes ... 54
2.6.3.1. Water Scrubbing Process ... 54
2.6.3.2. Organic Solvent Scrubbing Process ... 54
2.6.3.3. Chemical Scrubbing Process ... 55
2.6.3.4. Pressure Swing Adsorption Process ... 55
2.6.3.5. Membrane Separation Process ... 55
2.6.3.6. Cryogenic upgrading ... 55
2.7. LBG Feasibility: an Italian Case Study ... 56
2.7.1. Biomethane compression and transportation ... 57
2.7.2. LBG production ... 57
2.7.3. Refuelling ... 58
2.7.4. Results ... 59
2.8. Conclusions ... 61
2.9. References ... 62
3. COMPRESSED NATURAL GAS (CNG) REFUELING TECHNOLOGY ... 69
3.1 Introduction ... 69
3.2. Conventional CNG Stations ... 70
3.2.1. Cascade Fast-Filling Configuration... 70
3.2.2. Buffer Fast-Filling Configuration ... 71
3.2.3. Time-Filling configuration ... 72
3.2.4. L-CNG Stations ... 72
13
3.3. Alternative CNG: S.TRA.TE.G.I.E. s.r.l. Patent ... 74
3.4. The CNG Alternative Station Simulation Model ... 76
3.4.1. Multistage Reciprocating Compressor ... 77
3.4.2. The Fast-Filling Process and Connecting Pipes ... 90
3.4.2.1. The FFP model ... 90
3.4.2.2. The Connecting Pipe ... 92
3.4.3. The Storage Cooling Process ... 95
3.4.4. The Algorithm Definition ... 97
3.5. Results and Discussion ... 99
3.6. Conclusions ... 107
3.7. References ... 107
4. LIQUEFIED NATURAL GAS AND BIOGAS ... 110
4.1 Introduction ... 110
4.2. LNG and LBG technologies ... 110
4.2.1. Propane Pre-Cooled Mixed Refrigerant Process (C3MR) ... 111
4.2.2. ConocoPhillips Optimized Cascade® ... 112
4.2.3. Statoil / Linde Mixed Fluid Cascade Process (MFCP) ... 112
4.2.4. Shell DMR Process ... 113
4.2.5. Scandinavian GtS ... 113
4.2.6. Acrion Technologies / Terracastus Technologies ... 114
4.2.7. Prometheus – Energy ... 115
4.2.8. Nitrogen / Bryton-Joule cycle (closed cycle) ... 115
4.2.9. Claude Cycle (open cycle) ... 115
4.2.10. Linde cycle (open cycle) ... 116
4.3. The Cryogenic Separation Technology – CO2 removal ... 117
4.3.1. Thermodynamic Bases ... 117
4.3.2. The Cryogenic Process ... 118
4.3.3. Results and Discussion ... 120
4.3.4. Conclusions ... 121
4.4. The Cryogenic Separation Optimization – CO2 removal ... 122
4.4.1. The Liquefaction Process ... 122
4.4.2. The Optimization Process ... 125
4.4.3. Results and Discussion ... 127
4.4.4. Variables correlation analysis ... 130
4.4.5. Sensitivity analysis ... 132
14
4.5. The Cryogenic Separation Technology – CO2 and H2S removal ... 135
4.5.1. Thermodynamic Considerations ... 135
4.5.2. The CH4 – CO2 and CH4 – H2S Binary Systems ... 135
4.5.3 Results and Discussion ... 137
4.5.4. Conclusions ... 138
4.6. Final Conclusions ... 138
4.7. References ... 139
16
1. INTRODUCTION
In this thesis, a brief introduction regarding climate changes and global warming issues related with air pollution due to human activities is presented. Pollutant emissions will be divided into main sectors. Major item of the thesis is on the reduction in emissions related with the transport sector, in particular road transport sector. This is essentially linked with light-duty and heavy-duty vehicles utilization. One of the hottest key point regarding transportation is to achieve CO2 emissions reduction during fuel combustion with engine efficiencies and autonomy
as high as for traditional fuels. In this work, Natural Gas (NG) was selected as the best vehicle fuel that can better substitute oil and diesel in the short-medium term. In particular, biogas and biomethane potential in transport sector is considered and investigated. To reduce GHG emissions from the transport sector, many aspects must be considered. Therefore, biofuels have to be cleaner than fossil fuels. However, technologies and plants necessary to produce such biofuels must be competitive. High energy efficiency, low operative costs as well as low environmental impact of processes involved in biofuels production and utilization are mandatory targets. Related technologies are presented in order to better understand how this renewable source can be used as a feedstock for NG vehicles. Therefore, Compressed Natural Gas (CNG) and Liquefied Natural Gas (LNG) technologies are also investigated. Related state of the art is presented for both of them. Conventional CNG and LNG technologies are investigated considering biogas instead of NG. In order to better understand energy efficiency potential in standard CNG refueling stations, a novel patented scheme is presented and discussed in detailed. Since the refueling process suffers for vehicle vessels temperature increase and high compression power installed, those are considered as key factor in the present analysis. Vehicle refueling time was considered as a critical parameter too, able to drive final user’s opinion toward NG vehicles. The stations were completely modeled by means of a quasi-steady analysis, thus final performance comparisons were possible. Regarding LNG using biogas, the main issues to overcome are those related with biogas cleaning procedure and specific energy consumption during liquefaction. At present several technologies are able to efficiently purify biogas. However, further purification would be necessary in order to liquefy it. Moreover, liquefaction technology is well known to be high energy intensive process, only feasible for the medium-large scale. By the way, in order to allow biogas diffusion and utilization as vehicle fuel, LNG techniques development is a critical aspect. In this thesis, cryogenic separation process is proposed as a possible solution. Two different plants are presented, investigated and finally compared with standard processes for LBG production.
1.1. The Environmental Background
At present, more than 7 billion of human being are living on earth while about 200 years ago this number was less than one billion. From 1900 to 2000 human population had grown from 1.5 to 6.1 billion, also due to the increased average in life expectancy. Moreover, in recent years, highly densely populated countries, such as India and China, have been growing considerably, thus increasing their energy and resources requirements (Roser et al., 2017). As a consequence, in the last decades, interests related with energy consumption, energy efficiency and environmental issues have become more and more important. One of the major items in the scientific research is to maximize energy efficiency, reducing resources waste. To the purpose of containing global warming and prevent environmental disasters, managing with air pollution due to human activities is of paramount importance. Carbon Dioxide (CO2) concentration in the atmosphere is generally taken as the main indicator of air pollution level. Such
gas, as well as other gases, are known as Green House Gas (GHG), able to negatively influence global air temperature.
Table 1.1. GHG potential for CO2, CH4 and N2O compounds (IPCC, 2013).
Name of GHG Global Warming Potential estimates over last 100 years
Second Report Fourth Report Fifth Report
Carbon Dioxide (CO2) 1 1 1
Methane (CH4) 21 25 28
Nitrous Oxygen (N2O) 310 298 265
Atmosphere CO2 concentration level measured in 2016 was of 403 parts per million, almost 44% higher than those
estimated for the mid-1800s, with an increasing rate of 2 ppm per year, related with the last decade (IEA, 2017). By the way, human activities are also responsible for other GHG emissions than CO2, namely methane (CH4) and
nitrous oxygen (N2O). Those compounds are even more dangerous than simple CO2, as reported in Table 1.1. Other
17
kinds of compounds have a GHG potential ranging from 50 to 23500 times greater than CO2 (IPCC, 2013). Among
every sector responsible for the GHG production, the use of energy represents the largest source of emissions. Agriculture is mainly responsible for the production of CH4 and N2O, industrial sector not involved in energy production, is mainly responsible for fluorinated gases and N2O.
Figure 1.1. GHG emissions trend over the last 150 years (IEA, 2017)
Regarding the energy sector, CO2 due to fuel combustion are responsible for the total GHG emissions. Energy sector accounts for the largest share of global GHG emissions, representing about 58% of global emissions. This percentage is strictly related with worldwide economic growth and development. Global energy demand as measured by total primary energy supply increased by almost 150% between 1971 and 2015, still mainly relying on fossil fuels. Although the share in energy production by means of non-fossil sources had strongly grown (almost 30% from 1971 to 2015), the fossil fuel share in energy production on the same period is nearly the same. This is mainly related with the growth in energy demand during the last 150 years and especially from 1950. Figure 1.1 shows the consequences of energy demand as well as fossil fuels utilization.
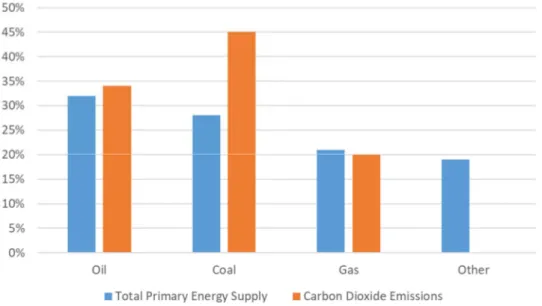
Figure 1.2. Combustion fuel share in GHG emissions and energy supply (IEA, 2017)
Coal accounts for 45% of the global CO2 emissions due to its heavy carbon content per unit of energy released. Comparing it to natural gas emissions, coal is almost twice as emission intensive. From the late 1980s until the early 2000s, coal and oil were each responsible for approximately 40% of global CO2 emissions, with emissions from oil
18
generally exceeding those from coal by a few percentage points. However, recent trends show that coal share has grown from 39% to 45% since 2002. On the other hand, oil share has decreased from 40% to 35%. In the same period, natural gas (NG) emission share was nearly unchanged at 20%. Figure 1.2 shows the 2015 situation in total primary energy supply and CO2 production by fuel type.
Figure 1.3. GHG emissions share per region (IEA, 2017)
Focusing on GHG emissions classified per geographic area, in 2015 non-Annex I countries were representing 58% of global CO2 emissions. Annex-I countries accounted for 38% while remaining 4% were related with international aviation and marine bunkers. With 28% of global share, China produced by far the greater part of GHG emissions. North America were responsible for 17% of CO2 emissions, Asian countries (excluding China) represented 14%,
while Europe and Economies in Transition part of Annex-I accounted for 15%. Finally, with an average share of about 4% of produced CO2, Middle East countries, Australia, South America, Africa and others accounted for almost
25% of global emissions. Figure 1.3 gives some insight about regional share. As it can be seen, Asia (including China) and North America accounted for more than 50% of global CO2 emissions. In 2015, those countries produced
something like 19 GtCO2.
1.2. Emissions by sector
In order to better understand how to manage with GHG emissions reduction, it is useful to divide them into specific application area. Pollutant emissions can be categorized in the following sectors:
• Electricity and heat production sector; • Transport sector;
• Industrial sector; • Residential sector; • Services sector; • Other sectors.
Other sector includes, but are not limited to, fishing and agriculture. Figure 1.4 shows the individual impact of each of those sectors.
19
Figure 1.4. GHG emissions share per sector (IEA, 2017)
As it can be seen, two sectors produced two-thirds of global CO2 emissions from fuel combustion in 2015, namely electricity and heat generation and transport sector. The former represents the largest one, with a share of 42%, while the latter is responsible for 24%. Although renewable energy sources utilization is constantly growing, still electricity and heat sector are strongly coal dependent (IEA, 2017). This is the case of countries such as China, India and South Africa. Nevertheless, the share of coal in electricity and heat production sector have considerably grown from 65% to 72% between 1990 and 2015. On the other hand, in recent years this trend changed in favor of NG utilization. This is mainly the case of electricity production in regions such as North America and Europe. In Europe, Italy and United Kingdom are strongly decreasing their share in electricity production by means of fossil fuels by 20% and 7% respectively, between 2000 and 2015. On the other hand, other regions are experiencing an opposite trend, especially in Australia and Japan. However, Japanese situation strongly depend on the Fukushima Daiichi accident, in 2011 (IEA, 2017). Generally, increased emissions due to electricity production means an increased output. This is the case of emerging economies grown in a very short time, such as China and India, in which the growth rate forces the massive use of fossil fuel as primary source, especially coal. By the way, in China, improvements in energy efficiency as well as renewable energy sources utilization have sensibly reduced produced emissions per output unit. Regarding emissions from transport sector, an important growth of about 68% was registered from 1990 to 2015. Road transport accounts for the greater part of those emissions, with an increasing share of almost 60% in 1990 to more than 75% in 2015. It is forecasted that energy use and GHG emissions in this sector will continue to increase by 50% by 2030 and more than 80% by 2050. The Intergovernmental Panel on Climate Change (IPCC) advices that global GHG emissions must be reduced by at least 50% by 2050 (IEA, 2009).
1.3. The Waste Management
As for energy efficiency and environmental impact reduction issues, waste management had gained more and more importance in scientific research. The strong growing population rate combined with economic development and resources utilization have been dramatically increasing waste generation. As a consequence, development of new technologies for waste management is strictly required. The Waste Framework Directive (2008/98/EC) defined priorities and best practices for the waste management, in order to minimize its associated environmental. Continuous efforts are spent to improve the framework by means of new laws. Considering waste production and the necessity of efficient waste management in a context of globally increasing energy demand, the Waste-to-Energy procedure seems to be the best solution. The process allows double advantages, by producing energy from waste sources. New technologies to achieve this kind of renewable energy production are constantly developing. Around 19 % of the global energy consumption in 2008 came from renewable energy resources (Demirel, 2012). This kind of energy is far cleaner than fossil fuels and moreover it is sustainable over long term, while the former are finite and more pollutant (Dincer, 1998). Climate changes and global warming issues can be reduced by means of fossil fuels replacement with renewable energies utilization (IPCC, 2012). For those reasons, many researchers as well as companies all over the world are focusing on renewable energies, energy and plants efficiency and in GHG emissions reduction.
20
1.4. Biofuels Policies Introduction
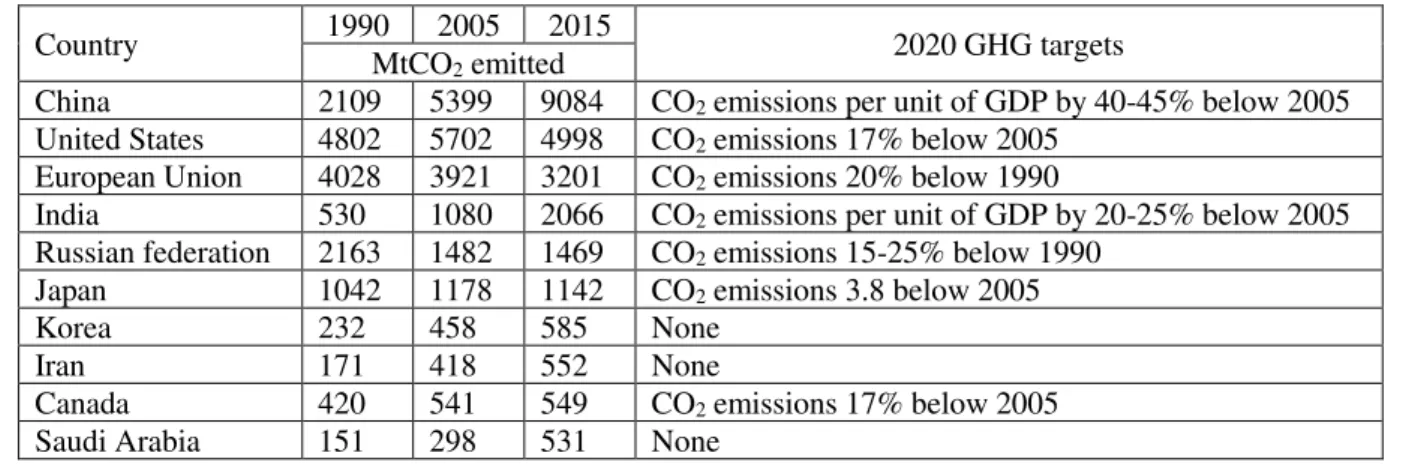
In 2015, the Paris Agreement extended environmental obligation in climate mitigation to every country. The Agreement became effective in 4 November 2016 and up to now 170 Parties have ratified of 197 Parties to the Convention. Since that date, rules and guidelines for emissions were established. The first target in GHG emissions reduction were set under the Kyoto Protocol’s first period (2008-12). The target required industrialized countries to achieve domestic emissions reduction of 5% relative to 1990 over this period. 38 Parties have also decided to take part to a second commitment period running from 2013 to 2020. Countries comply with their targets by reducing emissions from fossil fuel combustion, reducing emission in other sectors or through use of the flexible mechanisms consisting on earning emission credits by reducing emissions in developing countries and EIT. Kyoto Protocol has made CO2 a tradable commodity, and has been a key driver for the development of national emissions trading schemes. However, the smaller pool of countries with targets in the Kyoto Protocol’s second commitment period (only 80 by August 2017), coupled with a large surplus of project credits carried forward from the first period, have led to low prices and project developers exiting the market. Therefore, Kyoto Protocol seemed to be limited in its potential regarding GHG emissions. United States was not into Protocol’s jurisdiction while developing countries did not deal with emissions targets. The second commitment period targets imply action on less than 13% of global CO2 emissions in 2014. However, developed and developing countries submitted voluntary emission reduction target for 2020 under the Copenhagen Accord and Cancún Agreements. Participating Parties were responsible for over 80% of global emissions. Annex-I and non-Annex I countries established diverse targets regarding GHG emissions reduction. The former submitted absolute emissions reduction targets while the former submitted appropriate actions related with national policies. This is the case of China and India in which reduction targets are on a CO2/GDP basis. Table 1.2 reports information regarding the ten largest CO2 emitters.
Table 1.2. GHG emissions of the ten larger emitters, during 1990, 2005, 2015, and further furcated emissions in 2020
Country 1990 2005 2015 2020 GHG targets MtCO2 emitted
China 2109 5399 9084 CO2 emissions per unit of GDP by 40-45% below 2005
United States 4802 5702 4998 CO2 emissions 17% below 2005
European Union 4028 3921 3201 CO2 emissions 20% below 1990
India 530 1080 2066 CO2 emissions per unit of GDP by 20-25% below 2005
Russian federation 2163 1482 1469 CO2 emissions 15-25% below 1990
Japan 1042 1178 1142 CO2 emissions 3.8 below 2005
Korea 232 458 585 None Iran 171 418 552 None
Canada 420 541 549 CO2 emissions 17% below 2005
Saudi Arabia 151 298 531 None
As it can be seen, reduction targets based on CO2 emissions per unit of GDP do not reflect an effective overall CO2
emission reduction. Although the ambition of these pledges is insufficient to limit temperature rise to 2°C above pre-industrial levels, the breadth of participation in mitigation commitments marked a significant improvement on the coverage of the Kyoto Protocol, and laid the groundwork for the Paris Agreement. In order to reduce GHG emissions related with fuel combustions, biofuels represent a possible solution. However, production of such fuels is unprofitable, thus incentives are necessary to develop their feasibility. Such incentives regard tax exemptions, subsides as well as penalties (Rajagopal and Zilberman, 2007). Up to now, main motivation in biofuels production was related with agriculture and energy policies in order to substitute oil, reducing fossil fuels importations. In recent years, another driving force regards reduction in CO2 emissions level in the transport sector. Considering
biofuels policies, volumetric production targets for biofuels failed in containing costs, avoiding environmental damage or even to achieve GHG emission reductions. Policies related with carbon content for fuels, combined by certification, seems to be the best choice. Those schemes have been developed in several countries, such as California, the Netherlands, Germany, Switzerland, the United Kingdom and the European Commission. However, by promoting incentives in biofuel production, high selectivity should be required in eligible producers and processes. Although certification could be used to modify farming and biomass harvesting methods in order to limit the environmental impact, it cannot control any displacement of existing farming activities induced by an expansion of biofuel production. As a consequence, biofuel production will significantly influence land-use and food production and market. Thus, other measures are required to protect valued natural and semi-natural ecosystems. Moreover, another consequence of incomplete regulations and incentives tools affect biofuels performance in terms of GHG emissions reduction. Biofuels production have been growing considerably in the last 20 years. Ethanol and
21
biodiesel production increased from 16.9 to 72 and from 0.8 to 14.7 billion liters respectively between 2000 and 2009 (Figure 1.5). This is mainly due to governmental policies and incentives. It is the case of US in which financial incentives for biofuel producers allowed United States to become the largest ethanol producer in the world. Regarding European Union, policies consist in mandatory blending levels. During 2007, OECD members invested about 15 billion US dollars in incentive policies related to biofuels production (OECD, 2007; OECD/ITF, 2008). On the other hand, those policies present several socio-economic and environmental critical consequences. This is due to the fact that biofuels manufacturers are strongly using food crops as their feedstock, such as sugarcane and sugar-beet and so on (Larson, 2008). In 2006, 20% of the total US corn supply was reallocated to fuel ethanol production (EIA, 2007). As a consequence, a sensible increment in food prices was registered between 2003 and 2008 (Mitchell, 2008; UNCTAD, 2008; Schmidhuber, 2007; Johnson, 2007; Mercer-Blackmanetal., 2007). From 2008 to 2010, food-price index changed considerably (OECD/FAO, 2009). In January 2010 the indexes for cereal grains, oils, and sugar prices were, respectively, 70%, 69% and 276% higher than in the 2002–2004 period. Moreover, among the increasing rate in food prices, energy several studies assessed that LCA related with biofuels production have a negative net contribution in reducing GHG emissions (Macedo et al., 2004; Pimentel and Patzek, 2005; Farreletal., 2006; Crutzenetal., 2007). Although LCA studies may diverge on to each other (OECD, 2008), ethanol produced by means of corns showed the most negative LCA profile. Therefore, develop biofuels production and related incentives in order to cost-effectively reduce air pollution is challenging.
Figure 1.5. Biofuels production over the last 40 years; comparison between ethanol and biodiesel profiles (Sorda, 2010)
1.5. Natural Gas and Biogas Considerations
In order to reduce the environmental impact and GHG emissions some measures must be applied. Regarding transport sector the key point is to lower the carbon emissions during combustion. This could be achieved by introducing more efficient engines or other kind of new cars (such as electrical or hybrid vehicles) or introducing new fuels, to make the combustion cleaner. In this context, alternative fuels have assumed more and more importance and natural gas (NG) is considered the alternative fuel that, in the short-medium term, can best substitute conventional fuels (EC, 2001a), because it is readily available at a competitive price and it employs technologies already in widespread use (Hekkert et al. 2005). Yeh states that NG advantages over traditional fuels are as follows (Yeh, 2007): (i) environmental benefits, (ii) availability (iii) reduced dependency on imported oil. Regarding the utilization as vehicle fuel, NG vehicle autonomy must be comparable to that of standard vehicles. CNG is the compressed form of NG. One or more pressurized vessels allow enough stored energy density with an acceptable weight for light-duty vehicles. On the other hand, this possibility is not possible for heavy-duty vehicles. This is mainly due to the fact that the total weight to allow the required autonomy will be too high. For this reason, LNG
22
is generally used for light-duty vehicles being roughly 3 times denser than CNG. By the way, a cryogenic vessel is required onboard. Since cryogenic temperatures not higher than 160 K are mandatory to maintain acceptable pressure levels inside of the vessel, this fuel cannot be used in light-duty sector, in which vehicles could remain unused for a long time. Thus, compared to CNG, LNG represents the best substitute of diesel in transport sector. On the other hand, LNG requires energy intensive processes in order to be produced, increasing its global environmental impact over CNG. A comparison among the well-to-wheel life cycle GHG emissions for CNG, LNG and diesel has been made (Arteconi et al., 2010a; Arteconi et al., 2010b). It shows that, compared with Diesel, CNG reduces GHG emissions by 14% and LNG by 3% to 10%, depending on supply option. Although CNG vehicles refueling is a widely available and mature technology, several issues regarding traditional refueling stations remains. It is the case of temperature rising during vessel charge and high power required for the gas compression. Heavy-duty vehicles can be refueled at LNG refueling stations, LNG is stored in cryogenics tanks on board and finally burnt in LNG-adapted engines. The technology related with LNG refueling is already available. However, in order to achieve a wide LNG diffusion as vehicle fuel, the main obstacle to overcame is the problem of supply (Arteconi et al., 2012). In countries like Italy this is a critical aspect because it is not possible to purchase it at the regasification terminals and the liquefaction on site using pipeline natural gas is very challenging. In this context, the biomethane production from biogas of landfills and anaerobic digesters could play a significant role. It represents an alternative and renewable source of feedstock gas with several advantages: (i) the CO2 emissions during its combustion are the
same captured during biomass growth, (ii) it can reduce the dependency in natural gas and oil importations and (iii) it can be injected into the national gas grid. Biogas is a renewable energy source, which is considered carbon-neutral since the organic waste has photosynthesized carbon dioxide (Masse, et al., 2012). Produced by means of Anaerobic Digesters (AD) or in landfills, it presents methane concentrations up to 70% in volume. Remaining part of the gas is mainly composed by CO2 (ranging from 30% to 50% in volume), H2S (generally not higher than 4000 ppm) and
water vapor (from 1% to 2% in volume). In AD, microorganisms digest organic substrates, producing biogas. Final biogas composition is related with biomass type. Biomass used in AD process are crops, manure, industrial wastes, sewage sludge and organic fraction of municipal solid wastes. Due to its raw composition, biogas cannot be directly used as vehicle fuel, thus a purification process is mandatory. Purification process consists of several passages and plants able to remove one or more than one compound at a time, saving as much methane as possible, preventing losses. Purification processes will be discussed later in chapter 4. At the end of compound removal process, obtained gas is no longer raw biogas but highly pure methane, called biomethane. Depending on purification technology, biomethane has a methane content ranging from 95% to more than 99.5% in volume. Production of biogas from organic waste has shown to be more environmentally friendly compared to other waste handling options such as landfilling, incineration and composting (Lin, et al., 2012). Biogas production can therefore be considered a favorable treatment for organic waste. Commercial biogas production has increased for at least two reasons. Firstly, biogas can be used as both vehicle fuel or in energy production. Secondly, it contributes to a lower GHG concentration when it is collected in a closed process (Santos, et al., 2013). Moreover, considering Table 1.1, by capturing methane produced during anaerobic digestion of biomass substrates, important air pollution is avoided (Butz, 2014). After H2S and water removal, biogas could be directly used as combustion fuel in order to produce
heat and electricity. By the way, from environmental impact perspective, it is recommended to enriched biogas methane content to a fuel (López, et al., 2013). Analyses have shown that purifying biogas to biomethane and using it instead of diesel, provides the best climate benefit (Arnøy, et al., 2013).
1.6. Structure of the Thesis
Environmental issues related with fuel combustion in the transport sector is the core of this thesis. Main purpose is to discuss how state-of-the-art technologies could be successfully used to evolve biofuels utilization. In particular, biogas was considered to be the best biofuel able to replace fossil fuels in the short-medium term without increasing dependency in NG importations. The present work is structured in three main section. In the first section (Chapter 2), worldwide energy policy related with transport sector are investigated. More detailed information are presented for People’s Republic of China, Europe and Italy. Biogas and biomethane potentials in terms of achievable billion cubic meters (bcm) per year are also presented. A feasibility analysis regarding biogas used as vehicle fuel in both its compressed and liquefied form in the Italian country is presented as the starting point to develop the subsequent work. In the second section (Chapter 3), CNG technologies are investigated. A brief state-of-the-art is presented related with the conventional refueling stations. Since biogas is considered to be used instead of NG from national gas grid, the final product would be Compressed BioGas (CBG). A conventional refueling station configuration was selected for the work. Moreover, a novel patented refueling station configuration is presented. Purpose of this section is the evaluation of both the conventional and novel CBG refueling stations in order to compare energy consumption, compression power required as well as performances during the vehicles charging. The stations were completely modeled, thus compressor sizing and operation, storage sizing and charging process and vehicles
23
charging process models are presented and discussed. Analysis was conducted by means of NIST, Refprop software (NIST) for thermodynamic properties of gases. MathWorks®, Matlab software was used to simulate refueling station function as well as for defining charging logics. In the third section (Chapter 4), LNG technologies are investigated. A brief state-of-the-art is presented related with the conventional natural gas liquefaction plants. Main objective of this analysis regards the possibility of producing Liquefied BioGas (LBG) directly from raw biogas, avoiding standard purification process. The advantage of this possibility is to achieve the same result with a single plant instead of several. Therefore, state-of-the-art of purification techniques is presented, with a specific focus on hydrogen sulfide (H2S) and carbon dioxide (CO2) removal processes, namely desulphurization and upgrading
processes respectively. A novel cryogenic separation process able to simultaneously remove CO2 and producing
LBG with liquefied carbon dioxide (L-CO2) production and cold energy recovery is presented and detailed
discussed. A second novel cryogenic separation process able to simultaneously remove H2S and CO2 and producing
LBG with cold energy recovery is presented and detailed discussed. Finally, proposed processes are compared with the standard available technologies in LBG production. The analysis was conducted by means of AspenHYSYS®, AspenTech for the plant simulation and thermodynamic properties of several gaseous mixtures. MathWorks®, Matlab software was used for sensitivity analysis as well as for software connections, while modeFrontier®, ESTECO was implemented for plant optimizations. Eventually, obtained results and future perspectives are presented in final conclusions (Chapter 5).
24
1.7. References
• Arnøy, S., Møller, H., Modahl, I. S., Sørby, I., & Hanssen, O. J. (2013). Biogassproduksjon i Østfold-Analyse av klimanytte og økonomi i et verdikjedeperspektiv.Kråkerøy: Østfoldforskning.
• Arteconi A., Brandoni C., Evangelista D., Polonara F. 2010a, Life-cycle greenhouse gas analysis of LNG as a vehicle fuel in Europe, Applied Energy 87: 2005-2013.
• Arteconi A., Polonara F. 2012, LNG as vehicle fuel in Italy, Proceedings of the 12th Cryogenics IIR Conference, Dresda, Paper 041.
• Arteconi, A., Brandoni, C., Bartolini, C.M., Polonara, F., 2010b. Greenhouse Gas emissions of heavy-duty vehicles fuelled by natural gas. IANGV 2010. Roma.
• Butz, S. (2014). Energy and Agriculture: Science, Environment, and Solutions.Stamford: Cengage Learning.
• Crutzen, J.,Mosier,A.,Smith,K.,Winiwarter,W.,2007.N2O releasefromagro- biofuel productionnegatesglobalwarmingreductionbyreplacingfossilfuels. Atmos. Chem.Phys.Discuss.7,11191– 11205.
• Demirel Y., (2012). Energy: production, conversion, storage, conservation, and coupling. Springer. Berlin Heidelberg. 2012. URL: http://www.springer.com/cn/book/9781447123712.
• Dincer I., Rose A. M., (1998). A Worldwide Perspective on Energy, Environment and Sustainable Development. International Journal of Energy Research. 22: 1305-1321.
• Directive 2008/98/EC on waste (Waste Framework Directive). Retrieved from: http://ec.europa.eu/environment/waste/framework/ (last accessed – 30/11/2017).
• EIA, Energy Information Administration, 2007. Biofuels in the US Transportation Sector. Published in Annual Energy Outlook 2007, February 2007.
• European Commission (EC) 2001. Green paper: towards a European strategy for the security of energy supply, Luxembourg. 105 p.
• Farrell, A., Plevin, R., Turner, B., Jones, A., O’Hare, M., Kammen, D., 2006. Ethanol can
• Hekkert, M.P., Hendriks, F.H.J.F., Faaij, A.P.C., Neelis, M.L., 2005. Natural gas as an alternative to crude oil in automotive fuel chains well-to-wheel analysis and transition strategy development, Energy Policy 33: 579-794.
• IEA 2009, Transport, Energy and CO2 , International Energy Agency Report.
• IEA, International Energy Agency (2017), CO2 emissions from fuel combustion.
• IPCC, Intergovernmental Panel on Climate Change (2012), Renewable Energy Sources and Climate Change Mitigation.
• IPCC, Intergovernmental Panel on Climate Change (2017), Global Worming Potential Values. • Johnson, S,2007.The(food)priceofsuccess.FinanceDev.—Q. Mag.Int.Monetary Fund 44(4).
• Larson, E., 2008. Biofuels Production Technologies: Status, Prospects and Implica- tions for Trade and Development. United Nations Conference on Trade and Development.
• Lin, Y., Wang, D., Liang, J., & Li, G. (2012). Mesophilic anaerobic co - digestion of pulp and paper sludge and food waste for ethane production in a fed-batch basis. In Environmental Technology (pp. 2627-2633). Taylor and Francis.
• López, M. E., Rene, E. R., Veiga, M. C., & Kennes, C. (2013). Biogas Upgrading. In C. Kennes, & M. C. Veiga, Air Pollution Prevention and Control (pp. 293-318). Chichester: Wiley.
• Macedo, I.,Leal,M.,daSilva,J.,2004.Assessmentofgreenhousegasemissionsin the productionanduseoffuelethanolinBrazil.ReporttotheGovernmentof the StateofS~ao Paolo.
• Mercer-Blackman, V., Samiei, H., Cheng, K., 2008. Biofuel Demand Puschs Up Food Prices. International Monetary Fund Survey Magazine: IMF Research, 17.10.2008.
• Mitchell, D., 2008. A note on rising food prices. Policy Research Working Paper 4682, The World Bank, July 2008.
• OECD, 2007. Documentation of the AGLINK-COSIMO Model. Document AGR/CA/ APM(2006) 16/FINAL, March 2007.
• OECD, 2008.BiofuelSupportPolicies—An EconomicAssessment. • OECD/FAO, 2009. Agricultural Outlook 2009–2018.
25
• OECD/ITF, 2008. Biofuels: Linking Support to Performance.
• Pimentel, D., Patzek, T., 2005. Ethanol production using corn, switchgrass and wood: biodiesel production using soybean and sunflower. Nat. Resour. Res. 14 (1).
• Rajagopal, Deepak; Zilberman, David. (2007). Review of Environmental, Economic and Policy Aspects of Biofuels. Policy Research Working Paper; No. 4341. World Bank, Washington, DC. © World Bank. • Roser M., Ortiz-Ospina E., (2017), ‘World Population Growth’. Published online at OurWorldInData.org.
Retrieved from: https://ourworldindata.org/world-population-growth/ (last accessed – 30/11/2017). • Santos, M., Grande, C., & Rodrigues, A. (2013, April 3). Dynamic Study of the Pressure Swing Adsorption
Process for Biogas upgrading and Its Responses to Feed Disturbances. Industrial & Engineering Chemistry Reasearch, pp. 5445-5454.
• Schmidhuber, J., 2007. Biofuels: an emerging threat to Europe’s Food Security? Impact of an increased biomass use on agricultural market, prices and food security: a longer-term perspective. Policy Paper 27, Notre Europe, May 2007.
• Sorda G., Banse M., Kemfert C., (2010). An Overview of Biofuel Policies Across the World. Energy Policy. 38: 6977-6988.
• UNCTAD, United Nations Conference on Trade and Development, 2008. Addressing the global food crisis: key trade, investment and commodity policies in ensuring sustainable food security and alleviating poverty. In: The High-Level Conference on World Food Security: The Challenges of Climate Change and Bioenergy, Rome, Italy, 3–5 June, 2008.
• Yeh, S., 2007. An empirical analysis on the adoption of alternative fuel vehicles: The case of natural gas vehicles. Energy Policy 35: 5865–5875.
27
2. BIOFUELS AND BIOGAS OVERVIEW – AN ITALIAN
CASE STUDY
As briefly discussed in Chapter 1, biofuels have the potential to positively influence decarbonization with substantial consequences in GHG emission reduction. This is particularly referred to the transport sector, affecting 24% of global CO2 production due to fuel combustion. A possible solution to this is represented by biofuels, able to
significantly reduce environmental impact and air pollution during combustion. However, since biofuels production is not cost-effective compared with traditional fuels, incentives and specific governmental policies are required. In this Chapter, biofuels production and related incentives are presented from all over the world. Specific policies and incentive schemes related with biogas production and utilization as vehicle fuel will be discussed. Attention will be reserved for the Chinese and the European ones. Finally, the Italian incentive scheme for biogas production and utilization is investigated. A case study is presented in order to evaluate the feasibility of liquefied biogas (LBG) in the Italian context.
2.1. The Biofuels Market Evolution
Table 2.1. Biofuels production per region over the last 7 years (BP Statistical Review, 2017)
Years 2010 2011 2012 2013 2014 2015 2016 2016 Countries Thousand tonnes of oil equivalent
US 28044 31184 29808 31057 32890 33849 35779 43.50% Canada 809 950 1017 1056 1188 1142 1160 1.40% Mexico 14 13 15 58 58 58 58 0.10% North America 28866 32147 30840 32171 34137 35049 36997 45.00% Argentina 1670 2234 2295 2014 2644 2038 2828 3.40% Brazil 16866 14403 14739 17114 18005 19332 18552 22.50% Colombia 455 572 627 650 676 693 626 0.80% South America 19220 17519 17961 20131 21703 22442 22378 27.20% Austria 391 390 390 374 329 381 419 0.50% Belgium 603 664 562 547 574 556 558 0.70% Finland 301 208 263 330 367 445 446 0.50% France 2353 1935 2145 2306 2541 2519 2226 2.70% Germany 3022 2967 3031 2770 3460 3191 3198 3.90% Italy 678 486 298 457 585 582 583 0.70% Netherlands 391 674 1276 1495 1756 1675 1680 2.00% Poland 439 414 652 697 750 940 898 1.10% Portugal 284 330 276 274 301 321 298 0.40% Spain 1312 851 620 749 1030 1122 1148 1.40% Sweden 339 400 491 635 789 222 211 0.30% United Kingdom 304 322 303 517 403 310 351 0.40% Europe 11604 10876 11734 12503 14445 14012 13777 16.70% Africa 8 8 23 32 40 40 40 - Australia 222 223 239 202 169 157 144 0.20% China 1584 1970 2103 2346 2609 2653 2053 2.50% India 123 210 229 268 349 410 505 0.60% Indonesia 723 1110 1397 1750 2547 1354 2503 3.00% South Korea 511 309 283 321 337 385 404 0.50% Thailand 700 765 1054 1330 1490 1603 1610 2.00%
Asia & Pacific 4306 5280 6300 7450 9374 8476 9110 11.10%
World 64008 65834 66863 72293 79703 80024 82306 100.00%
Over the last two decades, biofuels production was driven mainly by the necessity of self-sufficient energy production, fossil fuels importation reduction and development domestic agriculture (Araújo, 2017, Kovarik, 2013). More recently, minimization in GHG emissions related with transportation sector has also become a key point in biofuels production (REN21, 2016). These fuels are seen as instruments to achieve the shift to a low-carbon and
28
sustainable transport sector (IRENA, 2016). Since 2000, the global biofuels supply has increased dramatically representing about 4% of the global transport fuels in 2015 (REN21, 2016). Reasons of this trend is mainly due to policies such as blending mandates, which promote greater biofuels utilization, protecting them from oil price flux over time (REN21, 2016; EIA, 2017). In special transport sectors such as aviation, marine transport, and heavy freight, biofuels seem to be the only low-carbon alternative to traditional fossil fuel (IRENA, 2016). This is mainly the case of aviation sector, in which GHG emissions are foreseen to increase in a range of about 400 - 600% from 2010 to 2050 (ICAO, 2013). Considering this trend, aviation industries set target related with GHG emissions reduction (IATA, 2015). As a consequence, in 2008 the first commercial test flight using biofuels was achieved and in 2015, 22 airline companies were using successfully biofuels as combustion fuel (REN21, 2016). However, plant construction as well as biofuels production have slowed down since 2010, reflecting policy uncertainty (REN21, 2016). This is mainly due to the criticism related with food versus fuel trade-offs, GHG emissions in an LCA perspective, and land use.
In Table 2.1, regional biofuels productions from 2010 to 2016 are reported. During 2016, Brazil and the United States represented more than 66% of the world’s biofuel production. Primary feedstock sources were sugarcane for the former and corn for the latter (REN21, 2016). Figure 2.1 shows regional biofuels production trends since 1990. The European Union and Asia biofuels production market has developed considerably over the last two decades. The European Union focuses on bio-diesel using waste, soy, rapeseed, and palm as biomass source (Huenteler, 2015). On the other hand, Asian biofuels production mostly involves sugarcane, corn, wheat, and cassava. Other minor biomass sources regard palm, soybean, rapeseed, and Jatropha. From 2013 to 2015, global share of ethanol fuel compared to bio-diesel fuel is of about 3 to 1 (REN21, 2016). Regarding specific biomass used during Generation 1 to produce conventional biofuels, starch, sugar, vegetable oil, and animal fat comprehend most of the supply (OECD-UN, 2016).
Figure 2.1. Yearly biofuel production per region
Biofuels production involves several processes and technologies able to obtain combustion fuels to substitute traditional fuels. Those processes mainly consist in hydrolysis and fermentation processes as well as esterification or trans-esterification. Table 2.2 shows brief description about feedstock and required technology for most common biofuels. As the central focus of the thesis regards biogas, this kind of fuel will be discussed more in detail in a specific section. Fermentation of sugar, such as cane or beets, allows ethanol production. Also corn or wheat starch as well as root crops are used to this purpose (EIA, 2011; Kojima, 2006; Seelke, 2007). Its higher-octane rating is higher than that of conventional gasoline, improving combustion properties. Thus, higher compression ratio could be achieved in traditional engines (Anderson, 2012). By the way, ethanol is characterized by roughly 70% as energy density as gasoline by comparison (IRENA, 2016; IRENA, 2016). As a consequence, ethanol combustion is less pollutant than traditional fuels, while granting lower autonomy. However, GHG emissions reduction could only be achieved if the productive process is environmental friendly. It is also possible to use it as an additive to gasoline, with a share of about 10% (REN21, 2016; EIA, 2011; USDA, 2016). In Brazil, common practice allows any blend of gasoline and ethanol, as well as ethanol only (Araújo, 2017). Further improvements in vehicle industries could allow a higher blending level, up to 40% of total fuel, while keeping combustion efficiency constant. At present, operating vehicles with 15% ethanol blend experiencing a considerably efficiency reduction (Theiss, 2016).
29
Considering biodiesel, esterification and trans-esterification of vegetable oils or animal fat allow its production for diesel blending or substitution. Although biodiesel combustion is much similar to that of traditional diesel, it presents lower carbon content ranging from 4 to almost 7 times lower than diesel. For this reason, biodiesel is cleaner during combustion, achieving GHG emissions reduction (Solomon, 2014). Biodiesel is more likely produced in EU and parts of Latin America (DOE, 2016). During Generation 2, non-food crops and residues or waste materials are strongly preferred to food-related biomass sources in order to produce advanced biofuels. Hydrolysis, fermentation (also combined with hydrolysis), pyrolysis, hydrotreating and syngas’s alcohol fermentation are key processes. Biofuels obtained during Generation 2 are renewable diesel and gasoline and biobutanol. Renewable diesel and gasoline are produced from lipids or cellulosic materials. These fuels can readily replace standard fossil fuels being compatible with traditional engine and refueling stations. As a consequence, no additional investments are required in order to introduce those fuels in the market.
Hydrotreating, pyrolysis and gasification processes are commonly used to produce renewable diesel (DOE, 2016). Those processes grant less issues related with NOX emissions, storage stability, cold properties and deposition
formation, affecting mostly biofuels obtained by means of esterification process (Aatola, 2008). Regarding renewable gasoline production, fermentation of sugars is generally used as common process. Biomass fermentation is generally involved in biobutanol production. This biofuel presents an energy density lower than gasoline in a range of 10 – 20%. By the way, this value is considerably high if compared with biofuels such as biodiesel or ethanol (DOE, 2016). Comparing biofuels performances to those of traditional fossil fuel, some differences could be identified. As already mentioned, necessary octane level is generally achieved in biofuels, thus engine efficiency is not considerably affected by biofuels combustion. Another important aspect is represented by energy density. Since energy density is strictly related with vehicle’s autonomy, too low values could negatively affect some biofuels diffusion. Referring to diesel performances, ethanol has an energy density reflecting a lower autonomy of about 25 – 30%, while biodiesel nearly the same. In heavy-duty engines, several studies proved biodiesel to effectively reduce GHG emissions during combustion. Although this results strongly depend on several factors such as the process used in biodiesel production, the feedstock involved in and adopted mixture (EPA, 2002), biodiesel achieves a considerably reduction in total air pollution. By completely substitute diesel with biodiesel, combustion process emits 70% less hydrocarbons and roughly 50% less particulates and carbon monoxide (CO). However, produced NOX are increasing by 10% (EPA, 2002). As a consequence, biodiesel could grant almost 50% less air pollution if
compared with standard diesel (Cowie, 2016, EPA, 2002). As for biodiesel, environmental impact of ethanol fuel is also influenced by several aspects. In particular, it depends on production process as well as on feedstock generation types. Furthermore, acetaldehyde emission during biofuels production can considerably increase air pollution. It was estimated an impact related with ethanol and biodiesel production in a range of 2-69 kg CO2-eq/GJ
and 20-49 kg CO2-eq/GJ respectively. Thus, emission related with biofuels production still represents a challenge
in a climate mitigation perspective (Cowie, 2016; EPA, 2002; Grosjean, 1990). Feedstock diversity is strongly influenced by local conditions and farms. Table 2.3 gives some insight regarding this point. Algae is related with a group of photosynthetic organisms. This feedstock is very promising for biofuels production, especially for their high oil content, limited waste streams and very low land requirements compared with other biomass sources (U.S. EPA, 2011; Dismukes, 2008). Water requirement for algae cultivations is a key point. by the way, fresh water, brackish, saline, and wastewater are allowed as water sources. However, since data related with algae to be used as feedstock source in biofuels production are still limited, environmental impact of such a biomass growth and utilization is uncertain (U.S. EPA, 2011; Dismukes, 2008; Scott, 2010). Corn represents a fundamental food source able to grow in a wide range of climates from tropical to temperate. High level of fertilizer and pesticide are associated with corn growth (Elbehri, 2013; EEA, 2006). If used as feedstock for ethanol production, water requirements are relatively low and dependent to produced ethanol (Elbehri, 2013; Aden, 2007; NRC, 2008). The United States leads the world ethanol production from corns. Jatropha is a non-food highly drought resistant crop, able to grow with a wide range of climates, soil and water conditions (Koundinya, 2008). More and more countries are investing in Jatropha as a feedstock for biofuels production. Up to now, grater producer is Guatemala which has designated 25,000 acres for its cultivation. Other major investors are represented by Mexico, Sudan, Ethiopia, and India (Lane, 2014). Lignocellulosic material derives from non-edible crops. Specific practices allow lignocellulosic materials to limit cropland expansion and related emissions (Murphy, 2015). This kind of feedstock is obtained from many different sources, such as switchgrass, trees, and agricultural crop residues. Rice straw, wheat straw, corn stover, and sugarcane bagasse are also eligible (Hadar, 2013). 2.3 billion tons of straw were available in 2011, with a potential ethanol production of about 560 million tons (Kahr, 2013). Depending on the lignocellulose feedstock, water requirements varies, however very little water is usually needed (Kumar, 2015). Incentives are disposed for biofuels production by means of this biomass type instead of common crops. The biofuel production consists in breaking down fibrous plant walls into sugars.