molecules
ISSN 1420-3049 www.mdpi.com/journal/molecules
Article
A Comparison of the Environmental Impact of Different AOPs:
Risk Indexes
Jaime Giménez 1,*, Bernardí Bayarri 1, Óscar González 1, Sixto Malato 2, José Peral 3 and Santiago Esplugas 1
1 Departament d’Enginyeria Química, Universitat de Barcelona, C/Martí i Franquès 1, Barcelona 08028, Spain; E-Mails: [email protected] (B.B.); [email protected] (O.G.); [email protected] (S.E.)
2 Plataforma Solar de Almería (CIEMAT), Carretera de Senes, km 4, Tabernas, Almería 04200, Spain; E-Mail: [email protected]
3 Departament de Química, Edifici Cn, Universitat Autònoma de Barcelona, Bellaterra, Cerdanyola del Vallès 08193, Spain; E-Mail: [email protected]
* Author to whom correspondence should be addressed; E-Mail: [email protected]; Tel.: +34-934-021-293; Fax: +34-934-021-291.
Academic Editor: Pierre Pichat
Received: 17 September 2014 / Accepted: 24 December 2014 / Published: 31 December 2014
Abstract: Today, environmental impact associated with pollution treatment is a matter of great concern. A method is proposed for evaluating environmental risk associated with Advanced Oxidation Processes (AOPs) applied to wastewater treatment. The method is based on the type of pollution (wastewater, solids, air or soil) and on materials and energy consumption. An Environmental Risk Index (E), constructed from numerical criteria provided, is presented for environmental comparison of processes and/or operations. The Operation Environmental Risk Index (EOi) for each of the unit operations involved in the process and the Aspects Environmental Risk Index (EAj) for process conditions were also estimated. Relative indexes were calculated to evaluate the risk of each operation (E/NOP) or aspect (E/NAS) involved in the process, and the percentage of the maximum achievable for each operation and aspect was found. A practical application of the method is presented for two AOPs: photo-Fenton and heterogeneous photocatalysis with suspended TiO2 in Solarbox. The results report the environmental risks associated with each process, so that AOPs tested and the operations involved with them can be compared.
Keywords: AOPs environmental impact; risk assessment; environmental risk indexes; AOPs comparison; sustainability
1. Introduction
Sustainability is one of today’s most important goals in any human activity, and decreased environmental impacts must be a basic objective for its achievement. Therefore, many businesses are implementing environment management systems following such standards as the ISO 14001 [1] or EMAS [2], which are the starting point for pollution control.
There are several different methods for evaluating environmental impact. Life Cycle Assessment (LCA) is one of the most widely used. LCA includes four steps: goal and scope definition, inventory analysis, Life Cycle Impact Assessment (LCIA) and interpretation of results. In the first step (goal and scope), the limits of the system and the focus of the analysis are defined. Inventory analysis involves compiling an inventory of raw materials, energy consumption and pollutants production. In the LCIA step, the data from the inventory are assigned to different impact categories and characterized according to the corresponding factors. These impact categories depend on whether midpoint methods [3,4], defining only impacts in categories such as ozone depletion, climate change, etc., or endpoint methods [5,6], which analyze final impacts on human health, environment or resources consumption, are used.
Environmental consequences can also be analysed using an environmental risk index, as provided for in Directive 96/82/EC [7], which is to be replaced as of June 1, 2015, by Directive 2012/18/EU [8]. It is based on the analysis of four parameters: risk sources (analysis of possible accidents including hazardous substances involved), primary control systems (preventive and protective measures to reduce the consequences of an accident, for example, retention ponds), transport systems (pollutant concentration profile in the area affected by a spill), and sensitive receptors (agricultural areas, protected species, monuments, etc., present in the area affected by a spill). With these factors, the environmental consequences index can be calculated, which when combined with the probability of an accident, results in an environmental risk index.
A third method of environmental analysis is based on Directive 2004/35/CE [9]. This Directive proposes a methodology very similar to the one used for risk evaluation in industrial safety. The first step is the identification of hazards and possible environmental accidents by techniques such as the event tree. The second step is modelling the accidents and evaluating their consequences, considering the setting where they occur. Then risk is evaluated by including their probability, estimated, for instance, by tree fault analysis. Finally, an economic assessment is made of damage caused by the accidents and the cost of recovery of affected areas.
Finally, the methodology (Arteche et al. [10]) selected for the estimation of environmental impact in this study is based on application of risk indexes [11]. The first stage is identification of the steps in the processes under study in three different situations: normal, abnormal and emergency operations. The environmental impact is evaluated for each considering two aspects, pollution (wastewater, solids, air or soil) and consumption (raw materials, water, energy). Risk assessment is based on frequency (probability),
hazard and amount (volume). Numerical criteria are provided to assign a value to the environmental risk, thus enabling comparison of the environmental impact of processes and/or operations. The numerical criteria proposed by Arteche et al. [10] were updated and adapted to the particular cases studied, which were laboratory or small pilot plant operations, and current legislation. The values found in this paper are therefore noticeably different from those originally proposed by Arteche et al. [10]. The final result is the Global Environmental Risk Index (E), which gives an overview of the environmental priority of each activity related to other analogous activities. Its evaluation is the main purpose of this paper. Other related indexes are also evaluated for comparison of the various process operations and aspects involved. This method is amply explained in the following sections, and a practical application is developed for two AOPs, photo-Fenton and heterogeneous photocatalysis with TiO2 in suspension, both carried out in a Solarbox. This application enables evaluation of such processes according to their risk.
2. Results and Discussion
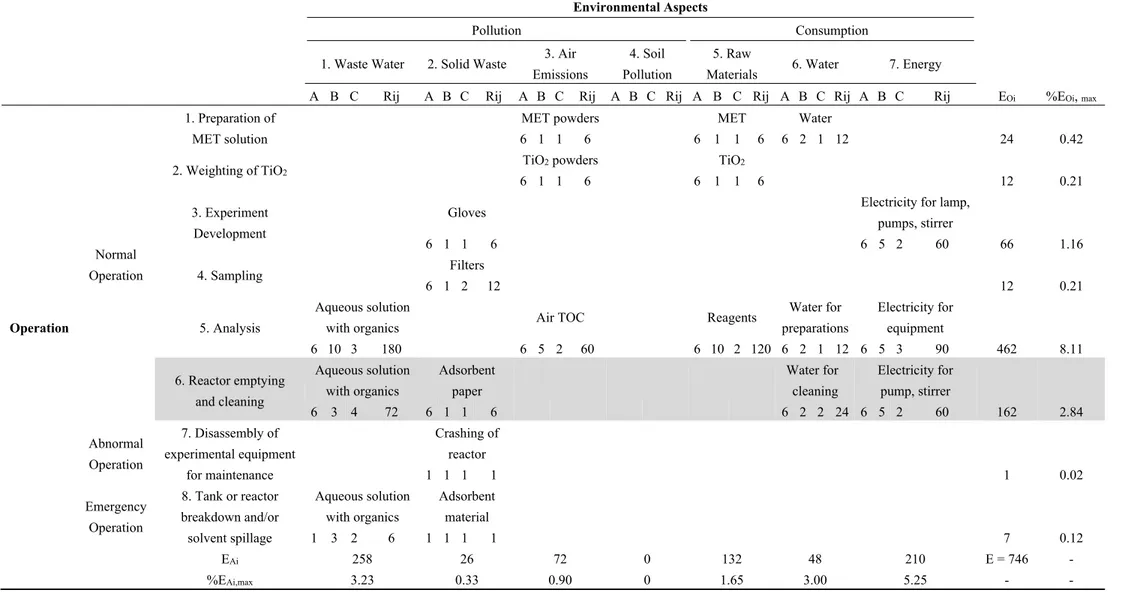
The environmental impact indexes are calculated as shown in Table 1, where the operations involved in the evaluation are given on the left, and the points evaluated are at the top. As shown in the second column, three types of operations are considered: normal, abnormal and emergency. The operations included in each group are described in the third column. Photocatalytic treatment of metoprolol tartrate salt (MET), a common β-blocker found in wastewater [12], in aqueous solution with TiO2 in suspension in the Solarbox, is presented as an example. In this case, the operations included are (see third column in Table 1):
• Normal: Preparation of MET solution, Weighting TiO2, Experiment Development, Sampling, Analysis, Reactor emptying and cleaning.
• Abnormal: Disassembly of experimental equipment for maintenance. • Emergency: Tank or reactor breakdown and/or solvent spillage.
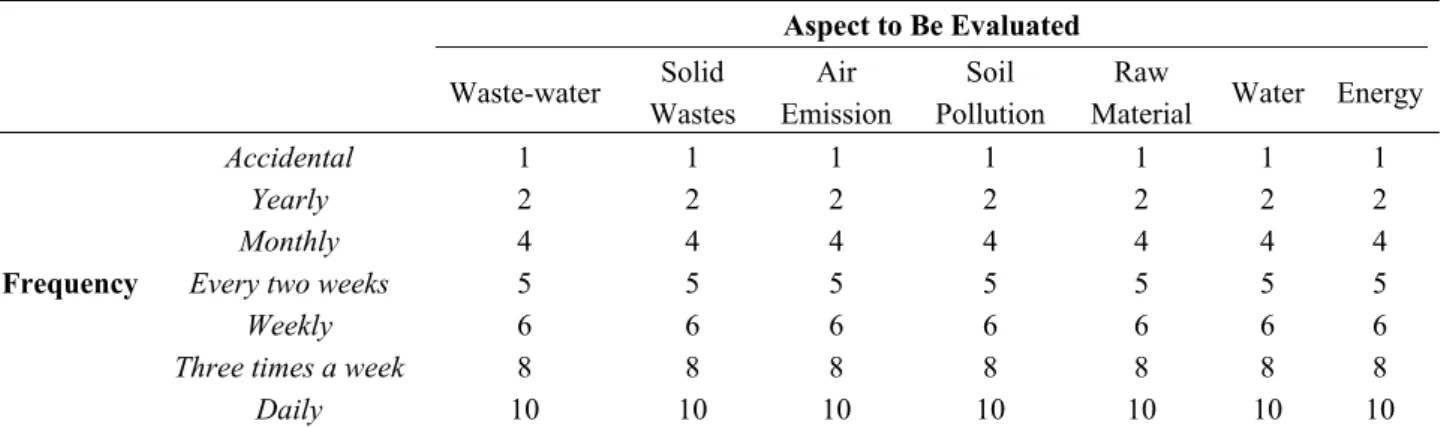
Two aspects are evaluated—pollution and consumption (second row in Table 1)—and each includes several specific parameters. Four parameters are considered for pollution: wastewater, solid waste, air emission and soil pollution (third row in Table 1). Consumption includes raw materials (in our case, MET), water and energy (third row in Table 1). For each of these (fourth row in Table 1), frequency (A), hazard (B) and amount (C) are considered. The final result, which is calculated as the product of these values, as shown in Column Rij, gives an idea of the risk of that aspect. Numerical values assigned to
evaluate each item are from the criteria in Tables 2–4. The values proposed by Arteche [10] are taken as a first approximation. However, they have been modified and updated to current legislation and adapted to laboratory, pilot plant or industrial scale for this study.
Table 1. Environmental Risk Identification and Evaluation. Process tested: MET treatment by photocatalysis with TiO2 in the Solarbox. Parameters A–C are defined in Tables 2–4, respectively.
Environmental Aspects
Pollution Consumption
1. Waste Water 2. Solid Waste 3. Air Emissions
4. Soil Pollution
5. Raw
Materials 6. Water 7. Energy
A B C Rij A B C Rij A B C Rij A B C Rij A B C Rij A B C Rij A B C Rij EOi %EOi, max
Operation
Normal Operation
1. Preparation of MET solution
MET powders MET Water
6 1 1 6 6 1 1 6 6 2 1 12 24 0.42
2. Weighting of TiO2 TiO2 powders TiO2
6 1 1 6 6 1 1 6 12 0.21
3. Experiment Development
Gloves Electricity for lamp,
pumps, stirrer 6 1 1 6 6 5 2 60 66 1.16 4. Sampling Filters 6 1 2 12 12 0.21 5. Analysis Aqueous solution
with organics Air TOC Reagents
Water for preparations Electricity for equipment 6 10 3 180 6 5 2 60 6 10 2 120 6 2 1 12 6 5 3 90 462 8.11 6. Reactor emptying and cleaning Aqueous solution with organics Adsorbent paper Water for cleaning Electricity for pump, stirrer 6 3 4 72 6 1 1 6 6 2 2 24 6 5 2 60 162 2.84 Abnormal Operation 7. Disassembly of experimental equipment for maintenance Crashing of reactor 1 1 1 1 1 0.02 Emergency Operation 8. Tank or reactor breakdown and/or solvent spillage Aqueous solution with organics Adsorbent material 1 3 2 6 1 1 1 1 7 0.12 EAi 258 26 72 0 132 48 210 E = 746 - %EAi,max 3.23 0.33 0.90 0 1.65 3.00 5.25 - -
Table 2. Parameter A (Frequency): Numerical values for Parameter A, assigned by the frequency (probability) of occurrence of each event.
Aspect to Be Evaluated Waste-water Solid Wastes Air Emission Soil Pollution Raw
Material Water Energy
Frequency
Accidental 1 1 1 1 1 1 1
Yearly 2 2 2 2 2 2 2
Monthly 4 4 4 4 4 4 4
Every two weeks 5 5 5 5 5 5 5
Weekly 6 6 6 6 6 6 6
Three times a week 8 8 8 8 8 8 8
Daily 10 10 10 10 10 10 10
Table 3. Parameter B (Hazard): Numerical values for Parameter B, assigned by how hazardous each event is.
Emission or Consumption Hazard Rate Notes
Wastewater
No contact with raw materials or products 1
Contact Non-hazardous 3 (1),(3)
Contact with Products with signal word Warning 6 (1),(3) Contact with Products with signal word Danger 10 (1),(3)
Solid Wastes
Not in Decision 2000/532/EC 1 (2),(3)
Not hazardous in Decision 2000/532/EC 5 (2),(3) Hazardous in Decision 2000/532/EC 10 (2),(3)
Air Emissions
Non-hazardous 1 (1),(3)
Products with signal word Warning 5 (1),(3) Products with signal word Danger 10 (1),(3)
Soil Pollution
Non-hazardous 1 (1),(3)
Products with signal word Warning 5 (1),(3) Products with signal word Danger 10 (1),(3)
Raw Materials
Non-hazardous 1 (1),(3)
Products with signal word Warning 5 (1),(3) Products with signal word Danger 10 (1),(3)
Water
Any water consumption 2
Energy
Any energy consumption 5
(1) Classification according to CLP Regulation Signal Word. Regulation (EC) No 1272/2008 aligns existing EU legislation to the United Nations Globally Harmonised System (GHS). This new regulation on classification, labelling and packaging (“CLP Regulation”) contributes to the GHS aim for the same hazards to be described and labelled in the same way worldwide [13]; (2) Decision 2000/532/EC establishes a list of hazardous wastes [14,15]; (3) When there is a mix of products, if one of them has the signal word Danger, the score assigned is 10. If more than two products have one hazard level, the value assigned is the one corresponding to the next level. For instance, if more than two products have the signal word Warning, the value assigned is also 10 (corresponding to the signal word Danger).
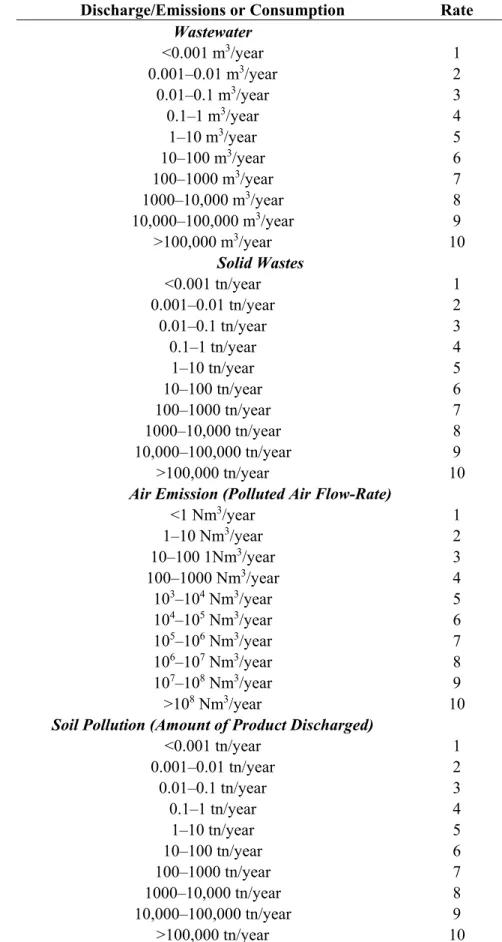
Table 4. Parameter C (Amount): Numerical values for Parameter C, assigned by the amount of product or energy consumption involved.
Discharge/Emissions or Consumption Rate
Wastewater <0.001 m3/year 1 0.001–0.01 m3/year 2 0.01–0.1 m3/year 3 0.1–1 m3/year 4 1–10 m3/year 5 10–100 m3/year 6 100–1000 m3/year 7 1000–10,000 m3/year 8 10,000–100,000 m3/year 9 >100,000 m3/year 10 Solid Wastes <0.001 tn/year 1 0.001–0.01 tn/year 2 0.01–0.1 tn/year 3 0.1–1 tn/year 4 1–10 tn/year 5 10–100 tn/year 6 100–1000 tn/year 7 1000–10,000 tn/year 8 10,000–100,000 tn/year 9 >100,000 tn/year 10
Air Emission (Polluted Air Flow-Rate)
<1 Nm3/year 1 1–10 Nm3/year 2 10–100 1Nm3/year 3 100–1000 Nm3/year 4 103–104 Nm3/year 5 104–105 Nm3/year 6 105–106 Nm3/year 7 106–107 Nm3/year 8 107–108 Nm3/year 9 >108 Nm3/year 10
Soil Pollution (Amount of Product Discharged)
<0.001 tn/year 1 0.001–0.01 tn/year 2 0.01–0.1 tn/year 3 0.1–1 tn/year 4 1–10 tn/year 5 10–100 tn/year 6 100–1000 tn/year 7 1000–10,000 tn/year 8 10,000–100,000 tn/year 9 >100,000 tn/year 10
Table 4. Cont.
Discharge/Emissions or Consumption Rate
Raw Materials <0.001 tn/year 1 0.001–0.01 tn/year 2 0.01–0.1 tn/year 3 0.1–1 tn/year 4 1–10 tn/year 5 10–100 tn/year 6 100–1000 tn/year 7 1000–10,000 tn/year 8 10,000–100,000 tn/year 9 >100,000 tn/year 10 Water <0.1 m3/year 1 0.1–1 m3/year 2 1–10 m3/year 3 10–100 m3/year 4 100–1000 m3/year 5 1000–10,000 m3/year 6 10,000–100,000 m3/year 8 >100,000 m3/year 10 Energy <50 kW.h/year 1 50–500 kW.h/year 2 500–2500 kW.h/year 3 2500–15,000 kW.h/year 5 15,000–75,000 kW.h/year 7 75,000–150,000 kW.h/year 9 >150,000 kW.h/year 10
As an example, the proposed method has been applied to the photocatalytic treatment of MET with TiO2 in suspension in a Solarbox (Table 1). For each operation and each environmental aspect involved in the process, a Rij index can be evaluated, where subscript i indicates the operation and subscript j
indicates the environmental aspect. In our case, i varies from 1–8, because eight operations are involved in the process (see third column in Table 1). On the other hand, subscript j varies from 1–7, because there are seven environmental aspects (see third row in Table 1). The specific agent is shown in the cell corresponding to each operation and for each environmental aspect. For instance, in Environmental Aspect 1 (wastewater), the specific wastewater generated is shown in the corresponding cells (see Table 1):
aqueous solution with organics for Operation 6 (Reactor emptying and cleaning) and aqueous solution with organics for Operation 8 (Tank or reactor breakdown and/or solvent spillage).
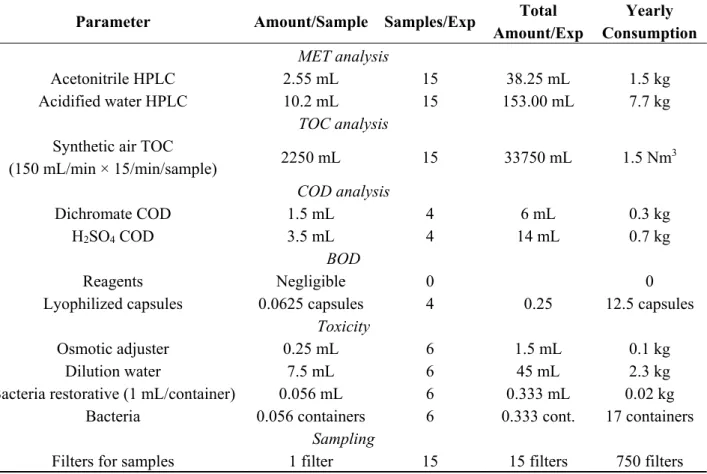
Data related to energy or raw materials and reagent consumption are required for any environmental impact assessment. Electricity consumption data for photocatalytic treatment of MET in the Solarbox are shown in Table 5. Obviously, the consumption of raw materials must be known. This is summarized in Table 6. The consumption of reagents for analysis must also be included in raw materials consumption. These data are presented in Table 7.
Table 5. Electricity consumption in MET photocatalytic treatment experiments in a Solarbox for 50 experiments/year.
Experiment
Equipment Time Use Equipment
(h/exp) Power (kW) Consumption (kWh) Yearly Consumption (kWh/y) Lamp (1000 W) 5.5 1.00 5.50 275 Pump (250–500 W) 5.5 0.40 2.20 110 Thermostatic bath (240 W at 20 °C) 5.5 0.24 1.32 66 Stirrer (1–5 W) 5.5 0.003 0.02 0.8
Total consumption/year (kWh/y) 452
Analysis
Equipment Time Use Equipment
(h/exp) Power (kW) Consumption (kWh) Yearly Consumption (kWh/y) HPLC (12 samples × 15 min/sample) 3 2.50 7.50 375
TOC (12 samples × 15 min/sample) 3 2.20 6.60 330 Spectrophotometer
(DQO+Fe+H2O2+SUVA)
0.2 0.25 0.05 2.5
Water deionization device (preparation
1 L water) 0.1 0.10 0.01 0.5
Total consumption/year (kWh/y) 708
Table 6. Reagent consumption in the photocatalytic experiments with a 1 L reaction volume for 50 experiments/year.
Reagents Concentration—Amount/Exp Total Amount/Exp Yearly Consumption (kg)
Metoprolol tartrate salt 50 mg/L 50 mg 0.003
TiO2 0.4 g/L 0.4 g 0.02
Millipore Water 1.00 L 50
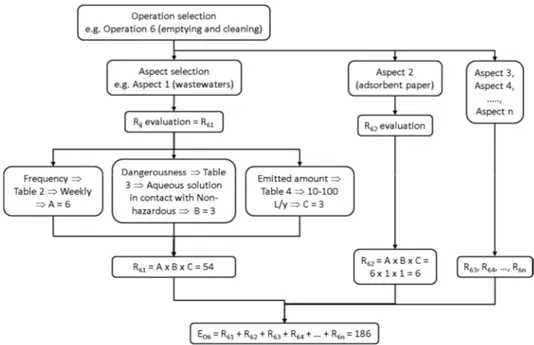
An explanation for one of the lines in Table 1 is given below to clarify its use (see shaded cells). For instance, for Reactor emptying and cleaning (Operation 6), subscript i (1–8) in the Rij index is 6.
Wastewater is generated in this operation, which implies that subscript j (1–7) in Rij is 1. Wastewater
frequency is weekly, and according to Table 2 criteria, a value of 6 can be assigned to Parameter A. Considering that it is an aqueous solution in contact with non-hazardous products, a value of 3 is assigned to parameter B, according to Table 3 criteria. Finally, the amount discharged is from 100 to 1000 L/year and a value of 4 is assigned to Parameter C, according to the criteria in Table 4. Thus, risk Rij (R61)
associated with Operation 6 and wastewater discharged has a value of 72 (product of AxBxC). Similarly, for the same operation (Operation 6), the risk for water consumption (Aspect 6) is R66, and the value for
Parameter A is 6 (weekly frequency). For Parameter B, the value is 2 (water consumption hazard). Finally, Parameter C is 2 (between 100 and 1000 L/year). Thus, R66 = 24. The rest of the risk indexes
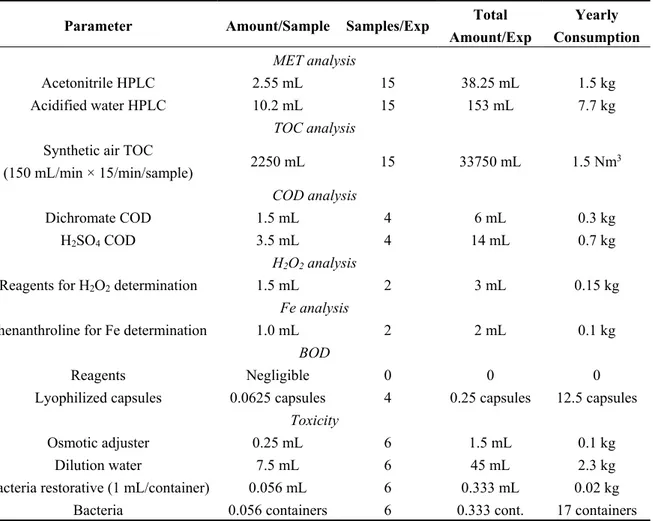
Table 7. Reagent consumption in the analysis of photocatalytic experiments for 50 experiments/year.
Parameter Amount/Sample Samples/Exp Total
Amount/Exp Yearly Consumption MET analysis Acetonitrile HPLC 2.55 mL 15 38.25 mL 1.5 kg Acidified water HPLC 10.2 mL 15 153.00 mL 7.7 kg TOC analysis
Synthetic air TOC
(150 mL/min × 15/min/sample) 2250 mL 15 33750 mL 1.5 Nm3 COD analysis Dichromate COD 1.5 mL 4 6 mL 0.3 kg H2SO4 COD 3.5 mL 4 14 mL 0.7 kg BOD Reagents Negligible 0 0
Lyophilized capsules 0.0625 capsules 4 0.25 12.5 capsules
Toxicity
Osmotic adjuster 0.25 mL 6 1.5 mL 0.1 kg
Dilution water 7.5 mL 6 45 mL 2.3 kg
Bacteria restorative (1 mL/container) 0.056 mL 6 0.333 mL 0.02 kg
Bacteria 0.056 containers 6 0.333 cont. 17 containers
Sampling
Filters for samples 1 filter 15 15 filters 750 filters
Except for acetonitrile (density = 786 kg/m3), solution density was considered to be 1000 kg/m3 because they
are very diluted aqueous solutions.
All the Rij values in Table 1 were calculated as described in the examples above. When they have all
been determined, the environmental risk index EOi associated with each operation, or the environmental risk index EAj associated with each environmental aspect, can be calculated. Thus, the second-last column in Table 1 shows the environmental risk associated with each operation EOi, calculated as the sum of the risks:
Oi n j ij E R =
= 1 (1)As an example, total risk EO6 associated with Operation 6 can be calculated as the sum of the risks associated with each aspect:
162 60 24 0 0 0 6 72 67 66 65 64 63 62 61 1 6 6 = + + + + + + = + + + + + + = = =
= R R R R R R R R E E n j j O Oi (2)Figure 1. Evaluation of Environmental Risk Index: Schematic view.
The last row in Table 1 shows the environmental risk associated with each environmental aspect EAi, calculated as the sum of the risks for all the operations included in the process:
Aj n i ij E R =
= 1 (3)For example, for wastewater (see Environmental Aspect 1), the EAi is:
258 6 0 72 180 0 0 0 0 81 71 61 51 41 31 21 11 1 1 1 = + + + + + + + = + + + + + + + = = =
= R R R R R R R R R E E n i i A Aj (4)The Global Environmental Risk Index (E) for this process is the sum of the EOi or EAj values. This index appears in the second-to-the-last cell (bottom-right) in Table 1:
= = = = n j Aj m i Oi E E E 1 1 (5)Applying all of this to the values in Table 1 results in:
746 7 1 162 462 12 66 12 24 8 7 6 5 4 3 2 1 1 = + + + + + + + = + + + + + + + = =
= O O O O O O O O m i Oi E E E E E E E E E E (6) Or 746 210 48 132 0 72 26 258 7 6 5 4 3 2 1 1 = + + + + + + = + + + + + + = =
= A A A A A A A n j Aj E E E E E E E E E (7)An interesting index is the percentage of risk for the maximum possible (%EOi,max). The maximum Rij possible for each of the first five aspects (wastewater, solid wastes, air emission, soil pollution, raw
materials consumption), is 1000, which is the product of the maximums possible for A, B and C, according to Tables 2–4. For water consumption, the maximum possible is 200 and for energy consumption the maximum is 500. Thus, the EOi maximum for any operation is 5700. Dividing 5700 by the EOi for each operation and multiplying by 100, %EOi,max can be found for each operation (see the last column of Table 1).
Similar reasoning follows for EAi,max. Thus, the maximum EAi for each aspect is 8000 for the first five aspects (wastewater, solid waste, air emission, soil pollution, raw materials consumption), that is, 1000 for each aspect (10 for frequency, 10 for hazard and 10 for the amount) multiplied by the eight operations in our case. EAi,max is EAi × (100/8000). The maximum of EAi for water consumption is 1600. Thus, EAi,max for water consumption is 3.0%. For energy consumption, the maximum is 4000 and EAi,max is 5.25.
The environmental risk indexes can be found the same way for photo-Fenton MET treatment in a Solarbox. As in photocatalysis, first you need to know the electricity and raw materials consumed. The electricity consumption data are the same as for the photocatalytic experiments and the only change is the time needed for each experiment, which in this case is 3.5 h. Thus, the total consumption of electricity by year, corresponding to the experiments performed, is 288 kWh/y. The rest of the data are the same as in Table 5.
Data corresponding to reagent consumption appears in Table 8. Note that changes from Table 6 (photocatalysis) are TiO2 disappearance and FeSO4 and H2O2 appearance.
Table 8. Reagent consumption in photo-Fenton experiments with a 1-L reaction volume for 50 experiments/year. Reagents Concentration— Amount/Exp Total Amount Reagent/Exp. Yearly Consumption (Kg)
Metoprolol tartrate salt 50 mg/L 50 mg 0.003 FeSO4.7H2O (7 mg/L Fe) 7 mg/L 34.75 mg 0.002
H2O2 (100 mg/L) 100 mg/L 333.3 mg 0.017
Millipore Water 1.00 L 50
Neither reagents for analysis, nor filters for samples (Table 7) are needed in this case, while Fe and H2O2 analyses are. These changes from Table 7 (photocatalysis) are observed in Table 9 (photo-Fenton). The risk indexes for photo-Fenton experiments can be evaluated using the amounts shown in the tables above, similar to what was explained for photocatalysis. Results are presented in Table 10.
Comparisons can be made by taking the value found for each operation in each process. For the two processes studied (photocatalysis and photo-Fenton), the operations with the most risk are those related to analysis (Operation 5 in Table 1 and Operation 6 in Table 10) due to the use of highly hazardous reagents. In both cases, Operation 7, related to reactor emptying and cleaning, is the second most risky, which seems logical because wastewater generated may contain hazardous products. Finally, the third position in this virtual ranking of environmental risk of operations is running the experiment (Operation 3 in Table 1 and Operation 4 in Table 10). For the seven aspects analysed in each operation, photo-Fenton values are usually higher. There are two reasons for that, the number of operations involved is higher and the products used in photo-Fenton are more hazardous than those used in photocatalysis.
Table 9. Reagent consumption in photo-Fenton experiment analyses for 50 experiments/year.
Parameter Amount/Sample Samples/Exp Total Amount/Exp Yearly Consumption MET analysis Acetonitrile HPLC 2.55 mL 15 38.25 mL 1.5 kg Acidified water HPLC 10.2 mL 15 153 mL 7.7 kg TOC analysis
Synthetic air TOC
(150 mL/min × 15/min/sample) 2250 mL 15 33750 mL 1.5 Nm 3 COD analysis Dichromate COD 1.5 mL 4 6 mL 0.3 kg H2SO4 COD 3.5 mL 4 14 mL 0.7 kg H2O2 analysis
Reagents for H2O2 determination 1.5 mL 2 3 mL 0.15 kg
Fe analysis
Phenanthroline for Fe determination 1.0 mL 2 2 mL 0.1 kg
BOD
Reagents Negligible 0 0 0
Lyophilized capsules 0.0625 capsules 4 0.25 capsules 12.5 capsules
Toxicity
Osmotic adjuster 0.25 mL 6 1.5 mL 0.1 kg Dilution water 7.5 mL 6 45 mL 2.3 kg Bacteria restorative (1 mL/container) 0.056 mL 6 0.333 mL 0.02 kg
Bacteria 0.056 containers 6 0.333 cont. 17 containers Except for acetonitrile (density = 786 kg/m3), solution density is considered to be 1000 kg/m3 because they are
very diluted aqueous solutions.
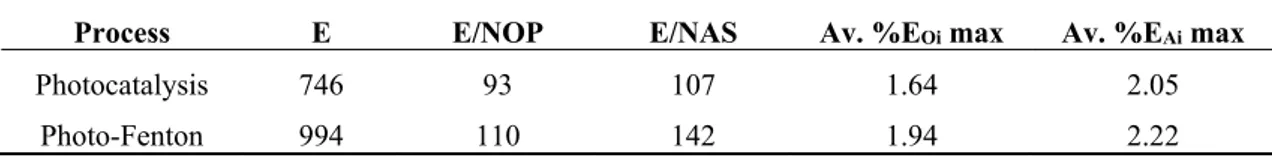
Of course, when comparisons are made, it has to be taken into account that the absolute values of E depend on the number of operations involved in the process, and it seems logical for E to increase when the number of operations is higher. Thus, from the results of Tables 1 and 10, photo-Fenton is more dangerous than photocatalysis because their risk indexes (E = EOi = EAj) are 994 and 746, respectively.
However, the ratio of E to the number of operations (E/NOP) can be instructive with respect to process risk and a good parameter for processes comparison, because it represents an average. In addition, this ratio gives information on how hazardous process operations are. Of course, high E/NOP ratios imply more risky operations. The same may be said of the ratio of E to the number of aspects in the process (E/NAS). There are always seven aspects analysed in the process, as seen in Tables 1 and 10. Thus, an increase in the E/NAS ratio means that the process environmental hazard increases. The E/NOP and E/NAS ratios are the highest for photo-Fenton (see Table 11).
Table 10. Environmental Risk Identification and Evaluation. Process tested: photo-Fenton MET treatment in the solarbox.
Environmental Aspects
Pollution Consumption
1. Waste water 2. Solid Wastes 3. Air Emission
4. Soil Pollution
5. Raw
Materials 6. Water 7. Energy
A B C Rij A B C Rij A B C Rij A B C Rij A B C Rij A B C Rij A B C Rij EOi %EOi,max
Operation
Normal Operation
1. Preparation of MET solution MET powders MET Water
6 1 1 6 6 1 1 6 6 2 1 12 24 0.42 2. FeSO4 addition FeSO4 6 5 1 30 30 0.53 3. H2O2 addition H2O2 6 10 1 60 60 1.05 4. Experiment Development
Gloves Electricity for lamp,
pumps, stirrer 6 1 1 6 6 5 2 60 66 1.16 5. Sampling 0 0 6. Analysis Aqueous solution
with organics Air TOC Reagents
Water for preparation
Electricity for equipment
6 10 3 180 6 5 2 60 6 10 2 120 6 2 1 12 6 5 3 90 462 8.11
7. Reactor emptying and cleaning
Aqueous solution
with organics Adsorbent paper
Water for cleaning
Electricity for pump, stirrer
6 10 4 240 6 1 1 6 6 2 2 24 6 5 2 60 330 5.79
Abnormal Operation
8. Disassembly of experimental equipment for maintenance
Crashing of reactor
1 1 1 1 1 0.02
Emergency Operation
9. Tank or reactor breakdown and/or solvent spillage
Aqueous solution
with organics Adsorbent material
1 10 2 20 1 1 1 1 21 0.37
EAi 440 14 66 0 216 48 210 E = 994 -
Table 11. Summarized final basic parameters for the environmental comparison of the processes.
Process E E/NOP E/NAS Av. %EOi max Av. %EAi max
Photocatalysis 746 93 107 1.64 2.05 Photo-Fenton 994 110 142 1.94 2.22
Another parameter that can give an idea of the risk involved in the tested process is the percentage with respect to the maximum possible to be achieved for each operation and aspect (see last row and last column in Tables 1 and 10). The averages are presented in Table 11, for both items and processes. The first comment to be made is that in all cases the values are very low. This means that the hazard levels of the processes analysed are very low.
3. Experimental Section
The processes in the study are well known and have been previously described elsewhere [16–18]. However, a short description is presented here to make it easier for the reader to understand. Metoprolol tartrate salt (MET) (a model pollutant) was treated with photo-Fenton or photocatalysis with TiO2 in a solarbox, as described previously [17].
Experiments were carried out in a solarbox (from CO.FO.ME.GRA) with an Xe lamp (1000 W). The solution to be treated was prepared in a feed tank (1 L) and pumped into a tubular reactor located at the bottom of the solarbox in the axis of a parabolic mirror. From there, the suspension was continuously recirculated to the feed tank. The feed tank was continuously stirred and the temperature was kept constant using a thermostatic bath. The experimental devices used are described at length elsewhere [16–18].
The parameters and variables monitored and analysed during the experiments were: MET concentration, TOC, COD, BOD, toxicity, etc. (see Tables 7 and 9).
MET removal was the same in both processes, but was degraded much faster by photo-Fenton than by photocatalysis (70 min and 180 min, respectively, for 90% MET removal), for experiments done with the same experimental equipment and under the same conditions. However, mineralisation was very similar in both processes. On the other hand, photocatalysis proved to be more energy efficient (mg of MET removal/kJ of useful light) than photo-Fenton. A detailed comparison of these two technologies for MET removal is available in a previous paper [17].
4. Conclusions
Several indexes have been estimated: absolute Environmental Risk Index (EOi) associated with each of the unit operations involved in the process, absolute Environmental Risk Index (EAj) related to the conditions of process running, and Global Environmental Risk Index (E) of the process studied. In addition, E/NOP and E/NAS relative indexes for evaluating the risk of each operation or aspect involved in the processes have been proposed. With these indexes, operations and processes, etc., may be compared to find the one that is environmentally best. This procedure was developed for lab scale, but its results could be used for plant design or operation, simply by entering data from large AOP wastewater treatment plants. It is important to highlight that the key point of the procedure is the correct selection of operations involved in each process to be analysed.
It should also be mentioned that the lab-scale operations with the highest risk are the analytical protocols (reinforcing the idea of further R&D on these protocols, especially when applied to evaluate processes for improving environmental protection). In our case, photocatalysis seems to involve less environmental risk than photo-Fenton.
Acknowledgments
The authors thank the Ministry of Science and Innovation of Spain (projects CTQ2011-26258 and NOVEDAR 2010 CSD2007-00055) and AGAUR—Generalitat de Catalunya (project 2009SGR 1466) for the financial support.
Author Contributions
All the authors discussed and planned the paper. Jaime Giménez wrote the first draft version, and Jaime Giménez, Bernardí Bayarri, Óscar González, Sixto Malato, José Peral and Santiago Esplugas made their comments, modifications, and suggestions to this first draft. Thus work on this paper was really shared by all authors.
Conflicts of Interest
The authors declare that there is no conflict of interest.
References and Notes
1. ISO 14001:2004: Environmental Management Systems—Requirements with Guidance for Use. 2. EMAS: Regulation (EC) No 1221/2009 of the European Parliament and of the Council of 25
November 2009 on the voluntary participation by organisations in a Community eco-management and audit scheme (EMAS), repealing Regulation (EC) No 761/2001 and Commission Decisions 2001/681/EC and 2006/193/EC.
3. Guinée, J.B.; Gorrée, M; Heijungs, R. LCA—An Operational Guide to the ISO-Standards—Part
2a: Guide; CML: Leiden, The Netherlands, 2001.
4. Guinée, J.B. Gorrée, M; Heijungs, R. LCA—An Operational Guide to the ISO-Standards—Part 2b: Operational Annex; CML: Leiden, The Netherlands, 2001.
5. Goedkoop, M.; Spriensma, R. The Eco-Indicator 99: A damage Oriented Method for Life Cycle Impact Assessment. Methodology Report; PRé Consultants: Amersfoort, The Netherlands, 2001. 6. Goedkoop, M.; Spriensma, R. The Eco-Indicator 99: A Damage Oriented Method for Life Cycle
Impact Assessment. Methodology Annex; PRé Consultants: Amersfoort, The Netherlands, 2001. 7. Directive 96/82/EC, of 9 December 1996, on the control of major-accident hazards involving
dangerous substances.
8. Directive 2012/18/EU of the European Parliament and of the Council, of 4 July 2012, on the control of major-accident hazards involving dangerous substances, amending and subsequently repealing Council Directive 96/82/EC.
9. Directive 2004/35/CE, of 21 April 2004, on environmental liability with regard to the prevention and remedying of environmental damage.
10. Arteche, F.; Avellaneda, A.; Ferrer-Vidal, V.; Hernández, L.; Masip, J.M. Guía Para la
Implantación y Desarrollo de un Sistema de Gestión Medioambiental; Generalitat de Catalunya;
Departament de Medi Ambient: Barcelona, Spain, 1997.
11. Giménez, J.; Bayarri, B.; Latorre, M.; Illana, E.; Carreira, E.; Contreras, S.; Esplugas, S. Integration of quality, environment, safety and health management systems in AOPs laboratories. In Proceedings of the 4th European Meeting on Solar Chemistry and Photocatalysis: Environmental Applications, Las Palmas de Gran Canaria, Spain, 8–10 November 2006.
12. Corcoran, J.; Winter, M.J.; Tyler, C.R. Pharmaceuticals in the aquatic environment: A critical review of the evidence for health effects in fish. Crit. Rev. Toxicol. 2010, 40, 287–304.
13. Regulation (EC) No 1272/2008 of the European Parliament and of the Council of 16 December 2008 on classification, labelling and packaging of substances and mixtures, amending and repealing Directives 67/548/EEC and 1999/45/EC, and amending Regulation (EC) No 1907/2006.
14. 2000/532/EC: Commission Decision of 3 May 2000 replacing Decision 94/3/EC establishing a list of wastes pursuant to Article 1(a) of Council Directive 75/442/EEC on waste and Council Decision 94/904/EC establishing a list of hazardous waste pursuant to Article 1(4) of Council Directive 91/689/EEC on hazardous waste (notified under document number C(2000) 1147).
15. Ley 22/2011, de 28 de julio, de residuos y suelos contaminados. Transposition of Directive 2008/98/EC of the European Parliament and of the Council of 19 November 2008 on waste and repealing certain Directives.
16. De la Cruz, N.; Dantas, R.F.; Giménez, J.; Esplugas, S. Photolysis and TiO2 photocatalysis of the pharmaceutical propranolol: Solar and artificial light. Appl. Catal. B—Environ. 2013, 130–131, 249–256.
17. Romero, V.; González, O.; Bayarri, B.; Marco, P.; Giménez, J.; Esplugas, S. Performance of different advanced oxidation Technologies for the abatement of the beta-blocker metoprolol.
Catal. Today 2015, 240, 86–92.
18. Romero, V.; Méndez-Arriaga, F.; Marco, P.; Giménez, J.; Esplugas, S. Comparing the photocatalytic oxidation of Metoprolol in a solarbox and a solar pilot plant reactor. Chem. Eng. J. 2014, 254, 17–29.
Sample Availability: Not available.
© 2014 by the authors; licensee MDPI, Basel, Switzerland. This article is an open access article distributed under the terms and conditions of the Creative Commons Attribution license (http://creativecommons.org/licenses/by/4.0/).