Research Article
A Quantitative Method for the Characterization of Lytic
Metastases of the Bone from Radiographic Images
Alicia Baltasar Sánchez and Angel Gonzalez Sistal
Medical Imaging Research Laboratory, Department of Physiological Sciences II, Faculty of Medicine, University of Barcelona, C/ Feixa Llarga s/n Pavell´o de Govern, Lab. 41.57, Hospitalet de Llobregat, 08907 Barcelona, Spain
Correspondence should be addressed to Angel Gonzalez Sistal; [email protected] Received 19 February 2014; Accepted 27 May 2014; Published 25 June 2014
Academic Editor: Cristiana Corsi
Copyright © 2014 A. Baltasar S´anchez and A. Gonzalez Sistal. This is an open access article distributed under the Creative Commons Attribution License, which permits unrestricted use, distribution, and reproduction in any medium, provided the original work is properly cited.
The aim of our study was to assess the diagnostic usefulness of the gray level parameters to distinguish osteolytic lesions using radiological images. Materials and Methods. A retrospective study was carried out. A total of 76 skeletal radiographs of osteolytic metastases and 67 radiographs of multiple myeloma were used. The cases were classified into nonflat (MM1 and OL1) and flat bones (MM2 and OL2). These radiological images were analyzed by using a computerized method. The parameters calculated were mean, standard deviation, and coefficient of variation (MGL, SDGL, and CVGL) based on gray level histogram analysis of a region-of-interest. Diagnostic utility was quantified by measurement of parameters on osteolytic metastases and multiple myeloma, yielding quantification of area under the receiver operating characteristic (ROC) curve (AUC). Results. Flat bone groups (MM2 and OL2) showed significant differences in mean values of MGL (𝑃 = 0.048) and SDGL (𝑃 = 0.003). Their corresponding values of AUC were 0.758 for MGL and 0.883 for SDGL in flat bones. In nonflat bones these gray level parameters do not show diagnostic ability. Conclusion. The gray level parameters MGL and SDGL show a good discriminatory diagnostic ability to distinguish between multiple myeloma and lytic metastases in flat bones.
1. Introduction
One of the most important first steps when evaluating a lytic bone lesion is to know the age of the patient. Some of the lytic lesions that are largely confined to certain age groups are multiple myeloma and osteolytic metastases in the middle-aged and elderly.
Multiple myeloma is a malignant tumour of plasma cells that causes widespread lytic bone damage. It is the most common primary tumour of bone and is found in the spine, skull, ribs, sternum, and pelvis but may affect any bone with hematopoietic red marrow. The average patient age is over fifty years and the male-to-female ratio is 3 : 2. The diagnosis is based on laboratory parameters in combination with bone marrow biopsy or aspiration. The radiological appearance of multiple myeloma is characterized by irregular lytic defects of different sizes. These lytic areas are often described as
“punched out” and have no periosteal reaction [1]. Moreover, it is not easy to distinguish between multiple myeloma bone disease and lytic bone metastases on plain film. In staging, treatment evaluation, and prognosis of patients with multiple myeloma, detection of lytic bone lesions has critical value. Although, new imaging techniques have been introduced to assess the extent and severity of multiple myeloma, most institutions still use radiograph as a complementary technique to evaluate disease stage (progression and therapy response) [2].
Metastatic cancer is the most common malignant sec-ondary bone tumour. Skeletal metastases are classified according to their radiologic appearance as osteolytic, mixed, or osteoblastic. Cancers that are most likely to metastasize to bone are breast, lung, prostate, thyroid, and kidney. The aver-age patient aver-age is over forty years. The distribution of skeletal metastases in adults is very similar to that of hematopoietic
Volume 2014, Article ID 264836, 5 pages http://dx.doi.org/10.1155/2014/264836
red marrow, which coincides with the trabecular and flat bones [3]. Thus, the typical radiological imaging of a lytic metastasis appears as an area of loss of mineral bone density. Diagnosis and classification of these bone lesions are commonly made by a variety of imaging modalities, includ-ing plain radiography (XR), skeletal scintigraphy (SS), com-puted tomography (CT), magnetic resonance imaging (MRI), and positron emission tomography (PET) [3,4].
X-ray is the first imaging study undertaken to detect lytic metastases and myeloma-caused bone damage to demon-strate loss or thinning of bone (osteoporosis or osteopenia), holes in bone (lytic lesions), and/or fractures. Despite low cost and wide availability, X-rays have an important limitation: 30% of the bone must be missing before damage can be revealed.
The lytic bone disease in multiple myeloma differs from that in other cancer patients who have lytic bone metastases. Although increased osteoclastic bone destruction is involved in multiple myeloma in contrast to osteolytic metastases, once the multiple myeloma tumour burden exceeds 50% in a local area, osteoclast activity is either suppressed or absent [5].
The aim of our study was to assess the diagnostic useful-ness of the gray level parameters to distinguish between oste-olytic metastases and multiple myeloma from radiographic images.
2. Materials and Methods
2.1. Imaging Database. The data collection was scheduled
in two separate cycles. In the first cycle a set of 76 antero-posterior radiographs with confirmed osteolytic metastases (OL) as determined from 99mTc-bone scintigraphy and
18F-FDG PET examinations were included in this study.
Patients presented antecedent of adenocarcinoma of the lung with evidence of distant metastases (M1) and no prior treatment was studied. Their mean age was 61 years (range 43–81 years, 18 males and 27 females). In the second cycle a total of 67 anteroposterior radiographs with confirmed multiple myeloma (MM) as determined from18F-FDG PET examination and laboratory parameters were included too. The median age was 63 years (range 51–72 years, 17 males and 14 females).
Radiographs were performed with the following settings: 70–80 kVp, 100 cm focus to film distance, and use of a fast screen and film cassette (30 cm× 40 cm).
The Institutional Review Boards of the participating center approved this retrospective study. The radiological images used in this paper were obtained from the database of “Medical Imaging Research” Laboratory at the Department of Physiological Sciences II, Faculty of Medicine, University of Barcelona. Patient confidentiality was protected.
2.2. Methods. In an earlier work, an image processing and
analysis method was introduced in order to characterize skeletal digitized radiographs. Hence, by means of gray level parameters on digitized radiographs we classified healthy bone according to histological and anatomical features. So,
we reported an optimized healthy bone classification into two groups: flat or nonflat bones (trabecular, cortical) [6].
The images were processed and characterized with a com-puterized method developed by our group in an earlier work [6–8]. The workflow of image processing analysis includes the following steps: (1) image acquisition, (2) selection of a region of interest (ROI), (3) filtering for noise reduction, (4) gray level histogram (parameters output), and (5) statistical analysis to distinguish between groups.
The radiographs were digitized by using a laser scanner (KFDR-S; Konica, Tokyo, Japan) with a 0.175 mm pixel size, a matrix size of 2,048× 2,048, and 12-bit gray-scale levels. Digitizer performance was evaluated employing a quality control protocol [5].
The images were processed using ImageJ software (NIH image program). The cases were obtained from region of interests of 40 × 50 pixels outlined manually on each radiograph. Only one ROI from each radiograph was used. They were classified into two groups, flat or nonflat bones, according to histological and anatomical bone features [6]. The final set contained 67 ROIs from multiple myeloma bone disease (flat bone: 36; nonflat bone: 31) and 45 ROIs from osteolytic metastases (flat bone: 41; nonflat bone: 35).
Due to the presence of intensity inhomogeneities and noise on radiographs inherent to imaging process, the ROI was subjected to an anisotropic diffusion filter [9,10] which smoothed out the noise and preserved the edge and contrast associated with bone structure at the same time.
The parameters calculated from radiographs were based on the gray level histogram analysis of ROI (see Figure 1): mean gray level (MGL), standard deviation gray level (SDGL), and coefficient of variation (CVGL). The mean gray level is defined as the value given by the average of gray level of each ROI pixel. MGL provides 4096 gray levels because we use images of 12 bit grayscale (0–4096, where 0 is equivalent to black and 4096 to white). The standard deviation gray level of ROI pixel calculates the dispersion of gray values from the average (MGL). SDGL can be expressed in relation to MGL as a coefficient of variation (in %) and is expressed as CVGL= (SDGL/MGL) ⋅ 100.
2.3. Statistical Analysis. The data were analyzed using SPSS
16.0 (SPSS, Inc., Chicago, IL). Standard descriptive summary statistics was used to show overall trends in data. The data comparison among bone groups was implemented using Student’s paired 𝑡-test. Nonparametric estimation of areas under ROC curve (AUC) was carried out to assess the diag-nostic ability of each parameter considered (MGL, SDGL, and CVGL) in multiple myeloma bone disease and osteolytic metastases. Significance was considered to be reached at 𝑃 < 0.05.
3. Results
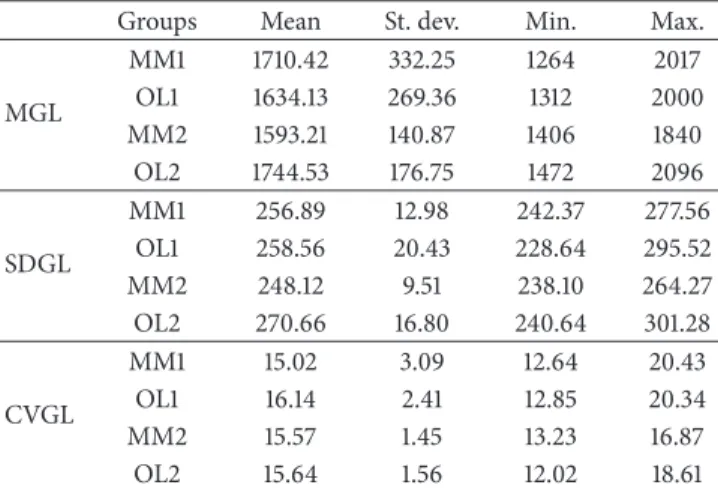
Table 1 shows the descriptive statistics for mean gray level, standard deviation gray level, and coefficient of variation gray level parameters for the groups: osteolytic metastases (nonflat bone: OL1; flat bone: OL2) and multiple myeloma (nonflat
1000 0 0 4096 Pi xel s Gray level 1000 0 0 4096 Pi xel s Gray level
Figure 1: Two zooms of different plain radiographs showing osteolytic regions of interest (ROI). Gray level histogram for the outlined ROI is shown on the right side for each case. (a) Multiple myeloma (case 3, skull); (b) lytic metastasis (case 7, skull).
Table 1: Descriptive statistics for the three parameters studied: mean (MGL), standard deviation (SDGL), and coefficient of variation (CVGL) of gray level.
Groups Mean St. dev. Min. Max.
MGL MM1 1710.42 332.25 1264 2017 OL1 1634.13 269.36 1312 2000 MM2 1593.21 140.87 1406 1840 OL2 1744.53 176.75 1472 2096 SDGL MM1 256.89 12.98 242.37 277.56 OL1 258.56 20.43 228.64 295.52 MM2 248.12 9.51 238.10 264.27 OL2 270.66 16.80 240.64 301.28 CVGL MM1 15.02 3.09 12.64 20.43 OL1 16.14 2.41 12.85 20.34 MM2 15.57 1.45 13.23 16.87 OL2 15.64 1.56 12.02 18.61
Note. Multiple myeloma: MM1 (nonflat bone) and MM2 (flat bone);
oste-olytic metastases: OL1 (nonflat bone) and OL2 (flat bone).
bone: MM1; flat bone: MM2). When comparing the gray level parameters between nonflat bone groups (MM1 and OL1) there were no significant differences. In contrast, flat bone groups (MM2 and OL2) showed significant differences in mean values of MGL (𝑃 = 0.048) and SDGL (𝑃 = 0.003).
Table 2: AUC values of the ROC curve for the three parameters (mean (MGL), standard deviation (SDGL), and coefficient of vari-ation (CVGL) of gray level) considered and their corresponding significance. Null hypothesis tested (AUC = 0.5) corresponds to a null diagnostic value to differentiate between multiple myeloma and osteolytic metastases groups.
AUC values Groups MGL SDGL CVGL MM1—OL1 0.420 (𝑃 = 0.60) (𝑃 = 0.83)0.467 (𝑃 = 0.52)0.600 MM2—OL2 0.758 (𝑃 = 0.048) (𝑃 = 0.003)0.883 (𝑃 = 0.89)0.483
Note. Multiple myeloma: MM1 (nonflat bone) and MM2 (flat bone);
oste-olytic metastases: OL1 (nonflat bone) and OL2 (flat bone). AUC: the area under the ROC curve.
Table 2 shows the AUC values for the groups studied. There were significant values of AUC when comparing flat bone groups of multiple myeloma and osteolytic metastases (MM2 and OL2) for the MGL and SDGL parameters (AUC values: MGL = 0.758; SDGL = 0.883). These results are illustrated inFigure 2: AUC values correspond to the ROC curve when comparing gray level parameters for flat bone groups. Nevertheless, when comparing nonflat bone groups
1.0 0.8 0.6 0.4 0.2 0.0 Se ns itiv ity 1 − specificity MGL SDGL CVGLReference line 1.0 0.8 0.6 0.4 0.2 0.0
Figure 2: ROC curve for the three parameters considered (mean (MGL), standard deviation (SDGL), and coefficient of variation of gray level (CVGL)) when comparing flat bone groups (multiple myeloma MM2 versus osteolytic metastases OL2).
(MM1 and OL1) there were no significant values of AUC for gray level parameters.
4. Discussion
This study seeks to evaluate the diagnostic accuracy of gray level parameters to distinguish osteolytic lesions from two different pathologies (metastases and multiple myeloma) using radiographs.
As for nonflat bones, gray level parameters were not able to distinguish between multiple myeloma and osteolytic metastases groups.
As regards flat bones, multiple myeloma had gray levels lower than those of lytic metastases for MGL and SDGL parameters (𝑃 = 0.048 and 𝑃 = 0.003, resp.). In contrast, the CVGL parameter was not able to distinguish between these groups (𝑃 = 0.89). When comparing multiple myeloma and osteolytic metastases, SDGL proved to have the best discriminatory ability (AUC = 0.883) and MGL a good discriminatory ability (AUC = 0.758). This is important for establishing the differential diagnosis in the two groups because the distribution of skeletal metastases and multiple myeloma bone disease is closely related to the location of the flat bones (e.g., skull, ribs, sternum, and pelvis). Histologically flat bone is made up of the two cortical thin sheets, involving a small proportion of trabecular tissue (diploe: soft spongy material containing bone marrow). The finding that myeloma lesions in flat bones appear to manifest lower gray level values might be explained as follows: in multiple myeloma,
osteoclasts accumulate only at bone resorbing surfaces adja-cent to myeloma cells; their levels are not increased in areas uninvolved with tumor. In addition to the increase in bone resorption, bone formation is suppressed so that bone lesions in patients with myeloma become purely lytic (there is no osteoblastic response). In osteolytic metastases, the mecha-nisms responsible for tumor growth in bone are complex and involve tumor stimulation of the osteoclast and the osteoblast as well as the response of the bone microenvironment [11].
There are currently different imaging modalities (plain radiography, skeletal scintigraphy, computed tomography, magnetic resonance imaging, and positron emission tomog-raphy) to diagnose multiple myeloma bone disease or lytic metastases. An accurate assessment of the response of both pathologies to treatment requires the structural changes in the bone to be visualized. In this regard, each of the aforementioned imaging techniques has its pros and cons [12–15]. Nowadays, the baseline diagnosis evaluation to detect lytic bone lesions comprises conventional radiography too [6,
9,10,15]. Early identification of direct anatomic visualization of the bone or tumor could lead to changes in patient management and quality of life. Although bone metastases can be treated, their response to treatment is considered “unmeasurable,” which excludes patients with cancer and bone metastatic disease from participating in clinical trials of new treatments [14]. Radiography is commonly used to evaluate symptomatic sites and is a useful complement to scintigraphy for clarifying nonspecific or atypical findings or for following up cases in which clinical findings indicate bone pain but where scintigraphy findings are negative.
The accurate detection of lytic bone lesions should improve by quantifying these lesions, thereby paving the way for computerized methods that would enable us to quantify the selected regions in order to reduce subjectivity in the interpretation of the image, calculate the ideal parameters, define patterns of normality, and determine the pathology by evaluating deviations of these indexes. Moreover, this digital method can be useful to study the evolution of these lytic bone lesions under treatment, to recognize new lesions, and to differentiate it from previous lesions.
The advantages of this methodology are its wide diffusion, low cost, and improved patient comfort.
This methodology could be applied to questions of clini-cal relevance. For example, bisphosphonates are administered as a preventive treatment of bone complications encountered in multiple myeloma and osteolytic metastases. However, in recent years a relationship has been established between these drugs and a new bone injury: jaw osteonecrosis [11]. This lesion is characterized by avascular necrosis of bone that was isolated from the jaws. This methodology offers the possibility of studying radiological manifestations of this disease.
This study determined preliminary results about the role of gray level image parameters on digitized radiograph in quantifying and differentiating the two bone diseases. Consequently, our results demonstrate that gray level param-eters quantify multiple myeloma and lytic metastases bone lesions in flat bones accurately. This can be helpful as a complementary method for differential diagnosis. Most cases (80–90% approximately) of bone metastases and multiple
myeloma bone lesions are located in the axial skeleton (spine, ribs, skull, femur, and pelvis), which are mainly flat bones.
In conclusion, the gray level parameters MGL and SDGL show a good discriminatory diagnostic ability to distinguish between multiple myeloma and lytic metastases in flat bones (AUC= 0.758 and 0.883, resp.).
Conflict of Interests
The authors declare that there is no conflict of interests regarding the publication of this paper.
References
[1] S. V. Rajkumar and R. A. Kyle, “Multiple myeloma: diagnosis and treatment,” Mayo Clinic Proceedings, vol. 80, no. 10, pp. 1371– 1382, 2005.
[2] S. L¨utje, J. W. J. Rooy, S. Croockewit, E. Koedam, W. J. G. Oyen, and R. A. Raymakers, “Role of radiography, MRI and FDG-PET/CT in diagnosing, staging and therapeutical evaluation of patients with multiple myeloma,” Annals of Hematology, vol. 88, no. 12, pp. 1161–1168, 2009.
[3] L. D. Rybak and D. I. Rosenthal, “Radiological imaging for the diagnosis of bone metastases,” Quarterly Journal of Nuclear
Medicine, vol. 45, no. 1, pp. 53–64, 2001.
[4] T. Hamaoka, J. E. Madewell, D. A. Podoloff, G. N. Hortobagyi, and N. T. Ueno, “Bone imaging in metastatic breast cancer,”
Journal of Clinical Oncology, vol. 22, no. 14, pp. 2942–2953, 2004.
[5] G. D. Roodman, “Pathogenesis of myeloma bone disease,”
Leukemia, vol. 23, no. 3, pp. 435–441, 2009.
[6] A. Gonz´alez-Sistal and A. Baltasar S´anchez, “A complementary method for the detection of osteoblastic metastases on digitized radiographs,” Journal of Digital Imaging, vol. 19, no. 3, pp. 270– 275, 2006.
[7] A. Baltasar S´anchez and A. Gonz´alez-Sistal, “Design of a web-tool for diagnostic clinical trials handling medical imaging research,” Journal of Digital Imaging, vol. 24, no. 2, pp. 196–202, 2011.
[8] A. Baltasar S´anchez and A. Gonz´alez-Sistal, “Evaluation of osteolytic metastases and multiple myeloma skeletal lesions on digitized radiographs with gray level parameters,” Medical
Physics, vol. 37, no. 6, p. 3142, 2010.
[9] P. Perona and J. Malik, “Scale-space and edge detection using anisotropic diffusion,” IEEE Transactions on Pattern Analysis
and Machine Intelligence, vol. 12, no. 7, pp. 629–639, 1990.
[10] R. C. Gonzalez and R. E. Woods, Digital Image Processing, Prentice-Hall, Upper Saddle River, NJ, USA, 2008.
[11] L. Raffaelli, L. Scaramuzzo, P. Rossi Iommetti, C. Graci, G. Maccauro, and P. F. Manicone, “Jaw osteonecrosis related to bisphosphonate treatment of bone metastasis,” Journal of
Biological Regulators and Homeostatic Agents, vol. 24, no. 2, pp.
115–121, 2010.
[12] F. Dore, L. Filippi, M. Biasotto, S. Chiandussi, F. Cavalli, and R. Di Lenarda, “Bone scintigraphy and SPECT/CT of bisphosphonate-induced osteonecrosis of the jaw,” Journal of
Nuclear Medicine, vol. 50, no. 1, pp. 30–35, 2009.
[13] G. D. Roodman, “Mechanisms of Bone Metastasis,” The New
England Journal of Medicine, vol. 350, no. 16, pp. 1655–1698,
2004.
[14] T. Hamaoka, C. M. Costelloe, J. E. Madewell et al., “Tumour response interpretation with new tumour response criteria vs the World Health Organisation criteria in patients with bone-only metastatic breast cancer,” British Journal of Cancer, vol. 102, no. 4, pp. 651–657, 2010.
[15] A. Gonz´alez-Sistal, A. Baltasar S´anchez, M. Herranz Carnero, and A. Ruibal Morell, “Advances in medical imaging applied to bone metastases,” in Medical Imaging, O. F. Erondu, Ed., chapter 16, InTech, 2011.