1
International PhD Program in Neuropharmacology
UNIVERSITY OF CATANIA
Salvatore Giunta
XXIV Cycle
Protective role of PACAP and VIP on Malignant
Peripheral Nerve Sheath Tumor (MPNST) cells
2
To Lord above who has guided my hands, my mind and my heart
3
Index
General introduction………... 7
PACAP and VIP affect NF1 expression in rat malignant peripheral nerve sheath tumor (MPNST) cells………... 13
Abstract………...……… 13
Introduction………..………... 15
Materials and methods…..……….. 18
Cell culture……….. 18
Analysis of mRNA expression by RT–PCR……….. 19
Real-time quantitative PCR analysis………... 20
Western blot analysis………... 22
Immunofluorescence analysis……….. 23
Statistical analysis………... 24
Results……….. 25
Analysis of NF1 mRNA expression in rat MPNST cells……….. 25
Serum-induced changes in NF1 mRNA expression………. 26
4
PACAP or VIP-induced changes in NF1 transcript levels…….. 29
PACAP or VIP-induced changes in neurofibromin expression.. 30
Neurofibromin fluorescence immunolabelling in PACAP/VIP-treated cells………. 32
Discussion……… 34
Conflict of interest……….….. 39
Acknowledgements………... 39
Involvement of PACAP/ADNP signaling in the resistance to cell death in malignant peripheral nerve sheath tumor (MPNST) cells... 40
Abstract... 40
Introduction... 42
Materials and Methods... 45
Cell culture... 45
Analysis of cell viability (MTT assay)………. 46
Analysis of mRNA expression by real-time quantitative RT-PCR... 46
Western blot analysis... 49
5
Statistical analysis………... 52
Results... 52
Time-dependent effect of serum starvation on ADNP expression in MPNST cells... 52
Dose-response effect of PACAP38 on ADNP expression in MPNST cells cultured in presence or absence of serum... 54
Involvement of PAC1/VPAC receptors on ADNP expression profile in MPNST cells... 57
PAC1, VPAC2 receptors and PACAP peptide mRNA levels in MPNST cells... 59
Dose-response effect of H2O2 treatment on cell viability in normally cultured and serum starved MPNST cells... 62
Effect of PACAP38 on ADNP expression and MPNST cell survival against H2O2-induced cell death... 64
Discussion... 68
Acknowledgements... 73
General discussion... 75
6
7
General introduction
Malignant peripheral nerve sheath tumours (MPNSTs) are the most common malignancy that may occur in patients affected by Neurofibromatosis type I, an inherited neurogenetic disorder caused by mutations within NF1 gene. This pathology is characterized by several features which include dermal and plexiform neurofibromas, Lisch nodules and café-au-lait spots (Friedman et al., 1999). MPNSTs are highly aggressive sarcomas that develop from plexiform neurofibromas and strong evidence show that Schwann cells are the primary neoplastic cell type. This malignant neoplastic progression occurs when Schwann cells lost their remaining functional NF1 gene and initiates a complex series of interactions with other cell types. Such interactions may be influenced by aberrant expression of growth factors and/or relative receptors.
The protein product of the Neurofibromatosis type 1 (NF1) gene is a cytoplasmic protein called Neurofibromin. Neurofibromin contains a central domain that shares extensive sequence homology with other GTPase-activating-protein (GAPs) which function as negative regulators of Ras (DeClue et al., 1991). Ras is a small GTPase which plays a
8
central role in cell survival, proliferation and differentiation by transducing responses to growth stimuli initiated at the cellular surface to several intracellular signalling molecules (Parada, 2000). In addition to its role in the regulation of Ras activity via its GAP-related domain, different finding indicated that Neurofibromin may also exert tumor suppression by conferring sensitivity to apoptosis (Shapira et al., 2007). MPNSTs, similarly to other high-grade glial tumors, are usually associated with poor prognosis because they form secondary metastatic sites in the lungs, lymph nodes, and liver but also because cancer cells are able to adapt to environmental changes like nutritional deficiency, hypoxia and oxidative stress. It is thus important to characterize which signaling cascades are involved, as therapies directed to weaknesses these adaptive mechanisms may render these neoplastic cells more vulnerable to death.
Our research group had previously evaluated the protective role of Pituitary Adenylate Cyclase-Activating Polypeptide (PACAP) and Vasoactive Intestinal Polypeptide (VIP) on MPNST cells undergoing cell death induced by serum starvation (Castorina et al., 2008). These peptides belong to a family of peptides which include secretine, glucagone and peptide histidine-isoleucine (PHI), all involved in the
9
modulation of numerous biological functions in various vertebrates (Dickson and Finlayson, 2009). PACAP exists in two biologically active forms, PACAP38 and the C-terminally truncated PACAP27, which has an amino acid sequence identity of 68% with VIP (Miyata et al., 1989, 1990). PACAP and VIP bind specific membrane receptors which are classified into two types: PAC1 type (including at least eight different splice variants) and VPAC type (including VPAC1 and VPAC2 subtypes). PAC1/VPAC receptors comprise seven transmembrane domains and are coupled to G-proteins (Zhou et al., 2002) which are associated with several transduction systems like adenylyl cyclase and phospholipase C (Arimura, 1998).
During my PhD we focused my studies on elucidating the molecular mechanisms by which PACAP and VIP protect MPNST cells from death in different in vitro models mimicking hostile tumor microenvironment
in vivo.
In the first study we hypothesized that the protective action exerted by PACAP and VIP on MPNST cells might be correlated to NF1 inhibition. Since tumor cells undergoing serum starvation in vitro, partially mimic nutritional deficiency conditions in vivo (Levin et al., 2010), we investigated the effects of either peptides treatment on NF1 expression
10
levels using culture medium containing both normal, low amounts or in total absence of serum.
Our results indicated that serum itself significantly influenced NF1 levels. In fact, the low NF1 expression of cells cultured in normal serum conditions were remarkably increased in cells switched to low- or no-serum. Treatment with PACAP or VIP did not affect NF1 expression when using normal amounts of serum, whereas it significantly inhibited transcript and protein levels both in low- or no-serum cultured cells suggesting that resistance to death against the lack of trophic support might involve PACAP- or VIP-induced NF1 downregulation.
In the second study we focused our research on another protein called Activity-dependent neuro-protective protein (ADNP). This peptide was first identified as a vasoactive intestinal peptide (VIP)-responsive gene (Bassan et al. 1999) but subsequently, it was found to be important for a variety of key cellular processes. ADNP mRNA is abundantly expressed in cancer tissues and increased expression has been associated with aggressive tumor growth. Zamostiano et al., (2001) demonstrated that ADNP downregulation by antisense oligodeoxynucleotides in cancer cells up-regulates p53 expression and reduces cell viability. Furthermore, converging evidence indicated that PACAP induce ADNP
11
expression in different types of glial cells (Zusev et al., 2004; Nakamachi et al., 2006). However, whether PACAP/ADNP signaling is involved in the resistance to cell death in MPNST cells remains to be clarified. To address this issue, we investigated the involvement of this signaling system in the survival response of MPNST cells against hostile environments. For this purpose, the aims of second study were: (1) evaluate how the lack of trophic support affected PACAP/ADNP signaling in MPNST cells and (2) establish whether this pathway is involved in the resistance of MPNST cells against oxidative stress-induced cell death. Therefore, cells in vitro were cultured either in the presence or absence of serum and exposed to H2O2 to mimic both the
lack of trophic support and oxidative insult in vivo. Our data demonstrate that exogenous PACAP38 stimulates ADNP expression in MPNST cells, which correlates to increased resistance to H2O2–induced cell death,
reduced p53 and caspase-3 activation, as well as decreased DNA fragmentation. In cells grown in the absence of serum cell resistance to oxidative damage was even more robust but not further ameliorated by PACAP38 treatment, suggesting that under conditions of nutritional deficiency, MPNST cells might adapt to the stressful environment by
12
activating an endogenous PACAP/ADNP signaling pathway that is involved in regulating overall cell resistance.
13
PACAP and VIP affect NF1 expression in rat malignant
peripheral nerve sheath tumor (MPNST) cells
Salvatore Giuntaa, b, Alessandro Castorina a, Alexander Adorno a, Venera Mazzone a, Maria Luisa Carnazza a, Velia D‟Agataa
a Department of Anatomy, Diagnostic Pathology, Legal Medicine,
Hygiene and Public Health, University of Catania, Catania, Italy
b Neuropharmacology PhD Program, University of Catania, Catania,
Italy
Abstract
In our previous study we have identified PACAP, VIP and their receptors in rat MPNST cells, thus showing anti-apoptotic roles. Recently it has been shown that the tumor suppressor neurofibromin, encoded by the Neurofibromatosis type I (NF1) gene, promotes MPNST cells sensitivity to apoptosis after serum withdrawal. In the present study we investigated whether PACAP or VIP negatively regulate NF1 expression under normal or serum-dependent pro-apoptotic culture conditions. Results indicated that serum itself significantly influenced
14
gene and protein levels. In fact, the low NF1 levels of cells cultured in normal serum-containing medium were remarkably increased in cells switched to low- or no-serum after 24h and 48h. Treatment with 100nM PACAP or VIP did not affect NF1 expression when using normal amounts of serum, whereas it significantly inhibited transcript and protein levels both in low- or no-serum cultured cells. In particular, PACAP reduced NF1 levels already after 24h in low-serum cultured cells, while VIP showed a similar effect only after serum deprivation. However, both PACAP and VIP downregulated gene and protein levels within 48h either in low-dose and serum starved cells. Results were confirmed by fluorescence microscopy, showing that 100nM PACAP or VIP attenuated neurofibromin cytoplasmic localization only in low- or no-serum cultured cells. The present study provides a comprehensive analysis of both neuropeptides effect on NF1 expression in normal, low- or serum-starved MPNST cells, ameliorating the hypothesis that resistance to apoptosis in serum-deprived cells might be correlated to PACAP- / VIP-induced NF1 inhibition.
Keywords: PACAP; VIP; Apoptosis; NF1; Neurofibromin; MPNST
15
Introduction
Pituitary Adenylate Cyclase-Activating Polypeptide (PACAP) and Vasoactive Intestinal Polypeptide (VIP) are structurally related neuropeptides belonging to a family of peptides which include secretine, glucagone and peptide histidine-isoleucine (PHI), all involved in the modulation of numerous biological functions in various vertebrates (Dickson et al. 2009). PACAP exists in two biologically active forms, PACAP38 and the C-terminally truncated PACAP27, which has an aminoacid sequence identity of 68% with VIP (Miyata et al., 1989, 1990).
PACAP and VIP bind to specific membrane receptors which are classified into two types: PAC1 type (including at least eight different splice variants) and VPAC type (including VPAC1 and VPAC2 subtypes). PAC1 receptors preferable bind PACAP, recognizing poorly VIP. VPAC type receptors recognize similarly and with high affinity both PACAP and VIP. PAC1/VPAC receptors comprise seven transmembrane domains and are coupled to G proteins (Zhou et al., 2002) which are associated with several transduction systems like adenylyl cyclase, phospholipase C (Arimura, 1998), Erk and MAPK pathways (Jamen et al., 2002).
16
PACAP, VIP and their receptors produce an extensive range of physiological effects. Different reports suggested that PACAP and VIP exert a multitude of effects on cardiovascular, circulatory and respiratory systems and on metabolic function (Dvoráková, 2005; Wilson and Cumming, 2008; Dickson and Finlayson, 2009) with a number of studies pointing to a plethora of putative roles in the nervous (Dickinson and Fleetwood-Walker, 1999; Harmar et al., 2002) and immune systems (Gomariz et al., 2001; Pozo and Delgado, 2004; Gonzalez-Rey et al., 2007). PAC1 and VPAC type receptors are involved in proliferation, differentiation and survival of normal and cancer cell lines (Jaworski, 2000; Reubi, 2000; Isobe et al., 2003). In addition, neuroprotective roles for PACAP and VIP have been proposed (Waschek, 1996; Lindholm et al., 1998). In fact, PACAP and/or VIP have been shown to stimulate neuronal survival directly and indirectly via the glial cell release of neurotrophic factors (Brenneman, 2007). Recently we have demonstrated the expression of PAC1 and VPAC type receptors in a rat MPNST cultured cell line and evaluated their trophic role (Castorina et al., 2008).
It is now generally accepted that Schwann cells represent the primary neoplastic cell type in neurofibromas. Forty to 80% of the cells in
17
neurofibromas are Schwann cells (Tucker and Friedman 2002). Neurofibromas develop in patients affected by Neurofibromatosis type I, the most common inherited cancer predisposition syndrome caused by mutations within the gene encoding the protein neurofibromin. Such neoplastic growth occurs when an unknown cell type in the Schwann cell lineage loses its remaining functional NF1 gene and initiates a complex series of interactions with other cell types; these interactions may be influenced by aberrant expression of growth factors and growth factor receptors (Carroll and Ratner, 2008). Neurofibromin contains a central domain (the NF1-GAP-related domain or NF1-GRD) that shares extensive sequence homology with other GAPs that regulate Ras (DeClue et al., 1991). Ras is a small GTPase which plays a central role in cell survival, proliferation and differentiation by transducing responses to growth stimuli initiated at the cellular surface to several intracellular signalling molecules (Parada, 2000). Neurofibromin acts as a GAP, which terminates Ras signalling. In addition to its role in controlling cell proliferation through the aforementioned mechanism, a pro-apoptotic role of neurofibromin has been proposed in mouse embryonic fibroblasts, suggesting that besides its Ras-dependent growth
18
inhibition, neurofibromin may exert tumor suppression by conferring sensitivity to apoptosis (Shapira et al., 2007).
In the present study we hypothesized that the apoptosis-preventing action exerted by PACAP and VIP on Schwann cells might be correlated to NF1 inhibition. To this end, we investigated the effects of either peptides treatment on gene and protein levels using culture medium containing both normal, low amounts or in total absence of fetal bovine serum to resemble normal or pro-apoptotic conditions.
Materials and methods
Cell culture
The study was carried out in rat MPNST cells (CRL-2768) obtained from American Type Culture Collection (Rockville, MD, USA). Cells were cultured in Dulbecco‟s modified Eagle‟s medium and supplemented with 10% of heat-inactivated fetal bovine serum (FBS), 2 mM l-glutamine, 100 U/ml penicillin, and 200-μg/ml streptomycin (Sigma–Aldrich, USA). Cells were incubated at 37 °C in a humidified atmosphere with 5% CO2. Once cells reached confluence, they were
19
switched to medium containing either 1% or in total absence of serum for 24 h or 48 h for subsequent testing.
Analysis of mRNA expression by RT–PCR
Total RNA extracts were isolated by 1 ml TRIzol reagent (Invitrogen) and 0.2 ml chloroform and precipitated with 0.5 ml isopropanol. Pellet was washed with 75% ethanol and air dried. Single stranded cDNAs were synthesized incubating total RNA (5 μg) with SuperScript III Rnase H-reverse transcriptase (200 U/μl) (Invitrogen); Oligo-(dT)20 primer (100 nM) (Invitrogen); 1 mM dNTP mix (Invitrogen), dithiothreitol (DTT, 0.1 M), Recombinant RNase-inhibitor (40U/ul) at 42 °C for 1 h in a final volume of 20 μl. Reaction was terminated by incubation of samples at 70 °C for 10 min. Aliquots of cDNA were amplified using specific primers matching the reported sequence of rattus norvegicus NF1 (Acc. # D45201.1). Oligonucleotide sequences and location of NF1 primers with respect to the initiation of translation were as follows: forward primer 5′-TTCGATACACTTGCGGAAAC-3′ (corresponding to bases 3710–3729); reverse primer 5′-CACATTGGCAAGAGCCATAG-3′ (corresponding to bases 3811– 3830). To control for the integrity of RNA and for differences
20
attributable to errors in experimental manipulation from tube to tube, primers for rattus norvegicus ribosomal protein S18 (Acc. # NM_213557.1) were used in a separate PCR. Oligonucleotide sequences and location were as follows: forward primer, 5′-CCTGCGAGTACTCAACACCA-3′ (corresponding to bases 81–100); reverse primer 3′-CTGCTTTCCTCAACACCACA-5′ (corresponding to bases 171–190) which generated a 110-bp cDNA fragment. Each PCR contained 0.4 μM specific primers, 200 μM dNTPs, 1.25 U AmpliTaq Gold DNA polymerase and GeneAmp buffer containing 2.5 mM MgCl2+ (Applied Biosystem). PCR was performed using the following three cycle programs: (i) denaturation of cDNA (1 cycle: 95 °C for 12 min); (ii) amplification (40 cycles: 95 °C for 30 s, 60 °C for 30 s, 72 °C for 45 s); and (iii) final extension (1 cycle: 72 °C for 7 min). Amplification products were separated by electrophoresis in a 1.8% agarose gel in 0.045 M Tris–borate/1 mM EDTA (TBE) buffer.
Real-time quantitative PCR analysis
Aliquots of cDNA (400 ng) from cells cultured using different amounts of serum (10%, 1% or no serum, respectively) or cells subsequently treated with 100 nM PACAP or VIP for 24 h and 48 h were amplified in
21
parallel reactions with external standards at known amounts (purified PCR products, ranging from 102 to 108 copies) using a specific primer pair recognizing NF1 mRNA. To control samples mRNA integrity, and any eventual error attributable to experimental mishandling, mRNA levels of S18 ribosomal subunit (reference gene) were measured in each amplification. Each PCR (final volume of 20 μL) contained 0.5 μM primers, 1.6 mM Mg2+, 1× Light Cycler-FastStart DNA Master SYBR Green I (Roche Diagnostic). Amplifications were performed using a Light Cycler 1.5 instrument (Roche Diagnostic) with the following program setting: (i) cDNA denaturation (1 cycle: 95 °C for 10 min); (ii) quantification (45 cycles: 95 °C for 10 s, 57 °C for 7 s, 72 °C for 5 s); (iii) melting curve analysis (1 cycle: 95 °C for 0 s, 65 °C for 15 s, 95 °C for 0 s); and (iv) cooling (1 cycle: 40 °C for 30 s). Each amplification was carried out in triplicates in three different experiments. The temperature transition rate was 20 °C/s, except for the third segment of the melting curve analysis where it was set to 0.1 °C/s. Quantification was obtained by comparing the fluorescence emitted by PCR products at unknown concentration with the fluorescence emitted by external standards at known concentration. For this analysis, fluorescence values, measured in the log-linear phase of amplification, were estimated with
22
the second derivative maximum method using Light Cycler Data Analysis software. PCR products specificity was evaluated by melting curve analysis followed by gel electrophoresis. To assess the different expression levels we employed the ΔCt method. We analyzed the mean of the crossing points (or crossing threshold = Ct) of each sample. The Ct represents the number of cycles needed to detect a fluorescence above a specific threshold level and it is inversely correlated to the amount of nucleic acids template present in the reaction. The ΔCt was calculated by normalizing the mean Ct of each sample to the mean Ct of the reference gene measured in the same experimental conditions. For quantification of each gene we considered untreated cells as positive samples (calibrator sample). The ΔΔCt of each sample was calculated by subtracting calibrator ΔCt to sample ΔCt. The formula 2−ΔΔCt was used to calculate the fold change.
Western blot analysis
Crude extracts were prepared by homogenizing cells in a buffer containing 20 mM Tris (pH 7.4), 2 mM EDTA, 0.5 mM EGTA; 50 mM mercaptoethanol, 0.32 mM sucrose and a protease inhibitor cocktail (Roche Diagnostics) using a Teflon-glass homogenizer and then
23
sonicated. Protein concentrations were determined by Bradford‟s method (Bradford, 1976) using BSA as a standard. Sample proteins (20 μg) were diluted in 4× sodium dodecyl sulphate (SDS) protein gel loading solution (Invitrogen), boiled for 5 min, separated on 4–12% Bis-tris gel (Invitrogen) by electrophoresis and processed as previously described by Pascale et al., 1996. Immunoblot analysis was performed by using a rabbit polyclonal antibody raised against a peptide mapping within the C-terminus of neurofibromin of human origin (sc-67, Santa Cruz Biotechnology Inc.) and a rabbit polyclonal antibody raised against amino acids 210–444 of β-tubulin of human origin (sc-9104, Santa Cruz Biotechnology Inc.), which was used as loading control. All primary antibodies were diluted 1:200, while the secondary antibody (goat antirabbit IgG2b HRP, Amersham Biosciences) was used at 1:10000. Blots were developed using enhanced chemiluminescence technique (Amersham Biosciences). No signal was detected when the primary antibody was omitted (data not shown).
Immunofluorescence analysis
Cells were permeabilized in 0.1% sodium citrate with 0.1% Triton X-100 detergent (Sigma, St. Louis, MO). After pretreatment in a blocking
24
solution consisting of 4% normal goat serum (Sigma, St. Louis, MO), 0.25% bovine serum albumin (Sigma–Aldrich, USA) in 0.1 mol/L PBS-TX for 2 h at room temperature, permeabilized cells were incubated for 20 h at 4 °C in a primary antibody raised against a peptide mapping within the C-terminus of neurofibromin of human origin (sc-67, Santa Cruz Biotechnology Inc.). Cells were then incubated in a secondary antibody conjugated to a fluorescent tag (Alexa Fluor 488, Molecular Probes Inc., Eugene, OR) for 1.5 h at room temperature and shielded from light. After a series of PBS and double-distilled water washes, the fixed cells were cover-slipped with Vectashield mounting medium (Vector Laboratories Inc., Burlingame, CA). Ten fields from randomly selected slides were visualized using an Axiovert 40 epifluorescence microscope (Carl Zeiss Inc., Thornwood, NY) at 20× magnification and images of each field were captured using a digital camera (Canon, Japan).
Statistical analysis
Data are reported as mean ± SEMs. One-way analysis of variance (ANOVA) was used to compare differences among groups followed by
25
Tukey test to evaluate which groups were statistically different. The level of significance for all statistical tests was p ⩽ 0.05.
Results
Analysis of NF1 mRNA expression in rat MPNST cells
In order to identify NF1 mRNA expression in MPNST cells, a RT–PCR analysis was performed. Amplification products obtained using specific primers which recognized NF1 demonstrated that the gene is expressed in this cell line (Figure 1). However, this qualitative analysis does not allow to quantify transcript levels. Primers for S18 ribosomal subunit were used as control in each PCR amplification and generated a band of the expected length.
26
Figure 1 - RT-PCR analysis using specific primers which recognized
NF1 gene. Primers for S18 ribosomal subunit were used as an external control. A 100bp DNA ladder is shown on the left side of the gel (lane M).
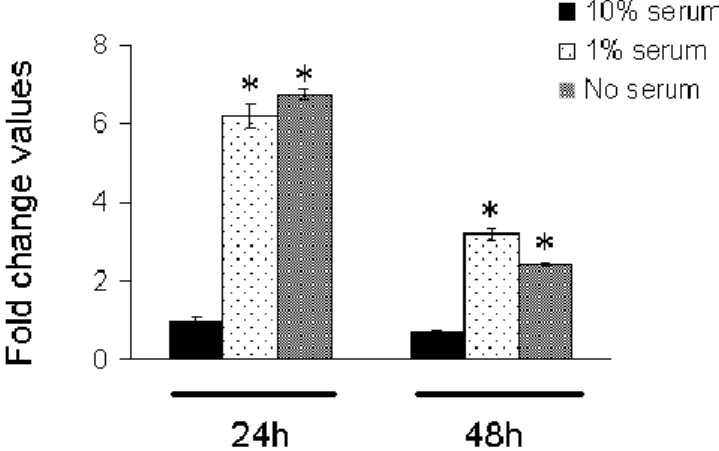
Serum-induced changes in NF1 mRNA expression
To investigate whether culture conditions affected NF1 transcript levels of MPNST cells grown in medium containing different amounts of fetal bovine serum (10%, 1% or no serum, respectively) a real time quantitative PCR analysis was performed. As shown in figure 2, NF1 levels were significantly influenced by serum both after 24h and 48h. In particular, normal serum cultured cells showed low transcript levels, with no significant changes at both experimental times considered. In contrast, both low- or no-serum induced a dramatic increase in NF1 expression already after 24h. Such increase, although less pronounced, was still statistically significant after 48h when compared to normally serum cultured cells. Indeed, some minor differences in transcript levels were also apparent from low- and no-serum cultured cells after 24h and 48h, although not statistically relevant. Moreover, statistical analysis of
27
data revealed no significant changes in NF1 mRNA levels between 1% serum and serum-free cultured cells both after 24h and 48h.
Figure 2 - Differences in NF1 fold change values among MPNST cells
cultured using different amounts of serum (10%, 1% or no serum, respectively) after 24h and 48h were quantified by real time quantitative PCR. Values are reported as relative fold change values ± SEM from three independent experiments. *significantly different as compared to 10% serum cultured cells (p<0.05 by using Tukey test)
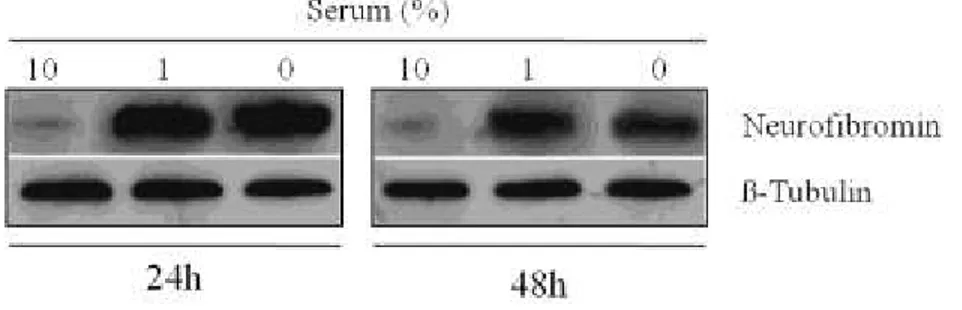
Serum-induced changes in NF1 protein expression
To assess whether serum affected NF1 gene product at protein level we analyzed neurofibromin expression by western blot analysis in the same experimental conditions described above. Neurofibromin specific
28
immunolabelling (corresponding to a single antigenic band of ~250 kDa) was strongly affected by culture conditions (Figure 3). In fact, the low band density observed in normal serum cultured cells after 24h was strikingly increased when serum levels were decreased to 1% or when it was totally removed from culture medium. A similar pattern was observed after 48h, although the corresponding bands‟ intensities were partially attenuated. β-tubulin was used as loading control (Figure 3).
Figure 3 - Western blot analysis of neurofibromin in MPNST cells
cultured using different amounts of serum (10%, 1% or no serum, respectively) after 24h and 48h. Representative immunoblots containing 20µg of MPNST cells homogenates were incubated using a rabbit polyclonal antibody raised against a peptide mapping within the C-terminus of neurofibromin of human origin. β-tubulin was used as loading control. Experiments were performed indipendently at least three times.
29
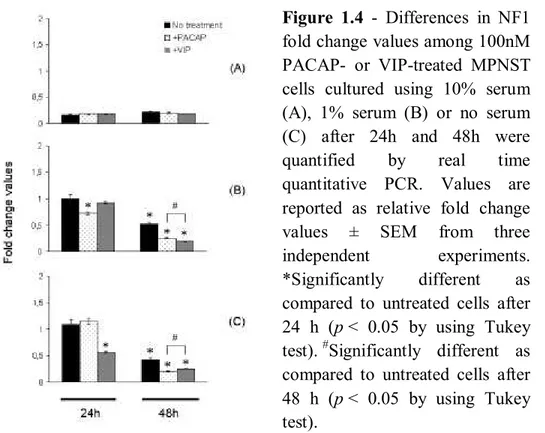
PACAP or VIP-induced changes in NF1 transcript levels
To analyze the effects of PACAP or VIP on NF1 mRNA expression, transcript levels were quantified in normally, low-dose or serum-free cultured MPNSTcells after 24h and 48h, respectively. Our findings demonstrated that treatment with 100nM of either neuropeptides differentially affected NF1 levels at both times tested in a manner depending upon serum presence within culture medium (Figure 4a, b, c). In fact, although no measurable changes were evidenced after PACAP or VIP treatment in 10% serum cultured cells after 24h and 48h, both peptides relatively inhibited gene expression in low- or no-serum cultures. In particular, treatment with 100nM PACAP, but not with VIP, significantly downregulated NF1 mRNA levels in low-serum cultured cells after 24h. An opposite pattern was achieved in serum-starved cultures, showing that only 100nM VIP treatment inhibited NF1 expression. However, after 48h treatment both neuropeptides caused a common reduction of gene expression as compared to their respective controls.
30
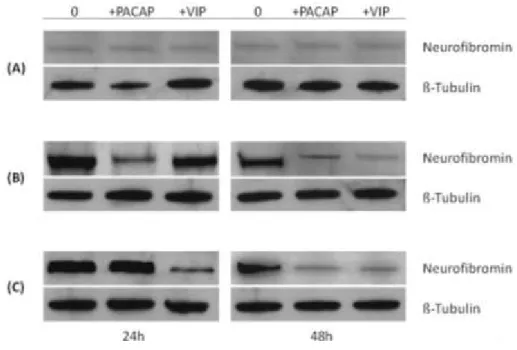
PACAP or VIP-induced changes in neurofibromin expression
Western blot analysis of neurofibromin expression in PACAP- or VIP-treated cells was evaluated both in 10%, 1% or in serum-free cultured cells. The representative bands displayed in figure 5 show high correspondence with results obtained with mRNA measurements, although a correlation between transcript and protein levels may not always be found (Sonenberg and Hinnebusch, 2009). Neurofibromin bands densities were increased in 1% or serum-free cells compared to
Figure 1.4 - Differences in NF1
fold change values among 100nM PACAP- or VIP-treated MPNST cells cultured using 10% serum (A), 1% serum (B) or no serum (C) after 24h and 48h were quantified by real time quantitative PCR. Values are reported as relative fold change values ± SEM from three independent experiments. *Significantly different as compared to untreated cells after 24 h (p < 0.05 by using Tukey test). #Significantly different as compared to untreated cells after 48 h (p < 0.05 by using Tukey test).
31
10% serum cultured cells both at 24h and 48h (Figure 5a, b, c). Treatment with either PACAP or VIP differentially reduced protein abundance after 24h, with PACAP being effective only in 1% serum grown cells, whereas VIP showed homologous results in serum-starved cells. Prolonged exposure to both neuropeptides further decreased neurofibromin expression, with no differences between low- and no-serum cultured groups.
Figure 5 - Western blot analysis of neurofibromin in 100nM PACAP- or
VIP-treated MPNST cells cultured using 10% serum (A), 1% serum (B) or no serum (C) after 24h and 48h. Representative immunoblots containing 20µg of MPNST cells homogenates were incubated using a
32
rabbit polyclonal antibody raised against a peptide mapping within the C-terminus of neurofibromin of human origin. β-tubulin was used as loading control.
Neurofibromin fluorescence immunolabelling in PACAP/VIP-treated cells
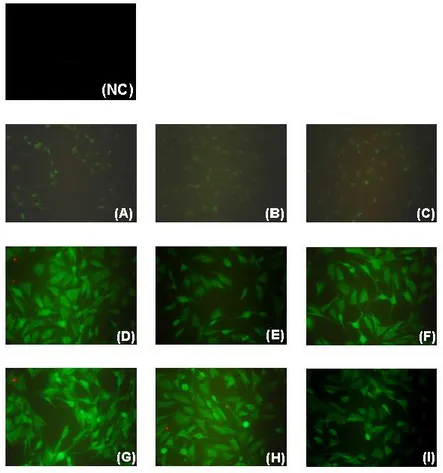
To further investigate whether PACAP or VIP treatment affected cellular protein expression in the different culture conditions, an immunofluorescence analysis of neurofibromin was carried out. Representative photomicrographs taken from 1% and serum-free cultures after 24h show increased positiveness as compared to normal serum cultured cells (Figure 6a, d and g). Although 100nM PACAP or VIP had no effects in 10% serum grown cells (Figure 6b, c), treatments attenuated fluorescence emission both in low-dose or serum-starved cells after 24h. For instance, PACAP reduced neurofibromin cytoplasmic localization in 1% serum cultured cells, with no effects when employing VIP (Figure 6e, f). Conversely, VIP, but not PACAP, showed similar effects, but only in serum-starved cells (Figure 6h, i).
33
Figure 6 - Immunofluorescence analysis of neurofibromin in 100nM
PACAP- or VIP treated cells cultured using 10% serum (A–C), 1% serum (D–F) or no serum (G–I) after 24h exposure. (NC) negative control (primary antibody was omitted).
34
Discussion
PACAP and VIP are two related neuropeptides involved in proliferation, development and survival of different cell lines (Vaudry et al. 1998; Scharf et al., 2008). These peptides have been shown to protect adult neurons from apoptosis both in vivo (Uchida et al. 1996; Ohtaki et al. 2006) and in vitro (Bhave and Hoffman 2004). In particular, PACAP is able to increase cerebellar neuronal survival after serum deprivation (Cavallaro et al. 1996; Przywara et al. 1998; Vaudry et al. 1998), oxidative stress (Vaudry et al. 2002a), ethanol- (Vaudry et al. 2002b) or ceramide-induced toxicity (Falluel-Morel et al. 2004). Furthermore, PACAP and VIP anti-apoptotic effects have also been demonstrated in non-neuronal cell lines (Somogyvari-Vigh and Reglodi, 2004; Gasz et al., 2006; Racz et al., 2007), with converging evidences supporting the idea that their protective roles are exerted through several mechanisms, included pathways which lead to the modulation of death and survival genes (Aubert et al., 2006; Castorina et al., 2008; Dejda et al., 2008). Neurofibromin, encoded by the NF1 gene, is a tumor suppressor protein with Ras-GTPase activity (GAP). In addition to its putative role in regulating cell proliferation (Hiatt et al., 2001; Dasgupta et al., 2005; Thomas et al., 2006), different findings indicate that neurofibromin is
35
correlated to a pro-apoptotic function (Johnson et al., 1994; Shapira et al., 2007), thus suggesting that it may act as a death-related protein. In fact, it has been demonstrated that this tumor suppressor confers sensitivity to apoptosis in response to growth factors deprivation to both mouse embryonic fibroblasts (Shapira et al., 2007) and neural stem cells (Dasgupta et al., 2005).
It is well-known that fetal bovine serum usually represents the primary source of growth factors in many cell cultures. In particular, it has been demonstrated that in the absence of growth factors, cells enter a nondividing state, termed G0, characterized by low metabolic activity,
which ultimately leads to cell death (Iyer et al., 1999). Among these abundant constituents of serum, lysophosphatidic acid (LPA) (Weiner and Chun, 1999), glial growth factor (Trachtenberg and Thompson, 1996) and insulin-like growth factor-1 (Mews and Meyer, 1993) have been shown to regulate Schwann cell survival (Li et al., 2003). However, the complexity of the interactions among the several pathways involved in the response to serum deprivation have not been clearly understood. Interestingly, in the first part of the present work we found that normal- or low-doses of serum, as well as its total removal from culture medium, differently affected NF1 expression (Figure 2, 3), with a remarkable
36
increase of both transcript and protein levels in the two latter culture conditions. Considering that partial or total serum deprivation causes a significant reduction of cell viability, mainly due to the activation of an apoptotic process (Castorina et al., 2008; Liu et al., 2009), this result is consistent with the emerging evidences corroborating the pro-apoptotic function of this gene (Dasgupta et al., 2005; Shapira et al., 2007). However, this finding does not rule out whether other underlying stimuli which trigger the expression of death genes might also influence NF1 expression.
In the second part of this study we sought to determine whether treatment with PACAP or VIP, two known pro-survival agents, could affect the expression of the putatively pro-apoptotic NF1 gene in response to different serum-dependent anti- or pro-apoptotic stimuli. In a previous work we have identified PAC1 and VPAC type receptors, as well as PACAP peptide in rat MPNST cells. Furthermore, we have demonstrated that both neuropeptides prevent apoptosis by increasing resistance to cell death induced by serum withdrawal (Castorina et al., 2008).
Our findings revealed that treatment with either PACAP or VIP did not affect NF1 expression in 10% serum cultured cells, but significantly
37
inhibited transcript and protein levels when cells were grown using 1% or no-serum (Figure 4, 5).
Several findings indicate that the pro-survival response to PACAP or VIP is mediated by PAC1/VPAC receptors, which act directly as upstream effectors (Delcourt et al., 2007; Dejda et al., 2008), or indirectly, through their interaction with other growth factors (Lelievre et al., 2006). Both mechanisms involve the activation of different G-proteins, which lead to the modulation of intracellular cAMP levels and/or to a cascade of events that ultimately result in the regulation of death and survival genes (Dejda et al., 2008).
For reasons that are unclear, in our experiments PACAP and its closest family member VIP behaved differently in the earliest times of exposure (24h), depending upon serum presence in culture medium, with PACAP being effective only in 1% serum cultured cells (Figure 4b, 5b), whereas VIP showed similar results in serum-starved cells (Figure 4c, 5c). These findings were also supported by immunofluorescence analysis (Figure 6).
The differences between the two peptides may imply that different receptors and signaling pathways could mediate these actions. In fact, the PAC1 variants are known to differentially couple the receptor to
38
signaling cascades in addition to the canonical cAMP/PKA pathway (Ushiyama et al., 2007). The fact that some of these PAC1 splice variants are present in MPNST cells (Castorina et al., 2008) might have significance in the light of the results obtained with PACAP in presence of 1% serum. For instance, the presence of a specific type of growth factor could directly influence the intracellular cascade driven by PACAP/PAC1 interactions and differentially influence cell survival response. This situation closely resembles that observed in striatal astrocytes (Pébay et al., 1999). In this model, LPA strongly inhibited PACAP-induced cAMP formation, involved in cell survival response. However, it is difficult to explain how PACAP or VIP differently affect NF1 expression under a specific culture condition (1% serum) and not in another (serum-starvation). To the best of our knowledge, it is likely that agents like PACAP or VIP differently affect the sensitivity of MPNST cells to other death regulators, rather than the NF1 gene, at least in short terms. In fact, prolonged exposure to either neuropeptides inhibited gene and protein expression in a similar manner, independently from culture conditions (Figure 4b-c, 5b-c). Although these evidences need further investigations to better comprehend the mechanisms involved in the regulation of the NF1 gene and its role in apoptosis, the common gene
39
induction observed during serum starvation and the subsequent inhibition induced by peptide treatments supports the proposal of NF1 as a candidate pro-apoptotic gene, yielding new insights into its novel tumor suppressor function.
Conflict of interest
There authors declare that there are no competing interests.
Acknowledgements
These experiments were supported by the International PhD Program in Neuropharmacology, University of Catania, Medical School. We thank Mr. P. Asero for his technical support and Dr. F. Murabito for his administrative support.
40
Involvement of PACAP/ADNP signaling in the resistance
to cell death in malignant peripheral nerve sheath tumor
(MPNST) cells
Alessandro Castorina1, Salvatore Giunta1, Soraya Scuderi1, Velia D‟Agata1,*
1Department of Bio-Medical Sciences, University of Catania,
Catania, Italy
Abstract
Malignant peripheral nerve sheath tumors (MPNSTs) are often associated with poor prognosis and patient outcome. These tumors grow under conditions of metabolic stress caused by insufficient nutrients or oxygen. Both the pituitary adenylate cyclase-activating polypeptide (PACAP) and the activity-dependent neuroprotective protein (ADNP) have glioprotective potential. However, whether PACAP/ADNP signaling is involved in the resistance to cell death in MPNST cells remains to be clarified. To address this issue, we have investigated the involvement of this signaling system in the survival response of MPNST
41
cells against hydrogen peroxide (H2O2)-induced cell death. Results
showed that ADNP levels increased time-dependently (6-48h) in serum starved (SS) MPNST cells. Treatment with PACAP38 (10-9 to 10-5M) dose-dependently increased ADNP levels in the presence of normal serum (NS) but not in SS cells. PAC1/VPAC receptor antagonists
completely suppressed PACAP-stimulated ADNP increase and partially reduced ADNP expression in SS cells. NS cultured cells exposed to H2O2 showed significantly reduced cell viability (~50%), increased p53,
caspase-3 and DNA fragmentation, without affecting ADNP expression. These effects were significantly reduced in SS cells and not ameliorated by PACAP38. Altogether, this study shows that ADNP induction by PACAP38 or by serum withdrawal may contribute to increase MPNST cell resistance against H2O2-induced death.
Keywords : Activity-dependent neuroprotective protein, PACAP, VIP,
serum starvation, MPNST cells, oxidative stress
42
Introduction
Neurofibromatosis type 1 (NF1) is an inherited neurogenetic disorder with a relatively low incidence (about 1 : 3500). This pathology is characterized by several features which include optic gliomas, Lisch nodules and cafè-au-lait spots (Friedman et al., 1999). The hallmark of NF1 is the formation of benign tumors of the peripheral nerve sheath, called neurofibromas, which consist in most part of a sub-population of transformed Schwann cells, but also include fibroblasts and other cell types (Carroll and Ratner, 2008). Patients with NF1 have an increased incidence (8–13%) of developing lethal malignant peripheral nerve sheath tumors (MPNSTs), highly aggressive neoplastic formations which originate from peripheral nerves and invade surrounding tissues (Sangueza and Requena, 1998). MPNSTs, similarly to other high-grade glial tumors, are usually associated with poor prognosis because they form secondary metastatic sites in the lungs, lymph nodes, and liver, but also because they are able to withstand with adverse environmental conditions caused by reduced oxygen tension or nutritional deficiency through distinct adaptive mechanisms (Rouzaire-Dubois et al., 1993; Blouw et al., 2003; Perrone et al., 2009).
43
Pituitary adenylate cyclase-activating polypeptide (PACAP) is a neuropeptide and neuroendocrine hormone which was firstly isolated from ovine hypothalamus extracts (Miyata et al. 1989). The majority of actions associated with PACAP have been observed in the central and peripheral nervous system (Vaudry et al. 2000). PACAP is a well-established neurotrophic factor, which acts directly by regulating neuronal survival (Ravni et al., 2006; Ago et al., 2011) and indirectly by stimulating glial release of neuroprotective factors, such as the activity-dependent neuroprotective protein (ADNP) (Li et al., 2005; Dejda et al. 2005; Nakamachi et al., 2006; Lelievre et al. 2006). The actions of PACAP are mediated through three G protein-coupled receptors (GPCRs), the PAC1, VPAC1 and VPAC2 receptors, which are members
of the secretin receptor family (Zhou et al. 2002). PACAP and the structurally related neuropeptide, vasoactive intestinal peptide (VIP), bind with similar potencies at the VPAC receptors (Laburthe et al. 2002), whereas PACAP is more potent than VIP at the PAC1 receptor
(Lutz et al. 2006). PACAP has been shown to induce ADNP expression in different types of glial cells by acting through PAC1 and / or VPAC
receptor types, depending on the target cell membrane (Zusev et al., 2004; Nakamachi et al., 2006).
44
ADNP mRNA is abundantly expressed in cancer tissues and increased expression has been associated with aggressive tumor growth. Zamostiano et al., (2001) has demonstrated that ADNP downregulation by antisense oligodeoxynucleotides in cancer cells up-regulates p53 expression and reduces cell viability. Furthemore, it has been shown that PACAP protects glial cells against H2O2-induced cell death
(Masmoudi-Kouki et al., 2011) and that PACAP and analogues that provide protection against H2O2 induce a parallel increase in ADNP expression
which is associated with decreased p53 levels (Sigalov et al., 2000). Thus, PACAP-driven ADNP induction may be implicated in maintaining glial tumor cell survival, perhaps through modulation of p53.
In the present study we hypothesized that PACAP/ADNP signaling might act as an adaptive mechanism involved in the resistance to H2O2–
induced cell death in MPNST cells. Furthermore, since cancer cells adapt better than normal diploid cells to hostile environments, we also determined whether this mechanism is conserved in cells undergoing serum starvation. Our data demonstrate that exogenous PACAP38 stimulates ADNP expression in MPNST cells, which correlates to increased resistance to H2O2–induced cell death, reduced p53 and
45
caspase-3 activation, as well as decreased DNA fragmentation. In cells grown in the absence of serum cell resistance to oxidative damage was even more robust but not further ameliorated by PACAP38 treatment, suggesting that under conditions of nutritional deficiency, MPNST cells might adapt to the stressful environment by activating an endogenous PACAP/ADNP signaling pathway that is involved in regulating overall cell resistance.
Materials and Methods
Cell culture
The study was carried out in rat malignant peripheral nerve sheath tumor (MPNST) cells (CRL-2768) obtained from American Type Culture Collection (Rockville, MD, USA). Cells were cultured in Dulbecco‟s modified Eagle‟s medium and supplemented with 10 % of heat-inactivated fetal calf serum (FCS), 2 mM L-glutamine, 100 U/ml penicillin, and 200 µg/ml streptomycin (Sigma-Aldrich, USA). Cells were incubated at 37 °C in a humidified atmosphere with 5 % CO2. Once
46
serum) or switched to serum free medium (W/O serum) for subsequent experiments.
Analysis of cell viability (MTT assay)
Cell viability was assessed using the cell proliferation kit I (MTT) following manufacturer's instructions (Roche). Cells were seeded into 96-well plates at a concentration of 1 × 10⁴ cells / well. DMEM containing 0.5 mg / ml 3-[4,5-dimethylthiazol-2-yl]-2,5-diphenyltetrazolium bromide (MTT) (Sigma Aldrich) was added in each well. Following incubation for 4 h at 37 °C, medium was removed, and 100 μl of DMSO was added. Formazan formed by the cleavage of the yellow tetrazolium salt MTT was measured spectrophotometrically by absorbance change at 550–600 nm using a microplate reader (BioRad).
Analysis of mRNA expression by real-time quantitative RT-PCR
Total RNA extracts were isolated by 1 ml TRIzol reagent (Invitrogen) and 0.2 ml chloroform and precipitated with 0.5 ml isopropanol. Pellet was washed with 75 % ethanol and air dried. Single stranded cDNAs were synthesized incubating total RNA (5 µg) with SuperScript III RNase H-reverse transcriptase (200 U / μl) (Invitrogen); Oligo-(dT)20
47
primer (100 nM) (Invitrogen); 1 mM dNTP mix (Invitrogen), dithiothreitol (DTT, 0.1 M), recombinant RNase-inhibitor (40 U / μl) at 42 °C for 1 h in a final volume of 20 μl. Reaction was terminated by incubation of samples at 70 °C for 10 min.
Aliquots of cDNA (400 ng) from MPNST cells grown under different experimental conditions (see related results sections for a detailed description) were amplified in parallel reactions with external standards at known amounts (purified PCR products, ranging from 102 to 108 copies) using specific primer pairs listed in Table 1. To normalize data, mRNA levels of the S18 ribosomial subunit (reference gene) were measured in each amplification. Each PCR reaction (final volume of 20 µl) contained 0.5 μM primers, 1.6 mM Mg2+, 1X Light Cycler-FastStart DNA Master SYBR Green I (Roche Diagnostic). Amplifications were performed using a Light Cycler 1.5 instrument (Roche Diagnostic) with the following program setting : (I) cDNA denaturation (1 cycle: 95 °C for 10 min); (II) quantification (45 cycles: 95 °C for 10 s, 57 °C for 7 s, 72 °C for 5 s); (III) melting curve analysis (1 cycle: 95 °C for 0 s, 65 °C for 15 s, 95 °C for 0 s); (IV) cooling (1 cycle: 40 °C for 30 s). Each amplification was carried out in duplicates in four different experiments. The temperature transition rate was 20 °C / s, except for the third
48
segment of the melting curve analysis where it was set to 0.1 °C / s. Quantification was obtained by comparing the fluorescence emitted by PCR products at unknown concentration with the fluorescence emitted by external standards at known concentration. For this analysis, fluorescence values, measured in the log-linear phase of amplification, were estimated with the second derivative maximum method using Light Cycler Data Analysis software. PCR products specificity was evaluated by melting curve analysis followed by gel electrophoresis.
To assess the different expression levels we employed the well-established ΔCt comparative method (Schmittgen and Livak, 2008). We analyzed the mean of the crossing points (or crossing threshold = Ct) of each sample. The Ct represents the number of cycles needed to detect a fluorescence above a specific threshold level and it is inversely correlated to the amount of nucleic acids template present in the reaction. The ΔCt was calculated by normalizing the mean Ct of each sample to the mean Ct of the reference gene measured in the same experimental conditions. For quantification of each gene we considered PACAP-unstimulated cells (Ctrl) grown in presence of 10% FCS (W/ serum) as our calibrator samples. The ΔΔCt of each sample was calculated by subtracting
49
calibrator ΔCt to sample ΔCt. The formula 2 –ΔΔCt was used to calculate
the fold change.
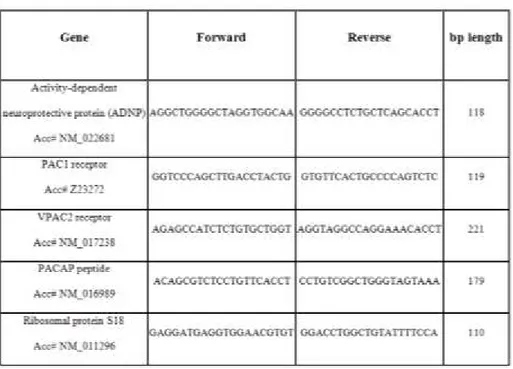
Table I : Primer sequences: Forward and reverse primers were selected
from the 5‟ and 3‟ region of each gene mRNA. The expected length of each PCR amplification product is indicated in the right column.
Western blot analysis
Crude extracts were prepared by homogenizing cells in a buffer containing 20 mM Tris (pH 7.4), 2 mM EDTA, 0.5 mM EGTA; 50 mM mercaptoethanol, 0.32 mM sucrose and a protease inhibitor cocktail
50
(Roche Diagnostics) using a Teflon-glass homogenizer and then sonicated. Protein concentrations were determined by Bradford‟s method (Bradford et al., 1976) using BSA as a standard. Sample proteins (50 μg) were diluted in 4X sodium dodecyl sulphate (SDS) protein gel loading solution (Invitrogen), boiled for 10 min, separated on 4-12 % Bis-tris gel (Invitrogen) by electrophoresis and processed as previously described by Pascale et al., (1996).
Immunoblot analyses were performed using a rabbit polyclonal antibody raised against aminoacids 1050-1102 mapping near the C-terminus of ADNP of human origin (NB300-238, Novus Biologicals), a mouse monoclonal antibody raised against aminoacids 1-45 mapping near the N-terminus sequence of p53 of human origin (sc-30020, Santa Cruz Biotechnology Inc), a goat polyclonal antibody raised against a peptide mapping at the C-terminus of caspase-3 p20 of human origin (Dako) and a rabbit polyclonal antibody raised against aminoacids 210-444 of β-tubulin of human origin (sc-9104, Santa Cruz Biotechnology Inc), which was used as loading control. All primary antibodies were diluted 1 : 200, while secondary antibodies (Amersham Biosciences) were diluited at 1 : 10000 for ADNP and β-tubulin and 1 : 7500 for p53 and caspase-3, respectively. Blots were developed using enhanced chemiluminescence
51
ECL technique (Amersham Biosciences). No signal was detected when the primary antibody was omitted (data not shown).
Hoechst 33258 nuclear staining
10 % FCS or serum starved cultures were exposed to 100μM H2O2 in the
presence or absence of 10-7 M PACAP38 for 24 h and analyzed for
typical morphological features of apoptotic degeneration by the use of fluorescence microscopy with the nuclear dye Hoechst 33258 (Forloni et al., 1993). Briefly, cells were fixed with a solution of methanol / acetic acid (3 : 1 v/v) for 30 min, washed three times in PBS and incubated for 15 min at 37 °C with 0.4 μg / ml Hoechst 33258 dye. After being rinsed in water, cells were visualized for determination of nuclear chromatin morphology with an Axiovert 40 fluorescence microscope (Carl Zeiss). Apoptotic cells were recognized on the basis of nuclear condensation and/or fragmented chromatin. Each condition was reproduced in three dishes per experiment. Representative photomicrographs of both apoptotic and normal cells were taken from three fields per dish in a fixed pattern.
52
Statistical analysis
All statistical analyses were performed using GraphPad InStat version 3.00, GraphPad Software Inc., San Diego CA, USA). Data are reported as mean ± SEM. One-way analysis of variance (ANOVA) was used to compare differences among groups and statistical significance was assessed by Tukey-Kramer post-hoc test, unless otherwise indicated. The level of significance accepted for all statistical tests was p ≤ 0.05.
Results
3.1 Time-dependent effect of serum starvation on ADNP expression in MPNST cells
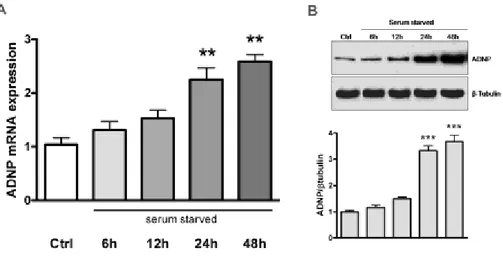
MPNST cells grown in the presence of serum (Ctrl) or switched to serum-free medium at different times (6, 12, 24 and 48h, respectively) were assayed for changes in ADNP mRNA and protein expression by quantitative real-time PCR and Western blot. Data obtained from these analyses showed that ADNP expression time-dependently increased in response to serum deprivation, reaching significant values after 24 and 48h (**p<0.01 or ***p<0.001 Vs Ctrl) (Fig. 1A and 1B).
53
Figure 1 - Time-dependent effect of serum starvation on ADNP expression in MPNST cells.
MPNST cells grown in the presence of serum (Ctrl) or switched to serum-free medium for the indicated times (6, 12, 24 and 48h, respectively) and subsequently assayed for changes in ADNP mRNA (A) and protein expression (B) by quantitative real-time PCR and Western blot as detailed in „Materials and Methods‟. (A) Results are expressed as mean fold change of 10% FCS grown MPNST cells (Ctrl, n=6) ± SEM. Relative fold changes of ADNP mRNA expression were normalized to the endogenous ribosomal protein S18 (housekeeping gene) and then calculated using the comparative ΔCt method [22]. Baseline expression levels of the control groups were set to 1. (**p<0.01 VS Ctrl, as determined by One-Way ANOVA followed by
54
Dunnett‟s post-hoc test). (B) Representative ADNP immunoblot bands obtained using 50μg of homogenates from MPNST cells cultured under the same experimental conditions for mRNA measurements. Bands were quantified using ImageQuantTL software and normalized values were plotted in the histogram shown in the lower right. (n=3, ***p<0.001 Vs Ctrl).
Dose-response effect of PACAP38 on ADNP expression in MPNST cells cultured in presence or absence of serum
PACAP38 was used in order to determine whether it is able to induce ADNP expression in this tumoral cell line. PACAP38, as well as the structurally related peptide VIP, have been shown to induce ADNP expression on both pheochromocytoma cells and in astrocytes (Sigalov et al., 2000, Zusev et al., 2004), but no data regarding their effects in MPNST cells have been reported yet. Furthermore, in preliminary experiments we have observed that ADNP expression is only moderately affected by treatment with either the truncated form of PACAP, termed PACAP27, or by VIP treatment, at least in this specific cell line (data not shown). Therefore, subsequent experiments involving peptide stimulation were performed using PACAP38.
55
Cells cultured in the presence or absence of serum were treated with increasing concentrations of PACAP38 (ranging from 10-9 to 10-5 M) and changes in ADNP expression were evaluated both at mRNA and protein level. Fig. 2A and 2B show that in the presence of serum (W/ serum) PACAP38 treatment caused a progressive induction of ADNP expression, which stabilized at 10-7 M concentration (*p<0.05 Vs Ctrl).
In cells undergoing serum starvation (W/O serum) ADNP expression levels were significantly higher than in normally fed controls (***p<0.001 Vs Ctrl) and were not further increased by exogenous peptide stimulation, suggesting that serum starvation itself might cause ADNP induction, probably by increasing endogenous PACAP levels.
56
Figure 2 - Dose-response effect of PACAP38 on ADNP expression in MPNST cells cultured in presence or absence of serum
Quantitative real-time PCR (A) and Western blot analysis (B) of ADNP expression in normally fed or serum starved MPNST cells incubated with the indicated concentrations of PACAP38 for 24h. (A) Results are expressed as mean fold change of 10% FCS grown MPNST cells (Ctrl, n=6) ± SEM. Relative fold changes of ADNP mRNA expression were normalized to the endogenous ribosomal protein S18 (housekeeping gene) and then calculated using the comparative ΔCt method (Schmittgen and Livak, 2008). Baseline expression levels of the control groups were set to 1. (*p<0.05 Vs Ctrl W/ serum, as determined by One-Way ANOVA followed by Tukey-Kramer post-hoc test). (B) Representative immunoblots showing the effect of PACAP38 (10-9 to 10-7 M) on ADNP protein expression in MPNST cells cultured both in the presence (W/ serum) or absence of serum (W/O serum). Relative band densities were quantified using ImageQuantTL software and normalized values were plotted in the histogram shown in the lower right. (n=3, *p<0.05 or ***p<0.001 Vs Ctrl W/ serum).
57
Involvement of PAC1/VPAC receptors on ADNP expression profile in
MPNST cells
To evaluate the involvement of PAC1/VPAC receptors in mediating
PACAP38-induced ADNP expression, ADNP transcript and protein levels were evaluated in normally grown (W/ serum) or serum deprived (W/O serum) MPNST cells treated with or without 10-7 M PACAP38 or
cotreated with : 1) the PAC1 receptor antagonist PACAP6-38; 2) the
VPAC receptor antagonist [D-p-Cl-Phe6,Leu17]-VIP (Xie et al., 2007) or 3) the combination of both. All receptor antagonists were used at a concentration 100-fold higher than PACAP38 (10-5 M).
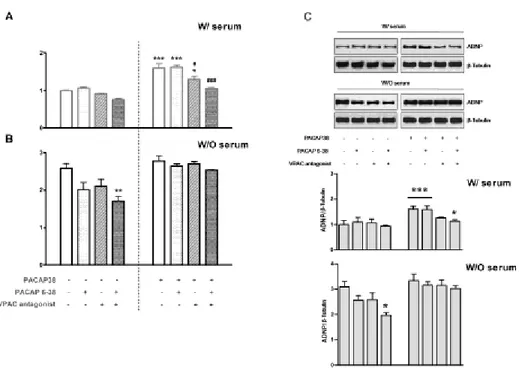
As shown in Fig. 3A and 3C, in PACAP-unstimulated cells grown in the presence of 10 % FCS, treatment with both receptor antagonists produced only a minor reduction in ADNP levels, whereas in PACAP-stimulated cells the observed ADNP induction was significantly reduced by cotreatment with the VPAC receptor antagonist (#p<0.05 Vs
PACAP-stimulated cells) and completely restored to control values by both
PAC1/VPAC antagonists (###p<0.001 Vs PACAP-stimulated cells, not
significant Vs Ctrl, ANOVA). Most notably, the increased ADNP
expression caused by removal of serum in PACAP-unstimulated cells was partially but still significantly attenuated by cotreatment with both
58
receptor antagonists (**p<0.01 Vs Ctrl) and was not affected in a significant manner in PACAP-stimulated cells (Fig. 3B and 3C).
Figure 3 - Involvement of PAC1/VPAC receptors on ADNP expression profile in MPNST cells
ADNP mRNA (A and B) and protein expression (C) in PACAP-unstimulated or 10-7 M PACAP38-stimulated MPNST cells cultured with 10% FCS (W/ serum) or serum starved (W/O serum) coincubated with the PAC1 receptor antagonist PACAP6-38, the VPAC receptor antagonist [D-p-Cl-Phe6,Leu17]-VIP [26] or the combination of both.
59
All receptor antagonists were used at a concentration 100-fold higher than PACAP38 (10-5 M). (A and B) Results are expressed as mean fold change of PACAP-unstimulated MPNST cells grown in the presence of serum (n=6) ± SEM. Baseline expression levels of the control groups were set to 1. (*p<0.05 or ***p<0.001 Vs PACAP-unstimulated cells; #p<0.05 or ###p<0.001 Vs PACAP-stimulated cells, as determined by One-Way ANOVA followed by Tukey-Kramer post-hoc test). (C) Relative band densities were quantified using ImageQuantTL software and normalized values were plotted in the histogram shown in the lower right. (n=3, *p<0.05 or ***p<0.001 Vs PACAP-unstimulated cells; #p<0.05 Vs PACAP-stimulated cells).
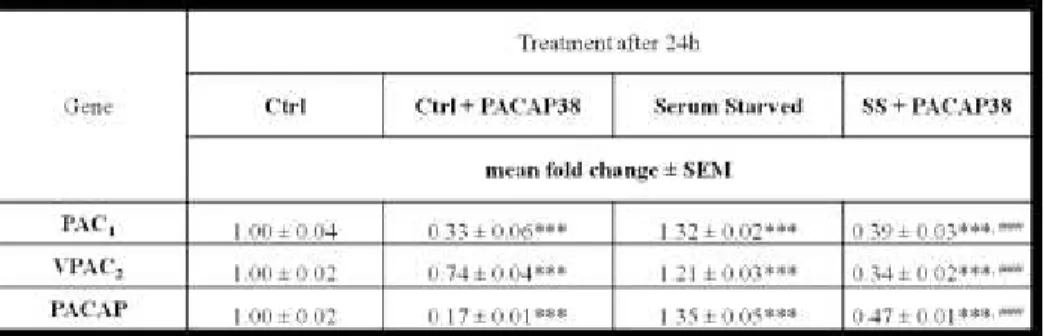
PAC1, VPAC2 receptors and PACAP peptide mRNA levels in MPNST
cells
In a previous work we have demonstrated that under normal culture conditions MPNST cells constitutively express both PAC1 and VPAC2
receptors, as well as PACAP peptide, but not VPAC1 receptor (Castorina
et al., 2008). To evaluate whether exogenous stimulation with PACAP38 or removal of serum from culture media produced changes in PAC1,
60
VPAC2 receptors and peptide transcript levels, quantitative real-time
PCR analyses were performed.
MPNST cells were grown under normal culture conditions (W/ serum) or in the absence of serum (W/O serum) with or without the addition of 10-7M PACAP38. After 24h cells were harvested for mRNA extraction and further processed as described in Materials and Methods section. We found that administration of 10-7 M PACAP38 to normal serum grown cells provoked a significant decrease in PAC1 and PACAP
peptide transcript levels and, to a minor extent, in VPAC2 mRNAs
(***p<0.001 Vs Ctrl, ANOVA) (Table 2). Conversely, in serum starved cells, both receptors and peptide mRNA levels were significantly increased as compared to normal serum cultured cells (***p<0.001 Vs
Ctrl). However, under both culture conditions, exogenous stimulation
with PACAP38 determined a significant reduction of both PAC1 and
VPAC2 receptor transcript levels, as well as of PACAP peptide mRNAs
(***p<0.001 Vs Ctrl; ### Vs Serum starved cells) (Table 2).
61
Table II: PAC1, VPAC2 receptors and PACAP peptide mRNA levels in MPNST cells.
MPNST cells grown in the presence or absence of serum were either untreated or stimulated with 10-7 M PACAP38. After 24h, PAC1 and
VPAC2, as well as PACAP peptide mRNA levels were measured by quantitative real-time PCR analysis as described in „Materials and Methods‟. Results are presented as mean fold change of control groups (Ctrl 10% FCS, n=4) ± SEM. Relative fold changes of target genes obtained after normalization to the endogenous ribosomal protein S18 (housekeeping gene) were calculated according to the comparative ΔCt method [22]. Baseline expression levels of the control groups were set to 1. (***p<0.001 Vs Ctrl; ###p<0.001 Vs Serum starved cells, One-Way ANOVA followed by Tukey-Kramer post-hoc test).
62
Dose-response effect of H2O2 treatment on cell viability in normally
cultured and serum starved MPNST cells
Cell survival response to oxidative insult in MPNST cells grown either in the presence (W/ serum) or absence of serum in culture media (W/O serum) was determined by MTT analyses. Cells cultured as described above were exposed to increasing concentrations of H2O2 (25, 50, 75,
100 and 200 μM, respectively) for a period of 24h and cell viability was assessed.
In agreement with our previous work (Castorina et al., 2008) removal of serum from culture medium reduced viability by approximately 15 % as compared to normal serum controls after 24h. Treatment with H2O2
reduced cell viability in a dose-dependent manner in both culture conditions (***p<0.001 Vs Ctrl W/ serum; #p<0.05 or ###p<0.001 Vs
Ctrl W/O serum, respectively, ANOVA) although normal serum grown
cells (W/ serum) showed higher susceptibility to oxidative insult than serum starved cells (W/O serum) (Fig. 4). In particular, at 75 μM H2O2,
the percentage of cell viability was similar in both culture conditions (p>0.05) whereas at higher concentrations (100 and 200 μM H2O2),
serum starved cells showed significantly higher survival rate than normally fed cells (+++p<0.001 Vs normally fed H2O2-treated cells),
63
with percentages of cell viability ranging from 60 – 65 % in normally fed cells and 40 – 45 % in serum starved cells with respect to untreated controls (Fig. 4). Considering that serum deprivation itself represents a condition of stress which is able to cause moderate reduction of viable cells, these results indicate that MPNST cells undergoing serum starvation show increased survival rate than normally cultured cells when both are exposed to elevated concentrations of H2O2.
64
Figure 4 - Dose-response effect of H2O2 treatment on cell viability in
normally cultured and serum starved MPNST cells
Differential effect of H2O2 treatment on cell viability in MPNST cells
cultured with 10% FCS (□) or serum starved (▲). Cells were cultured either in the presence of serum (W/serum) or in serum-free media (W/O serum) and incubated with increasing concentrations of H2O2 (25, 50,
75, 100 and 200 μM, respectively) for 24h and processed for MTT measurements as described in „Materials and Methods‟. Values are expressed as percentage of viability in normally fed cells (Ctrl W/ serum, n=6) ± SEM. Results are representative of at least three independent experiments. (***p<0.001 Vs Ctrl W/ serum; #p<0.05 or ###p<0.001 Vs Ctrl W/O serum; +++p<0.001 Vs normally fed cells treated with the corresponding concentration of H2O2, One-Way
ANOVA followed by Tukey-Kramer post-hoc test).
Effect of PACAP38 on ADNP expression and MPNST cell survival against H2O2-induced cell death
To investigate the effects of PACAP38 treatment on ADNP expression after oxidative stress and to evaluate whether these are correlated to increased resistance to cell death, both serum-enriched and serum