Full Terms & Conditions of access and use can be found at
http://www.tandfonline.com/action/journalInformation?journalCode=tted21
ISSN: 2029-4913 (Print) 2029-4921 (Online) Journal homepage: http://www.tandfonline.com/loi/tted21
Infrastructure and logistics divide: regional
comparisons between North Eastern & Southern
Italy
Fabio Carlucci, Andrea Cirà, Ennio Forte & Lucio Siviero
To cite this article: Fabio Carlucci, Andrea Cirà, Ennio Forte & Lucio Siviero (2017) Infrastructure and logistics divide: regional comparisons between North Eastern & Southern Italy, Technological and Economic Development of Economy, 23:2, 243-269, DOI: 10.3846/20294913.2015.1070768 To link to this article: https://doi.org/10.3846/20294913.2015.1070768
Published online: 09 Nov 2015.
Submit your article to this journal
Article views: 136
View related articles
View Crossmark data
Copyright © 2017 Vilnius Gediminas Technical University (VGTU) Press http://www.tandfonline.com/TTED
2017 Volume 23(2): 243–269 doi:10.3846/20294913.2015.1070768
Corresponding author Andrea Cirà E-mail: [email protected]
INFRASTRUCTURE AND LOGISTICS DIVIDE:
REGIONAL COMPARISONS BETWEEN NORTH
EASTERN & SOUTHERN ITALY
Fabio CARLUCCIa, Andrea CIRÀb, Ennio FORTEc, Lucio SIVIEROd aUniversity of Salerno, Via Giovanni Paolo II, 132, 84084 Fisciano (SA), Italy
bUniversity of Messina, Via dei Verdi, 75, 98122 Messina, Italy
cUniversity of Naples Federico II, Via Cintia – Monte S. Angelo, 80126 Napoli, Italy dUniversity of Catania, Corso Italia, 55 – 95129 Catania, Italy
Received 10 April 2012; accepted 12 April 2014
Abstract. Only recently has the inequity among territories in terms of infrastructures and logis-tics services for freight transport become the subject of several studies regarding measurement and assessment of operational functionality and correspondence of supply for real mobility needs. The efficiency and competitiveness of territories are features that may be analysed through various parametric-type and non-parametric-type methodologies and with the construction of composite indicators. In reviewing recent literature, this article tackles the theme of measurement and as-sessment of the logistics and infrastructure divide with reference to the search for greater logistic efficiency and territorial competitiveness, in function of the specificities of local production systems and pursuable models of development in the global context. The purpose of this paper is twofold: to review the prevailing methods used to estimate regional efficiency and logistics competitiveness and to focus on an Italian case study. Focusing on the application of an original composite index to the Italian case study, the main insight of our analysis is that composite indicators could help policy-makers to evaluate the requirements of infrastructural interventions and logistics services, in close keeping with the characteristics of the local economic system.
Keywords: regional development, infrastructure, logistics, efficiency, composite indicators. JEL Classification: R42, R58, R12.
Introduction
Devolution of administrative powers may cause the multiplication of decision-making cen-tres and an increase in costs and times necessary for carrying out territory-planning and infrastructure-investments (Miao et al. 2010). Moreover, in a political context of decen-tralisation, the various stages ranging from the search for community consensus to decision
implementation might be subject to a series of slowdowns, due to excessive fragmentation of the institutional environment and to greater difficulties in identifying costs and benefits of investments relating to ever larger social areas. In the transport infrastructure sector, this process has undeniable repercussions of a social nature. In this context, European transport policy plays an important role for achieving the economic and social cohesion of European countries.
With the 2011 White Paper (EC 2011) the European Commission provides the guide-lines for policy action by individual member states. It places special emphasis on the need for transport network integration among the different European countries, especially on the need to modernise transport infrastructures, to support mobility and, at the same time, to reduce atmospheric emissions. On the operational side, the EU intervenes with the new TEN-T (Trans European Transport Network) program for the development of multimodal corridors. In addition, the latest revision of the TEN-T has determined that it is not possi-ble to finance individual projects. For this reason, a detailed plan to construct new trans-port infrastructure was identified, introducing deadlines for completion of each project.
Within this framework, a special role is assigned to maritime transport, which enables trade and contacts between all European nations at the same time. At the moment, almost 90% of EU external freight trade is seaborne, 74% of goods entering or leaving Europe go by sea and short sea shipping represents 40% of intra-EU exchanges in terms of tonne-kilo-metres (EC 2013). In addition, the European transport policy underlines infrastructure problems as being particularly important in terms of economic rebalancing of different European regions.
In Italy, a critical issue of federalism is a new territorial and economic rebalance, more especially between the North and the South, which are characterised by a significant mac-roeconomic imbalance1. In this case, the principle of “knowing how to administer”, that is to say the decentralisation of responsibilities to local political levels, may also play a leading role. In this sense, the law on fiscal federalism (Law 42/09) provides for the assignment of special contributions to municipalities, provinces, metropolitan cities and regions for the purpose of infrastructure equalisation.
Likewise, legislators have established unequivocally that it is not possible to hypothesise infrastructural investments for equalisation purposes without detailed knowledge of the ef-fective endowment for each single territory, as preparatory knowledge for the construction of numerical indices suitable for satisfying real needs at a local level.
Although there is a certain convergence of theoretical and empirical literature on the positive effects on socio-economic growth created by investments in transport infrastruc-ture, there are no univocal results regarding actual quantification of these effects. As noted by Spiekermann and Wegener (2006) “In general, regions with higher accessibility have a better economic position than regions in peripheral areas. However, there are counter-ex-amples”. Thus, the traditional macro-economic models are not very useful for explaining, and principally for predicting, the effects of transport infrastructure investments and other transport policies on regional economic performance.
1 There are strong differences in employment and income levels between the developed North and the less developed
For this reason, the present article will attempt to examine the issue of the infrastruc-ture and logistics divide and outlines the role of estimation methods in evaluating regional efficiency and regional competitiveness, with particular regard to a specific case study of North-Eastern and Southern Italy.
Compared to the literature related to the impact of infrastructure on regional economic growth, this paper jointly investigates the effects of transport infrastructure and logistics services related to development in Italian macro-regions. For this analysis, we use an orig-inal composite indicator (ACIT) that allows us to highlight regional port-related logistics performance. The composite indicator approach used in literature will be reviewed in an innovative manner in order to take into consideration four economic dimensions capable of highlighting the effects of territorial attributes on logistics performance. With respect to current literature, the above-mentioned composite indicator is an application study of spatial analysis techniques of logistics competitiveness carried out at the aggregation level of sub-national geographical areas in the specific Italian macro-region case.
In the remaining sections of this paper, we introduce the topic of the evolution of logistics systems and their role in regional economic development (Section 1) and discuss the pros and cons of prevailing techniques used to evaluate regional efficiency and re-gional logistics competitiveness (Section 2). Analysis then focuses on composite logistics indicators and, particularly at the Italian level, on the composite indicator ACIT (acronym of Auto/Self-regulation, Compensation, Invariance and Transversality, dimensions of the economic logistics analysis framework) (Section 3). We have constructed this indicator to address the analysis of the logistics competitiveness of Italian geographical areas, which aggregate groups of Italian regions (NUTS1 level, established by Eurostat with a certain degree of division according to the presence of ports).
Conclusions are drawn on the joint outcome of the research, i.e. the complementary evaluation of efficiency and competitiveness of local infrastructures and logistics services. In general, this latter point appears crucial for European economic convergence. For this reason, the ACIT methodology was used in order to foresee impacts of devolution in terms of re-balancing or further imbalance between North and South.
1. Logistics and regional development
In looking at transport systems and their role in regional economic development, we need to describe the evolution of the logistics and supply chain.
Logistics drivers of economic development at a regional level are constantly changing and prove to be strongly influenced by the dynamics of the international economy. Indeed, the increasing integration between production and logistics in supply chains and global supply is embodied in certain features of systems that also affect regional competitiveness. Logistics outsourcing activities, global supply networks and postponed manufacturing, the transition from mass production to flexible production, which requires quality standards and a very high efficiency of logistics (JIT i.e. just-in-time supplies), high travel frequencies, scatter suppliers, storing and sorting transit are just some of the characteristics of modern logistics systems which have an impact on territories. In recent decades, the planning of
global supply chains has been modified on account of the changing needs of business re-lated to service choice attributions (price, quality, speed, reliability, flexibility), in a series of activities that add value to products through global logistics efficiency and the effectiveness of local and regional contexts.
A radical development has modified industrial processes, by turning them into complex multi-localisation systems. New forms of industrial organisation account for the abandon-ment of the “economy of stocks” and warehousing and the birth of the “economy of flows”. The former is a poorly diversified form of production with a slow cycle of renewal, whereas the latter is a fast cycle of production and distribution that allows the frequent renewal of all products and the availability of custom products, in many cases locally at consum-er markets (Vconsum-erny 2007). This development involves the specialisation of units and large production areas with the aim of adjusting supply and demand, with production costs that increase productivity and reduce inventory through regular rapid flows, on-time delivery and at competitive prices.
Among trends in the near future, the European Logistics Association (ELA) is paying special attention to the continuing process of globalisation of European economies and trade in goods, with particular regard to increased exports, as the main growth factor for mature countries reaping the benefits, and increased regionalisation of logistics in order to reduce costs and negative environmental effects (CO2 footprint). Decentralised regional networks for logistics of ever more consolidated cargoes represent one of the strategic choices for recovery and for eluding the crisis in the European Union (ELA, A. T. Kearney Company 2009). Faced with varying degrees of general efficiency of the territorial logistics system, different strategic solutions are made available and these should be assessed with reference to each spatial feature and requirement of the economic activities.
The role of regional economies within national economies has changed significantly as a result of globalisation. Until recently, regional economies tended to be highly specialised and integrated in the production of goods and services on a territorial scale based on local resources and expertise. The case of the Italian mono-sectional “industrial district” is well known as a model of regional development. Today, however, among the most advanced countries, very few regions are unaffected by changes in the international supply of goods and services. As a result of these changes, sub-national territorial entities have become more specialised, focusing on searching out external market opportunities and being less integrated in local areas.
The evolution of logistics systems requires the integration of firms in localisation strat-egies on different spatial scales (local, regional, national, continental or worldwide scales). The downward trend in transport costs and improved efficiency in logistics have had an impact on the regional dynamics of industrial structures.
The positive outcome of optimal placement contributes towards developing a new geo-graphical organisation for production, compatible with the objectives of sustainable mobil-ity, cooperating and interacting within networks of firms at a local level to reduce average distances and to increase the load factor. “Mature” globalisation makes regional speciali-sation more marked and assists firms in concentrating in places with specific advantages, such as poles and logistics centres, dry ports, distriparks (Notteboom, Rodrigue 2009).
Nowadays the level of physical and organisational integration has become a key factor in supply chain competition. By considering European ports, Ducruet and van der Horst (2009) highlight the relationship between transport integration and port performance. They provide empirical evidence that southern ports in general (including Italian ports) are char-acterised by a lower level of transport integration compared with northern ones.
With regard to the regional infrastructure and logistics divide in a specific country, Monios and Wilmsmeier (2012) analyse the peripherality of Scotland within the UK. They highlight that the region suffers a double peripherality; firstly due to geographical location, and secondly, of greater significance, due to the delay in infrastructure development and to the lack of policies and initiatives promoting direct sea links with the mainland and port-centric logistics strategies. Ports policy is devolved to Scotland, whereas shipping pol-icy is determined at a UK level, and indeed TEN-T applications can only be submitted by a member state, which in this case refers to the UK. They consider site development strat-egies to overcome this double peripherality by restructuring transport and logistics chains of large shippers through new corridors, together with an appreciation of the political and institutional relations.
To measure how regional development and transport/logistics development are mutual-ly evolving, particularmutual-ly with regard to the economic appraisal of transport infrastructures, some researchers are moving towards methods capable of including a set of wider impacts than has traditionally been the case in this field. These methods can be grouped into the wider category of non-parametric methods, among which the most widely used are the Multi Criteria Analysis and composite indicators, although there have also been attempts to use these two methods together (Thomopoulos, Grant-Muller 2013).
Macroeconomic models like Input-Output analysis, widely used in this field (Sainz et al. 2013), are not very useful for explaining the effects of transport infrastructure investments and other transport policies on regional logistics performance. Firstly, these models assume the use of production functions with fixed coefficients and constant returns to scale; this makes it impossible to examine the relationship between investment in transport structure and increased regional productivity generated by more efficient transport infra-structure (Chambers 1988). Moreover, input-output analysis implies use of many data at the regional level (cross-sector tables), which are often not easily obtainable. Other models, such as the Vector Autoregression Model, in order to measure the effects of transport infra-structure on regional economic development, allow the use of production functions with variable coefficients, so it is possible to take into account certain microeconomic aspects (typically, the reduction of costs and transport times) that lead to a more accentuated pro-ductive specialisation. For these models, it is necessary to estimate the capital invested in transport infrastructure but official statistics generally only offer data related to investments in tangible goods, supplying no data on investment in intangibles such as improvement of transport and logistics services and operations, tariff improvement policies, etc. (Pradhan, Bagchi 2013; Lean et al. 2014).
Appropriate statistical indicators are most relevant for analysing the relationship be-tween logistics infrastructure and territorial competitiveness (Sakalauskas 2010).
Nowadays, it is not possible to hypothesise infrastructural investments for equity pur-poses without detailed knowledge of the effective endowment for each single territory, as preparatory knowledge for the construction of numerical indices suitable for satisfying real needs at a local level. In other words, the importance of indicators as capital instruments in the territorial planning process becomes clear, for assessing the infrastructural status
quo and for identifying needs in different areas of the country, from the moment of the
decision-making procedure to the monitoring of infrastructures and their levels of service. In this paper, we will try to answer the question of how to evaluate regional competi-tiveness generated by transport and logistics infrastructures and operations, clearly recog-nising that they have great effects on territorial equity but, also, that they are a prerequisite for territorial development and not ends in themselves. We will attempt to examine the issue of the infrastructure and logistics divide through an approach aimed at providing a robust and uniformly applicable measure that can be interpreted easily by planners and policy-makers in order to identify shortcomings in service coverage and promote equity in logistics performance in a specific regional area.
Prevailing techniques used to evaluate efficiency and regional competitiveness are sum-marised in the next section.
2. Regional efficiency and regional competitiveness: some notes on estimation methods
Generally, it is possible to distinguish between estimation methods of regional efficiency with the production frontier and estimation methods of regional competitiveness with spatial data analysis of regional efficiency, which has been the subject of numerous studies, mainly in the field of regional sciences. The prevailing techniques used tend to assimilate local productivity to the productivity of enterprises in accordance with approaches inspired by microeconomic production functions. In particular, the productivity of a given terri-tory is considered as the productivity of an enterprise that optimally combines the inputs required to achieve a certain output level.
Like companies within the industrial organisation, economic theory has tried to investi-gate and empirically evaluate regional economies as entities using economic resources, ap-plying the best technology and receiving output through the production process. In keeping with this stylised vision of the region, it is consistent to expand and develop the assessment methods of industrial efficiency to regional efficiency (Puig-Junoy 2001). The choice of methodology must be based on factors such as the characteristics of the production pro-cess, the degree of stochasticity and the number of outputs and possibility of aggregation. With reference to the Italian case, estimates of the technical efficiency of Italian regional and sub-regional “territorial units” (Provinces and Local Labour Systems – SLL) have been made by providing for Cobb-Douglas type functions of regional production. These estimate the efficiency parameters of production factors by using stochastic regional frontier econo-metric techniques to evaluate the impact of investments on public capital (infrastructures) and incentives for industrial firms (Bollino, Polinori 2005; Mastromarco, Woitek 2006).
Specific studies into sub-national territorial technical efficiency influenced by the trans-port and logistics infrastructural endowment, using deterministic non-parametric frontier estimation methods (such as DEA – Data Envelopment Analysis), have not been found at an Italian regional level. Mazziotta and Vidoli (2009) apply the DEA technique to measure the weights of sample indicators and the territorial units for the construction of a composite indicator of the infrastructural endowment of the Italian provinces. Gitto and Mancuso (2015) study regional physical and human capital accumulation and estimate the technical efficiency of Italian regions applying non-parametric bootstrapping DEA analysis. Curi
et al. (2011) estimate the relative technical efficiency of Italian airports applying
non-par-ametric bootstrapping DEA analysis.
Spatial data analysis techniques are less sophisticated in terms of mathematical anal-ysis, but perhaps better known among international organisation, and may be referred to the analysis for composite indicators. Recently, the syntheses of a series of simple indica-tors showing different qualities referring to different units (often, territorial areas), known as composite indicators, have become well developed. The composite indicator is formed when all the simple indicators are grouped into a single index using a mathematical-statis-tical model. These indicators are the syntheses of basic indicators that may have different units of measurement or refer to very different attributes. Thus, they exhibit good perfor-mance for a multidimensional analysis of complex phenomena, such as regional logistics competitiveness.
Recently the interest in composite indicators has increased considerably. Different methodologies have been developed to manage the various phases of construction of the indicator. Thanks to the increased use of composite indicators by the research centres of in-ternational organisations, such as the World Bank (Inin-ternational Trade Department) OECD
(Organisation for Economic Co-operation and Development), and Joint Research Centre
Eu-ropean Commission, there has been a continuous improvement both in the dissemination of information and in the techniques used.
Composite indicators are often used to compare and rank territorial competitiveness performance in different areas, including technological development, industrial and service competitiveness, globalisation, economic development and environment. The sectorial and multidimensional approach and the absence of assumptions about production functions differs from previous approaches for assessing regional competitiveness (OECD 2008; An-noni, Kosovska 2010).
In this particular case, the focus has been set on the main systems for constructing composite indicators with reference to the sub-national territorial context, and to the in-fluence on territorial performance of variables relating to transport infrastructures and the logistics activities of goods closely related to them. Characteristics of the methods used to estimate territorial performances and which have considered Italian territorial units are summarised in Table 1.
Further consideration deserves to be given to certain methodological issues common to the various construction techniques of composite indicators.
The DHL Global Connectedness Index measures and analyses the global connectedness of 140 countries. It measures the depth and breadth of countries’ trade, capital, information
and people flows. Twelve distinct components of connectedness are incorporated across those four pillars. The constituent components are added together as weighted sums and the weights reflect the authors’ judgment of the relative importance and value of each pillar and component to the overall evaluation of global connectedness (Ghemawat, Altman 2013). Although it can provide a measure of national mobility of goods performance (trade pillar), partially indicative of logistics competitiveness at the global level, this index focuses on the degree of openness and international connection and, thus, the level of globalisation of a particular country. The DHL Global Connectedness Index is calculated exclusively on hard data inputs, whereas most other indexes add in qualitative inputs from surveys. An example of the latter type is provided by the index calculated by the World Economic Fo-rum, entitled “Quality of port infrastructure” contained within the more general “Travel & Tourism Competitiveness Index” (TTCI). This index measures business executives’ percep-tion of their country’s port facilities. Data come from a survey conducted among more than 13,000 respondents from 133 countries. Responses are aggregated using sector-weighted averaging. Scores range from 1 (port infrastructure considered extremely underdeveloped) to 7 (port infrastructure considered efficient by international standards) (Blanke, Chiesa 2013).
The study of relationships among data of the dataset is critical for constructing a good composite indicator through an initial assessment of the aggregation and weighting tech-niques to be used. The most frequently used methods for studying relationships among the variables analysed are correlation analysis and Cronbach’s Alpha coefficient.
Cronbach’s Alpha coefficient is able to assess how a set of elements (items), the
sub-in-dicators, are able to measure a single one-dimensional object such as the phenomenon analysed:
(
)
( )
0( )
( )
0 cov , var 1 1 var 1 var i j i j j j c x x x Q Q Q x Q x ≠ α = ⋅ = ⋅ − − − ∑
∑
; (1) Table 1. Summary of territorial analysis approachesAuthors and year Models and year Approach Object of analysis (topics) Bollino, Polinori (2005) Mastromarco, Woitek (2006) Regional Stochastic Frontier Aigner et al. (1977) Battese, Coelli (1995) Parametric
frontier Italian regional efficiency considering transport infrastructures (public capital) Mazziotta, Vidoli (2009) Curi et al. (2011) Gitto, Mancuso (2015) DEA Charnes et al. (1978) Banker et al. (1984) Non parametric frontier Infrastructural endowment Relative efficiency of transport infrastructures
Italian regional efficiency considering net physical capital Annoni,
Kosovska (2010) Spatial dataEU Regional Competitiveness Index 2010 (Annoni, Kosovska 2010)
Composite
Indicator Regional performance considering transport and logistics infrastructures, operations and services
c = 1,..., M; i, j = 1,…,Q,
where: M is the number of countries considered, Q the number of individual indicators and 0 1 Q j q x x =
=
∑
is the sum of any individual indicators.The Alpha coefficient measures the portion of variability of the analysed dataset, ex-plained by the correlation among the sub-indicators. If there is no correlation and the sub-indicators are independent, then Alpha is equal to zero, whereas if the sub-indicators are perfectly correlated, the coefficient is equal to one. Therefore, a high Alpha indicates a high degree of reliability, or that the variables considered successfully measure the under-lying latent phenomenon.
Normalisation is necessary for aggregating the data as the indicators almost always have different units of measurement. Standardisation (or z-score) converts indicators on a common scale with average zero and standard deviation (σ) equal to one. The indicators with extreme values can have a greater effect on the construction of the composite indi-cator. This may not be desirable if the intention is to reward exceptional behaviour, that is to say if a good result on a few indicators is considered better than many average scores. This effect can be corrected in the aggregation methodology, for example, by excluding the highest and lowest scores of the single indicator from the composite index or by weighting the scores of the single indicator with weights differentiated by the “desirability” of the score of the individual indicator.
The standardisation or z-score can be written in formula in the following way:
, , , , t t q c q c c t q c t q c c x x I − − − = σ , (2)
where:I represents the normalised value of indicator q for country c at time t;q ct, x repre-tq c, sents the value of indicator q for country c at time t, with q = 1,…, Q and c = 1,…, M; t,
q c c
x −
represents the average value across countries of the indicator q for country c at time t; t, q c c− σ represents the standard deviation across countries of the indicator q for country c at time t.
Weighting and aggregation for the composition of the multidimensional composite in-dicator regard the assignment of weights to each individual inin-dicator and the methodology that synthesises basic indicators having a significant role in the creation of the final rank-ings. Most composite indicators give an equal weight to all sub indicators, so each variable has the same weight in defining a synthetic measure. Weight equality is preferable if there is a shortage of statistical information or of exact knowledge of the phenomenon studied, for example, if no good knowledge of the relationship among different variables exists.
With equal weights, it may happen that, if two indicators are poorly correlated, the final weight will be double with regard to the other indicators because the same phenomenon is considered twice. A solution to this problem may be choice of indicators that have poor correlation or the decision to decrease the weight of the most closely correlated indicators. In this case, therefore, it is necessary to define a correlation threshold beyond which two indicators are closely correlated, in order to avoid double counting in the final indicator.
Various weighting techniques of indicators have been proposed, some derived from sta-tistical models such as the average of normalised indicators, principal components analysis (PCA), factorial analysis (FA) or unobserved component models (UCM), some derived from participatory methods, such as the budget allocation (BA), the analytic hierarchy process (AHP) and conjoint analysis (CA), while others are derived from the use of lin-ear programming algorithms to derive efficient frontiers, such as the Data Envelopment Analysis (DEA). The use of different weighting methods can give very different results in the index construction, so the choice must be consistent with the theoretical starting framework of the analysis.
The most common technique of linear aggregation is the weighted and normalised sum of the individual indicators:
1 Q c q qc q CI w I = =
∑
, (3)with:
∑
q qw =1 and 0≤wq≤ , for all q = 1,…,Q and c = 1, …, M,1where: CIc is the composite index value for country c; wq is the weight assigned to indicator q; Iq,c is the normalised value of indicator q for country c.
The use of an additive function of aggregation is recommended if the hypothesis of in-dependence among the indicators is verified. The use of an additive method of aggregation implicitly represents full compensability, namely countries/regions that have low values for some indicators are offset by indicators with higher values.
The simplest additive aggregation method involves calculation of the ranking of each country according to each indicator and to the sum of the resulting ranking:
1 Q c qc q CI Rank = =
∑
for c = 1,…, M. (4)The method is based on ordinal information and is simple and independent of outliers; however, the absolute value of information is lost.
3. An evaluation of the territorial and logistics divide: the Italian case study
The Logistics Performance Index (LPI), updated with the third edition in 2012, has been formulated by the World Bank and represents a composite index aimed at measuring the efficiency of the logistics system as a whole, involving a series of integrated activities, trans-port, storage, customs operations, shunting within the individual countries, etc., affecting both public and private operators. The LPI gives a multidimensional evaluation of the logistics performance of a country, ranking it on a graduation scale ranging from 1 (worst score) to 5 (best score). The judgement is the result of the online survey carried out on more than 5,000 individual assessments for each country, provided by 1,000 international shippers and couriers in order to compare the logistics profiles of 155 countries.
The LPI survey consists of two main parts for two different perspectives, namely the international and national levels. The international LPI provides qualitative assessments of a country with the participation of logistics partners operating outside the country under consideration, while the internal LPI provides both qualitative and quantitative assessments
of the supply chain by professionals operating within the country considered. The interna-tional LPI is constructed using principal components analysis (PCA). The input data are the scores assigned for each country to six evaluation areas as an average among respondents. Scores are normalised by subtracting the sample average and dividing by the standard de-viation (z-score) before the PCA. The output is a single indicator and is a weighted average of these scores. The internal LPI, in contrast, is an average representation of the responses to the questions concerning issues arising from the efficiency and quality of infrastructure and services internal to the countries, and from the costs and time for import and export activities. To obtain the scores for each country, responses with a single quantitative value are converted into logarithms, the average is calculated over all respondents for a given country and the exponential is calculated. This method is equivalent to calculating the geometric mean (World Bank 2010).
If, on the one hand, LPI is the index exclusively focused on logistics, providing a good measure of synthesis and involving the private operators of the logistics sector with the aim of providing indications to the policy-makers of each country, on the other hand it does not provide specific information about where and how to invest in order to improve. Moreover, it is liable to subjective perceptions, as it is an indicator with information originating from a survey of professionals. This approach reflects, moreover, the theoretical framework that is at the basis of the construction of the indicator, which certainly seems more oriented towards capturing aspects linked to the performance and quality of the overall logistics system of each country and to the ability and potentiality to compete globally through
trade logistics.
The technique used to achieve composite indicators may also be useful for evaluation of the logistics performance divide within countries with an economic and logistics re-gional imbalance, such as Italy2. The different values of the indicator among the regions may demonstrate and quantify the gap and provide policy guidance to improve transport and logistics services. Ferrari et al. (2010) propose a model based on statistical regressions concerning ports and local development in terms of employment in Italian provinces.
The original composite indicator ACIT (acronym for Auto/Self-regulation, Compensa-tion, Invariance and Transversality)3 is a composite indicator like the LPI, but is built on official spatial data and not on interviews with logistics operators. This case study is par-ticularly relevant and interesting since, with respect to the current literature, the composite indicator proves to be a case application study of spatial analysis techniques of logistics competitiveness carried out at the aggregation level of Italian sub-national geographical areas (Italian NUTS1 macro-regions).
An original dataset was implemented on 20 explanatory variables aggregated in 11 territorial attributes from official sources in the latest available year (Istat, Ministry of In-frastructures and Transport, ICE, etc.) for the 103 Italian provinces at the NUTS3 level es-tablished by Eurostat, subsequently divided into four aggregate matrices for each economic dimension considered by this logistics analysis approach.
2 Less developed Southern Italy suffers from an infrastructure and logistics gap compared to Northern Italy. 3 We have built the ACIT indicator in the context of research funded by the Italian Ministry of Infrastructures and
All the territorial data were then aggregated into seven macro-regions at the NUTS1 level established by Eurostat with certain divisions according to the presence of ports (Fig. 1) and with the availability of only certain data for the 20 Italian regions (NUTS2). Tables 2 and 3 show the basic statistics of the variables considered in the analysis.
The aggregation of the Italian provinces (NUTS3) and regions (NUTS2) into macro-re-gions (NUTS1) was carried out to better capture the differences between different port systems and territorial logistics platforms according to the identification of the Italian Na-tional Logistics Plan (MIT 2012). It also allows us to consider some explanatory variables only available for the Italian regions and not for the Italian provinces. Thus, the location of the ports is consistent with geographical and functional criteria adopted in the study.
The methodology aims to evaluate the strategic competitive potential of the Italian territory with a focus on port logistics and maritime transport. This potential is measured by estimating a composite index related to explanatory variables of the economic phenom-ena investigated through four dimensions of the framework of economic logistics analysis (Thore 1991). These dimensions are:
– Self-regulation, with regard to potential impacts relating to the structure and degree of market opening in the logistics sector (A-type effects). The Self-regulation dimen-sion concerns the analysis context of actions, such as the introduction of rules and
Table 2. Summary statistics NUTS3 level data
Variable vationsObser- Obs. with missing data Obs. without missing data
Mini-mum MaxiMini-mum Mean
Std. devia-tion Railways index 103 0 103 10.00 303.80 102.51 63.66 Roads index 103 0 103 34.50 260.90 104.65 50.30 Ports index 103 0 103 1.40 2494.90 142.58 306.21 Airports index 103 0 103 2.00 959.00 104.16 126.29 Hypermarkets surface 103 8 95 2500.00 234801.00 32959.64 36043.95 Large specialized areas 103 12 91 1500.00 414584.00 43048.46 53643.85 Employees transport
and logistics 103 0 103 17.00 44311.00 2650.07 5778.77
Logistics real estate
values 103 0 103 240.00 1273.33 529.69 167.47
Average time
port-interport 103 86 17 18.00 325.50 102.01 70.72
Table 3. Summary statistics NUTS2 level data
Variable Obser-vations Obs. with missing data Obs. without missing data
Minimum Maximum Mean deviationStd. Hub ports Investments 20 16 4 156.15 278.90 210.10 56.95 FDI Incoming employees 20 0 20 0.00 5469.00 1076.25 1491.68 FDI Outgoing employees 20 0 20 0.00 20584.00 2660.30 5069.39 Maritime Import 20 0 20 22960.86 8715580.36 1783280.36 2122043.13 Maritime Export 20 0 20 27581.31 4013569.70 1057013.95 1140009.60 TEU throughtput 20 8 12 33000.00 3025000.00 822500.00 1053435.38 Road freight traffic 20 0 20 7.03 48.33 25.42 13.23 Rail freight traffic 20 0 20 2.50 301.60 51.35 66.65 Cabotage 20 6 14 21.58 624.75 195.38 185.88 Interport goods handled 20 9 11 150120.00 36088776.00 6330850.55 10408330.22 Index of socio-economic gap 20 9 11 0.01 0.07 0.04 0.02
regulations, able to lead the market towards a more sustainable second best equilib-rium. Self-regulation refers to the choices of operators and users in the transport and logistics market both in the private sphere, for example vertical and horizontal agreements and alliances among operators for controlling market prices and quotas, as well as in the public sphere, through a system of incentives and/or disincentives to reach equilibrium in utilising the networks.
– Compensation, with regard to potential impacts related to the degree of use/exploita-tion of the transport capacity and other logistics services supplied (C-type effects). The Compensation dimension may be defined as the search for balance in transport and logistics processes through optimisation of these processes by eliminating or reducing to a minimum the loss of resources in the production of goods, services, energy and time. Compensation implies the close link and integration among the processes that optimise the capacity use and, hence, that of the resources employed (capital, labour, space and technology). Thus, it is a concept related to the technical and allocative efficiency of the inputs employed in a logistics process, given the trans-port technology used (Cullinane et al. 2006).
– Invariance, with regard to potential impacts on the degree of location and positioning opportunity in the enterprise networks and activities in the logistics sector (I-type effects). The Invariance dimension refers to the advantages or disadvantages of the localisation and agglomeration of transport and logistics firms and activities, includ-ing nodes and infrastructures. By measurinclud-ing the cost differential of the factors of production among different localisation solutions regarding transport and logistics costs, the value of inputs may be considered as unaltered, referring to localising indif-ference or Muth condition for production activities (Muth 1968).
– Transversality, with regard to potential impacts on integration (geographical, infra-structural, sectorial, managerial, modal) of services, processes and players of the transport and logistics market, for the selection of multimodal itineraries (T-type ef-fects). This type of integrated solution is defined at a European co-modality planning level, that is to say the efficient use of transport methods operating either individu-ally or in accordance with integrated multimodal criteria in the European transport system in order to exploit resources to the maximum and in a sustainable manner (EC 2006).
The composite indicator is based on the evaluation of strategic potentiality that the ter-ritory under analysis is able to express through the measurement of sub-indicators relating to variables that account for economic phenomena, which may be activated with greater or lesser power. The method allows application with specific reference to territorial logistics development “levers”, or rather “environments” of analysis, which may include both com-plex infrastructure operations and incentives for the development of transport and logistics activities and services.
The theoretical approach underlying the construction of the indicator is, therefore, ori-ented mainly towards the identification of opportunities for territorial logistics develop-ment, as well as towards measurement of the relative logistics performance (Forte 2009). Some studies estimate that more than 70% of the variation in per capita income across
countries could be explained by the geography of markets and suppliers, while better access to coastal/port areas alone could raise incomes by 20% (Redding, Venables 2002).
Regarding application to the Italian “port logistics environment”, 11 attributes were considered. Each attribute is described regarding its potential influence on each of the above-mentioned dimensions making up the aggregated and normalised indicator of sev-eral explanatory variables.
Selection of the territorial attributes and the explanatory variables was made considering the economic logistics framework of analysis and certain conceptual frameworks present in literature (World Bank 2010; Ojala et al. 2008; Notteboom, Rodrigue 2009; ESPON 2005). The choice of variables is therefore linked to the correct representation of the spatial at-tributes consistent with one or more dimensions of logistics analysis and to the availability of data. The indicators should be both limited and sufficiently comprehensive to capture the multidimensional nature of port logistics.
Each of the four dimensions of analysis is composed of a sum matrix of spatial attributes identified for two territorial levels and one or more explanatory variables associated to each of these attributes. It was also decided to consider the possible combination of attributes in one or more spatial dimensions simultaneously in order to construct the total composite index ACIT. In the present case study, however, the possible different combination of the four dimensions does not influence the result of the total composite index, since the sum of the dimensional weights is always equal to one (given that the single weight is equal to 0.25). The attributes and spatial explanatory variables considered are listed in Table 6.
For example, the United Nations suggests certain methodological and conceptual ap-proaches of reference to construct sustainable development indicators. They are charac-terised by the selection of indicators that start from general themes (dimensions), each of which is then divided into specific sub-themes (attributes) and each indicator may apply to more than one theme (UNDESA 2007).
A factor analysis was conducted to highlight the relationships between explanatory variables and spatial attributes. Data are available at both the provincial level (NUTS3) and regional level (NUTS2), so a double factorial analysis was necessary. Tables 4 and 5 present the factor loadings after the varimax rotation. The factor analysis confirmed the significance of the selected variables and provided useful information about their possible association with spatial attributes. The spatial attributes were then aggregated and weighed by macro-region for each economic dimension.
The factor analysis on the NUTS3 data showing the standardised Cronbach’s alpha (equation 1 applied to the whole input table) of 0.578 means that there is an acceptable portion of variability explained by the correlation among the selected variables. After the varimax rotation, 52.25% of the cumulative variability is explained by two factors. The first factor is positively related to the attributes: Distribution structures, Enterprise ag-glomeration and Location of logistics structures; the second factor is positively related to Infrastructural endowment.
The factor analysis on the NUTS2 data showing the standardised Cronbach’s alpha of 0.404 means that there is an acceptable portion of variability explained by the correlation among the selected variables. After the varimax rotation, 56.962% of the cumulative
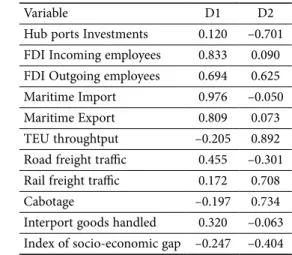
varia-bility is explained by two factors. The first factor is positively related to the attributes: FDI and Maritime import/export; the second factor is positively related to Freight traffic and negatively to Hub port investments. Having a factor loading over 0.3 in absolute value, the remaining attributes (Interport traffic, Last mile ports-interports and Urban free zones) were, however, considered.
The explanatory variables chosen to examine the two territorial levels considered can be placed on the factorial axes in order to represent the association between the two main components. The first one expresses attributes related to the location of facilities and logis-tics companies that generate and attract international traffic. The second one expresses the variables most closely related to transport attributes, such as infrastructural and freight traffic, with particular reference to domestic and international shipping.
Table 4. Factor loadings NUTS3 level data
Variable D1 D2 Railways index 0.090 0.780 Roads index 0.013 0.442 Ports index –0.110 0.544 Airports index 0.276 0.517 Hypermarkets surface 0.880 –0.145 Large specialized areas 0.913 –0.124 Employees transport
and logistics 0.845 0.131 Logistics real estate
values 0.680 0.143
Average time
port-interport –0.365 0.499
Table 5. Factor loadings NUTS2 level data
Variable D1 D2
Hub ports Investments 0.120 –0.701 FDI Incoming employees 0.833 0.090 FDI Outgoing employees 0.694 0.625 Maritime Import 0.976 –0.050 Maritime Export 0.809 0.073 TEU throughtput –0.205 0.892 Road freight traffic 0.455 –0.301 Rail freight traffic 0.172 0.708
Cabotage –0.197 0.734
Interport goods handled 0.320 –0.063 Index of socio-economic gap –0.247 –0.404
Consistently with the pattern of economic analysis of logistics derived from Thore (1991), these groups indicate the aggregation of attributes in matrices of dimensions: for the variables associated with the first component (D1) Autoregulation and Invariance (AI-type effects); for the variables associated with the second component (D2) Compensation and Transversality (CT-type effects). Therefore, the variables were associated to the attrib-utes and the latter were aggregated into two main factors. Each factor is indicative of these two dimensions and weights are therefore equal to 0.5.
It was decided to decrease the weight of the attributes that are present in more than one dimension to avoid correlation problems of double counting in the final indicator.
Factor loadings could be used as weights of attributes but, due to dataset spatial heter-ogeneity, we assigned equal dimensional weights to the individual indicators (explanatory variables), according to their combination for composing the final ACIT index (Table 6).
An area with more infrastructural endowment (n.1 territorial attribute in Table 6), for example, has the highest values of C-type and T-type dimensional indicators because the relative explanatory variables (the infrastructural indices for each NUTS3 Italian
territo-ry of railways, roads, port and airport endowment) impact on these two dimensions in accordance with the conceptual economic logistics framework of analysis designed. The magnitude of impact of each explanatory variable is given by the deviation of the normal-ised mean value.
The factor analysis allows us to visualise on the “factorial plane” the position of the units taken into account for each of the two territorial levels. The positioning is done through the use of scores to draw each unit for the two components considered (Figs 2 and 3). The labels of the coordinates refer to the units belonging to the macro-regions of North-Eastern and Southern Italy and certain other particularly significant units.
Provincial data (Fig. 2) show the influence exercised by large metropolitan areas, which are positioned on the right along the first axis of the graph. The layout of points confirms Table 6. Territorial attributes and variables – ACIT Port Logistics
No Territorial Attributes Dimen-sions Explanatory variables Weight Source 1 Infrastructural
endowment CT Railways, Roads, Ports, Airports (indices) 0.5 ISTAT (2006a) 2 Distribution
structures AI Hypermarkets surface and large specialized areas (sq.m) 0.5 Ministry of Economic Development. National Observatory of Commerce (2006) 3 Hub port
investments CT Cost of planned investments (euro) 0.5 Ministry of Infrastructures and Transport (MIT) (2008) 4 FDI (Positive/
Negative) AI Incoming and outgoing Foreign Direct Investment (employees)
0.5 ICE (2006)
5 Maritime
import/export AI Goods transported by sea (tons) 0.5 ISTAT (2006b) 6 Enterprise
agglomeration AI Employees of the transport and logistics sector
0.5 ISTAT (2004)
7 Freight traffic CT TEU of ports and goods transported by road*, rail and cabotage (tons)
0.5 ISTAT (2006c)
8 Interport traffic AI Goods handled (tons) 0.5 Italian Interport Union 2006 (CENSIS, Unione Interporti Riuniti 2008)
9 Last mile
ports-interports CT Average time highway connections port-interport
0.5 Author’s elaboration (2008)
10 Location of logistics structures
AI Logistics real estate
values (euro) 0.5 Italian logistics real estate observatory 2006 (Scenari Immobiliari 2006) 11 Urban free zones CT Index of
socio-economic gap 0.5 Ministry of Economic Development (2008)
Note: * The Road freight traffic variable is aggregated into AI dimensions (D1 factor loading). Source: Authors’ own elaboration.
the interpretation given to the variables; units of the macro region of Southern Italy, Naples and Campania region show a good balance between the size of the international logistics market and the components of multimodal transport. This analysis is similar to that which we can make for the Veneto region in the North-East (Fig. 3). Venice stands out positively for both factorial components displayed in Figure 2. Moreover, we can see that the good levels of maritime infrastructures of Trieste and Reggio Calabria (the port of Gioia Tauro), readable along the second axis of Figure 2, are not balanced compared to the amount of traffic and the logistics market. On the contrary, at the regional level, they have opposing values, as we can note analysing Figure 3 (Friuli-Venezia Giulia and Calabria). Calabria, along with the major islands, Sardinia and Sicily, although having a good level of maritime freight traffic are on the negative semi-axis with reference to the component that represents the dimension of the logistics market (Fig. 3).
Standardised or reduced distribution were used for the normalisation of indicators and indices, allowing identification of the probabilities of different value ranges using proba-bility tables. Normal distribution has the same characteristics as non-standardised normal distribution; the difference between the two distributions is that standardised normal dis-tribution has a mean equal to 0 and standard deviation equal to 1, so it is represented by a single curve, whereas general normal distribution consists of endless curves depending on μ and σ values.
The individual indicators are normalised with the z-score technique by applying equa-tion (2) and then the same average value (0) and the same standard deviaequa-tion (1) are as-signed. In this way, values falling into a positive territory (>0) show the presence of positive characteristics with respect to the phenomenon in question, while the values falling into negative territory (<0) represent the existence of negative characteristics.
Fig. 2. Factor scores of NUTS3 data
–2 –1 0 1 2 3 4 5 –4 –3 –2 –1 0 1 2 3 4 5 6 7 D1 (33 48 %). D 2 (1 8 7 7 % ) . Rome Turin Verona Genoa Trieste R. Calabria Naples Venice Salerno Bari Taranto Brindisi Palermo Catania Cagliari Milan
The individual indicators were then aggregated for each economic dimension and the dimensional index associated with them was calculated by the weighted and normalised sum of the individual indicators derived from explanatory variables applying equation (3).
The final composite ACIT index was obtained by the normalised sum of the four di-mensional indices. The final results are reported in Table 7. Furthermore, it is possible to obtain final scores and relative rankings for single economic dimensions, or for different combinations of them, not reported in this paper.
In order to give a better synthetic expression of results, data was obtained applying equation (4) to the seven regional macro-areas; in the last column of Table 7 five classes of reference were determined, useful also for a possible graphical representation of the statis-tical analysis (ESPON 2005). This involves the use of five classes, defined as:
– well-above average: values between the value obtained by adding the value of 1.16* standard deviation and maximum value to the average;
– above average: values between the value obtained by adding to the average value 0.5* standard deviation and the value obtained by adding to the average value 1.16* standard deviation;
– on average: values between the value obtained by subtracting from the average the value of 0.5* standard deviation and the value obtained by adding to the average the value of 0.5* standard deviation;
– below average: values between the value obtained by subtracting from the average the value of 1.16* standard deviation and the value obtained by subtracting from the average the value of 0.5* standard deviation;
– well-below average: values between the minimum and the value obtained by subtract-ing from the average the value of 1.16* standard deviation.
Fig. 3. Factor scores of NUTS2 data
Calabria Campania Friuli-V. G Liguria Lombardy Sardinia Sicily Trentino-A.A. Veneto –1 0 1 2 3 –3 –2 –1 0 1 2 3 4 D1 (29 79 %). D 2 (2 7 1 7 % ) . Puglia Basilicata
The composite index ACIT derived from the standardised sum of the dimensional indi-ces previously calculated leads to the ranking list set out in Table 7. It is possible to deduce in the same table the port cluster falling within each macro-area. For example, the ACIT index of the North-West macro-area results from the normalised sum of the four dimen-sional indicators calculated by equation (3) which aggregated all the variables relating to the territorial attributes of the Italian regions of Piedmont, Aosta Valley, Lombardy and Liguria, included in the North-West macro-region (Fig. 1).
Table 7. ACIT Index – Port logistics
Rank Macroarea Ports ACIT Index Classes
1 North West Genova, Savona,
La Spezia 1.184 I – well above average 2 North
Tyrrhenian-Adriatic Livorno, Ravenna 0.810 II – above average 3 North East Trieste, Venice,
Monfalcone 0.674 II – above average 4 Central
Tyrrhenian-Adriatic Civitavecchia, Ancona –0.082 III – average 5 South Tyrrhenian Naples, Salerno, Gioia
Tauro –0.377 III – average
6 South Adriatic Bari, Brindisi, Taranto –1.058 IV – below average 7 South Mediterranean Palermo, Catania,
Augusta, Cagliari –1.495 V – well below average The interpretation of the results suggests that the areas of a higher performance level are the North-West, North Tyrrhenian-Adriatic and North-East macro-areas with above-aver-age index values. However, with regard to sensitivity with respect to complex interventions of “port logistics”, the macro-areas that have an ACIT indicator near to the average are also attractive, falling within class III, which includes the ports of Naples, Salerno, Gioia Tauro, Civitavecchia and Ancona.
This evaluation comes from the characteristics of the development lever considered, which refers to complex interventions generating economic effects of development, mainly with a view to the agglomeration of firms, attraction of investment and logistics integration (modal supply chain, managerial, institutional, etc.).
The areas belonging to the first class have values indicative of a mature territorial-logis-tics development, which has, however, more constraints on expansion (lack of suitable low-cost spaces, network congestion, poor additional transport capacity, negative externalities, etc.), making measured high potential logistics development less usable because of a high logistics intensity that indicates possibility of critical congestion.
The areas belonging to the fifth class of reference, however, have values that, due to the low level of existing potential, are in an opposite position, where preconditions for the development of port logistics in the short-medium term appear rather lacking.
The logistics competitiveness divide between the North-Eastern and Southern Italian regions proves to be significant even though the under-developed South Tyrrhenian regions
present average indicators in the context of general national logistics competitiveness. In-deed, the effects of the presence of three ports specialised in container traffic influences the logistics composite indicator of this macro-area; in particular there are two medium-sized container terminals (Naples and Salerno) and one hub container port (Gioia Tauro).
The case study examined of the seven Italian macro-areas appears mostly relevant in that it highlights the importance of correct assessment of the endowment of transport and logistics infrastructures for the purposes of policy interventions aimed at regional econom-ic rebalancing (interregional equilibrium). More especially, it is inferred that in the defini-tion stage of intervendefini-tions, policy-makers should pay attendefini-tion to the real requirements of the territories considered, by making a careful assessment of the economic development potentialities not expressed by the local economic set-up. The marginal efficiency of in-vestments in infrastructures for transport and logistics proves to be declining, with the consequence that the capital invested generates relevant development effects in areas that present a relatively lower degree of infrastructuring. This is the case of the Italian macro-re-gions that present an ACIT index below rank 4 of Table 3, whose weakness is affected more by the lack of activity and international logistics companies, rather than by infrastructural capacity. Italian transport and logistics policy should be addressed in this direction.
More specifically, policies to attract investment and businesses with high intensity mar-itime transport, for both inbound and outbound logistics, may find favourable conditions for success in these local contexts.
From these considerations, it is possible to infer more general implications relating to local development policies, which should be finely tuned so as to exploit the logistics potentialities of less developed areas, without undervaluing interventions designed to re-cuperate the efficiency of networks that, while presenting a level of mature development, show high congestion levels.
The implications for economic development and integration concern the link between logistics investments and the reduction of the regional divide: the logistics development of the regions lagging behind may contribute to closing economic gaps and generating positive interregional spillovers.
Conclusions
Availability of human capital and modern transport infrastructures are necessary, but are generally insufficient for regional development, and cannot provide enough help if not used efficiently (Nijkamp 2000). This stresses the importance of the issues tackled for the analysis of industrial policy, which is essential for the competitiveness of economic structure at a local and national level. In literature, only rare examples are found of the evaluation of economic-transport needs as industrial policy, while the role of the transport and logistics sector cannot be denied. This requires maximum effort in terms of efficiency in the use of production factors, among which logistics proves to be conspicuous.
Thus, correct evaluation of the infrastructure divide and the competitiveness of logistics services among different areas of the country is essential for the solution of emerging issues, such as low efficiency of industrial relations networks, which might characterise different areas of the same country, as in the case of the Italian economy.
In this sense, as shown by many international experiences, the construction of com-posite indices should figure among the objectives of territorial comparison analysis by expressing requirements of infrastructural interventions and logistics services to enterprises and consumers, in close keeping with the characteristics of the local economic system and the development model to be pursued.
Measuring the infrastructural set between different areas in terms of absolute compar-ison among physical indicators (km of railway network, km of highways, port berths, area of intermodal terminals, etc.) is not very useful for a more dynamic interpretation of the development potentiality of territories and, especially, of the production activities located within them. Modern logistics systems express local economic characteristics and attrib-utes that require the most appropriate comparative measuring instruments for collating performance and efficiency differentials, in order to support transport and logistics policy choices at a local level. The focus of analysis, in fact, is transferred to the logistics services relating to transport, whose efficiency is crucial for raising the regional level of competi-tiveness and equity.
In a world where public spending constraints will become ever more prevalent, ir-respective of institutional questions, decision-making processes cannot be overlooked (whatever regional scale they belong to) by the use of advanced analysis tools that take into due consideration economic and regional specificities of contexts wherein they should intervene. It is no coincidence that the most avant-garde territorial logistics and economic analyses focus on the specialisation and interest features of infrastructures, as a support to production and distribution of the supply chain in order to increase the final value of goods traded.
It is hardly necessary to stress that, regardless of the methodology used, it would be desirable for policy-makers involved in the use of collective resources for territorial infra-structure to make use of test procedures designed to identify the real needs of the area, not in purely quantitative terms, but mainly aimed at maximising efficiency. This result could be achieved by comparing the range of services available with the objective demands for mobility, focusing solely and exclusively on the actual vocations of the territory in which they intervene.
At the Italian level, there are several examples of benchmarking and comparisons of the physical endowment of transport infrastructure among different regions. Again, these com-parisons have taken little account of the heterogeneity of the economics and productivity of the geographical areas studied. For example, the planning of transport in Italy, firstly through the PGT (Piano Generale dei Trasporti) i.e. General Transport Plan from 1986 up until the last Plan in 2001, did not sufficiently emphasise these differences from a transport viewpoint, which have become more marked over the last few decades.
Therefore, the purpose of comparative territorial analyses, as many international expe-riences show, should be the construction of composite indicators that express the require-ments of infrastructure interventions and logistics services for businesses and consumers in close relationship with the characteristics of the local economic system and the devel-opment model to be pursued.
In order to address this issue we have constructed the composite indicator ACIT (Auto/ Self-regulation, Compensation, Invariance and Transversality), which takes into considera-tion four economic dimensions, in order to measure the logistics inequity between Italian macro-regions attributable to an infrastructure and logistics divide.
A specific dataset was constructed on 20 explanatory variables from official sources in the latest available year for the 103 Italian provinces and the 20 Italian regions (NUTS3 and NUTS2 levels established by Eurostat, then aggregated for macro-regions at the NUTS1 lev-el) divided into four aggregate matrices for each dimension of economic logistics analysis. The principal variables that influence the logistics divide among Italian macro-regions, regarding port-related logistics competitiveness, are employees of the transport and logis-tics sector, large specialised areas of distribution, logislogis-tics real estate values, import/export of goods transported by sea, although all the selected variables have a significant impact that affects the ACIT indicator.
The analysis of more advanced territorial and economic logistics systems focus attention on the specialisation and functionality of infrastructure, as a support for production and distribution to upgrade the final value of goods traded and to widen geo-economic market projections.
This Italian experience may be considered as a case study of a composite indicator for measuring the different port-related logistics competitiveness of the areas belonging to the same country in which imbalances are present at the level of economic development.
The theoretical approach of the economic logistics underlying the construction of the indicator is mainly oriented towards the identification of opportunities and potentials for the logistics development of the area, as well as measurement of relative logistics com-petitiveness. The results of an application relating to the “port logistics environment” in seven Italian macro-areas are reported. The logistics gap is quantitatively measured by the difference between the composite ACIT index among the different Italian geographical macro-regions. Northern Italy records above average values, Central Italy together with the South Tyrrhenian area present a level of port logistics competitiveness in keeping with the national average, while South Adriatic and Mediterranean macro-regions present below average values. The logistics competitiveness divide between the North-East macro-region and the South Tyrrhenian macro-region is not especially marked.
Although only the overall results were presented, the study confirms that logistics com-petitiveness cannot be measured by partial indicators, such as infrastructural endowment or freight traffic, but other economic aspects that may affect local logistics systems need to be considered.
The different values of the ACIT composite indicator among the Italian macro-regions can demonstrate and quantify the logistics divide and provide policy guidance to improve logistics services through appropriate investments, considering groups/clusters of ports and neighbouring logistics areas.
Depending on the economic target researched, the spatial analysis technique carried out at sub-national level allows selection of an order of priority to determine “where and how to invest”. For example, to obtain a ranking in order to agglomerate logistics enterprises