UNIVERSITÀ DEGLI STUDI DELLA TUSCIA DI VITERBO
D
IPARTIMENTO DIS
CIENZEE
COLOGICHE EB
IOLOGICHECORSO DI DOTTORATO DI RICERCA IN ECOLOGIA E GESTIONE DELLE RISORSE BIOLOGICHE XXIVCICLO
R
UOLO DEI PROCESSI MICROEVOLUTIVI
NELLA NASCITA DEGLI HOTSPOT INSULARI
DI BIODIVERSITÀ
:
IL CASO DEL SISTEMA
S
ARDO
-C
ORSO
(BIO/07)
COORDINATORE
DOTT.SSA ROBERTA CIMMARUTA
TUTOR
DOTT. DANIELE CANESTRELLI
DOTTORANDA DOTT.SSA ROBERTA BISCONTI
I
NDICEPREMESSA
41.
INTRODUZIONE
52. BISCONTI
R.,
CANESTRELLI D.,
NASCETTI
G.,
2011.
GENETIC DIVERSITY
AND EVOLUTIONARY HISTORY OF THE TYRRENHIAN TREEFROGH
YLA SARDA(ANURA:
HYLIDAE):
PIECING THE PUZZLE OF CORSICA-SARDINIAN BIOTA.
B
IOLOGICALJ
OURNAL OF THEL
INNEANS
OCIETY103: 159-167.
102.1 Introduction 11
2.2 Materials e methods 13
2.3 Results 15
2.4 Discussion 17
2.5 Tables and figures 21
3. BISCONTI
R.,
CANESTRELLI
D.,
COLANGELO
P.,
NASCETTI
G.,
2011.
MULTIPLE LINES OF EVIDENCE FOR DEMOGRAPHIC AND RANGE EXPANSION OF A
TEMPERATE SPECIES (HYLA SARDA) DURING THE LAST GLACIATION.
M
OLECULARE
COLOGY20: 5313-5327.
263.1 Introduction 27
3.2 Materials and methods 30
3.2.1Sampling and laboratory procedures 30
3.2.2 Genetic data analysis 30
3.2.3 Species Distribution Modelling 33
3.3 Results 36
3.3.1 Genetic data 36
3.4 Discussion 39 3.4.1 Evolutionary history of H. Sarda 39 3.4.2 Perspectives and conclusions 42
3.5 Tables and figures
44
4. BISCONTI
R.,
CANESTRELLI
D.,
SALVI
D.,
NASCETTI
G.,
2012.
A
GEOGRAPHIC MOSAIC OF EVOLUTIONARY LINEAGES WITHIN THE INSULAR ENDEMIC NEWTE
UPROCTUS MONTANUS.
M
OLECULARE
COLOGY(SUBMITTED).
52
4.1 Introduction 53
4.2 Materials and methods 57
4.2.1Sampling and laboratory procedures 57 4.2.2 Phylogenetic analyses and molecular dating 57 4.2.3 Population genetic structure and historical demography 59 4.2.4 Spatial distribution modelling 60
4.3 Results 62
4.3.1 Phylogenetic analyses and molecular dating 62 4.3.2 Population genetic structure and historical demography 63 4.3.3 Spatial distribution modelling 64
4.4 Discussion 65
4.4.1 Evolutionary history of Euproctus montanus 65
4.4.2 Implications for taxonomy and conservation 68
4.5 Perspectives and conclusions 71
4.6 Tables and figures 73
5. DISCUSSIONE
80Nothing in biology makes sense except in the light of Evolution Theodosius Dobzhansky
Premessa
Questa tesi si basa sullo studio della storia evolutiva di due specie endemiche del complesso insulare Sardo-Corso. Nel capitolo 1 vengono presentate le tematiche e gli obiettivi generali che hanno ispirato lo studio. I risultati ottenuti sono stati elaborati, discussi ed inviati a riviste scientifiche peer-reviewed per la valutazione e l’eventuale pubblicazione. Ciascuno dei capitoli da 2 a 4 è in ogni sua parte conforme al manoscritto inviato ad una rivista, ad eccezione della letteratura citata che viene presentata in forma cumulativa nell’ultima sezione della tesi. Infine, nel capitolo 5 viene presentata una discussione generale dei risultati ottenuti ed una analisi della loro rilevanza ai fini degli obiettivi generali dello studio.
1.
I
NTRODUZIONELe specie termofile che abitano il Paleartico occidentale sono state oggetto di una delle più intense indagini filogeografiche degli ultimi decenni (Feliner 2011, Hewitt 2011a). Ne è emerso come elemento comune tra tutti gli studi, il ruolo fondamentale che le oscillazioni climatiche Plio-Pleistoceniche hanno avuto nel plasmare gli attuali pattern filogeografici e la distribuzione della diversità genetica all’interno delle specie (Thompson 2005, Hewitt 2011b). Nell’ambito degli studi che hanno interessato specie temperate europee, sono state identificate vie preferenziali di ri-colonizzazione post-glaciale degli habitat settentrionali e numerose aree di rifugio glaciale, per lo più collocate nelle penisole a sud (Hewitt 1996, 1999, 2000, 2004, 2011a, 2011b, Taberlet et al. 1998, Schmitt 2007). Queste ultime aree, oggi particolarmente ricche di biodiversità, hanno svolto un ruolo fondamentale non solo nella persistenza a lungo termine delle specie durante i periodi glaciali, ma anche nella preservazione del loro potenziale evolutivo. Infatti, molti degli studi disponibili fin’ora individuano proprio in queste aree degli hotspots di diversità, anche a livello intraspecifico (per una rassegna vedi Hewitt 2011a, 2011b). Analogamente, l’indagine filogeografica sulle specie insulari è stata principalmente indirizzata all’identificazione delle aree di lunga persistenza, alle modalità con cui le specie hanno popolato le isole ed ai successivi percorsi di dispersione tra isole e con il continente (e.g. Thompson 2005, Stock et al. 2008, Papadopoulou et al. 2009, Lazàro et al. 2011).
Mentre i percorsi di dispersione post-glaciale e la collocazione geografica delle aree di rifugio sono stati così ampiamente indagati, ancora scarsa è la conoscenza su come i cambiamenti paleoclimatici e paleogeografici abbiano influenzato la struttura della diversità genetica delle specie all’interno delle aree di rifugio. Recentemente infatti, proprio in virtù della straordinaria rilevanza di queste aree come hotspot di biodiversità intraspecifica, molti autori hanno sottolineato la particolare importanza di comprendere come le popolazioni qui residenti abbiano sopravvissuto alle oscillazioni climatiche, quali processi microevolutivi siano stati indotti da tali oscillazioni e come questi processi abbiano contribuito a formare l’attuale struttura genetica e la diversità delle specie all’interno di esse (Hampe & Petit 2005, Gomez & Lunt 2006, Canestrelli et al. 2010, Feliner 2011). Capire i processi microevolutivi che hanno permesso alle popolazioni che abitano le aree rifugio di mantenere così elevati livelli di biodiversità, è dunque uno dei
quesiti centrali della attuale ricerca filogeografica, la cui risoluzione avrebbe implicazioni significative non solo in ambiti ecologici ed evolutivi ma anche conservazionistici (Hampe & Petit 2005), per poter gestire e preservare efficacemente questi serbatoi di diversità.
Il bacino del Mediterraneo è uno dei maggiori hotspot di biodiversità a livello mondiale (Myers et al. 2000). Su di esso si affacciano le principali penisole europee, sedi di numerose aree rifugio, ed inoltre contiene oltre 5000 isole, molte delle quali ricche di diversità e di antiche linee evolutive endemiche (Thompson 2005, Vogiatzakis et al. 2008). Tuttavia, in linea con quanto si osserva a scala globale, mentre la struttura filogeografica di specie continentali è stata largamente investigata, quella di specie insulari è rimasta fino a tempi recenti sostanzialmente inesplorata. Infatti, basandoci su una ricerca all’ interno di un noto database scientifico, ISI Web of Knowledge (finestra temporale: 1985–February 2012; ricerca aggiornata al 2 febbraio 2012), usando il termine ‘Phylogeography’ abbiamo ottenuto 6719 articoli, mentre combinando ‘Phylogeography AND Island’ se ne ottengono 1140 (17%). Tuttavia, meno del 5% di tutti gli studi di filogeografia presenti analizzano pattern filogeografici intrainsulari, e meno dello 0,5% riguarda specie insulari del bacino del Mediterraneo. Questa scarsezza di studi apparirà ancora più significativa se si considera che il bacino del Mediterraneo – proprio in virtù delle sue oltre 5000 isole - è uno dei maggiori sistemi insulari al mondo (Vogiatzakis et al. 2008). Per di più, i recenti cambiamenti climatici e le alterazioni ambientali causate dall’uomo costituiscono una minaccia particolarmente marcata, proprio per quelle aree – peninsulari ed insulari – maggiormente ricche di diversità (Hampe & Petit 2005, Araujo et al. 2006, Kier et al. 2009). Ad esempio, Araujo e colleghi (2006) suggeriscono che per effetto dei cambiamenti climatici in corso, molte specie di anfibi presenti nel Paleartico occidentale subiranno un incremento particolarmente marcato della probabilità di estinzione, proprio in quelle aree del bacino del Mediterraneo che sono hotspot di diversità genetica per molte specie.
Per lo studio dei processi microevolutivi che hanno determinato la nascita di hotspot di diversità, le isole appaiono particolarmente attraenti. Innanzitutto perchè le isole hanno una lunga e fruttuosa storia come laboratori naturali per lo studio dei processi ecologici e sono state identificate come un eccellente teatro per lo studio dell’evoluzione (e.g. Darwin 1859, Wallace 1880, MacArthur & Wilson 1967, Grant 1998, Grant & Grant 2007, Whittaker & Fernandez-Palacios 2007). Molti processi microevolutivi risultano particolarmente complessi se studiati in ambito continentale, mentre in entità geografiche isolate, quantificabili nella dimensione e nella ricchezza di specie, come le isole, la
possibilità di formulare assunti semplificatori rende più agevole la verifica di ipotesi circa l’origine e lo sviluppo di questi processi (Whittaker & Fernandez-Palacios 2007).
Se le isole in generale possono considerarsi laboratori naturali per lo studio di processi microevolutivi, nel contesto del bacino del Mediterraneo il complesso sardo-corso è sicuramente un buon candidato “top-level-laboratory”, a causa di alcune sue intrinseche proprietà. È certamente un hotspot di biodiversità mediterranea, caratterizzato da flora e fauna altamente endemiche (Thompson 2005), ed inoltre lo caratterizza una storia paleogeografica complessa (Alvarez 1972, Alvarez et al. 1974, Bellon et al. 1977, Bonin et
al. 1979, Caccone et al. 1994, Orsini et al. 1980). In particolare, la paleogeografia di
queste isole è stata fortemente influenzata dalle oscillazioni del livello marino. Per tutto il Quaternario infatti si sono verificate trasgressioni e regressioni del livello del mare, che hanno portato ad abbassamenti del livelli del mare anche fino a 120 m circa sotto l’attuale, ad esempio durante l’ultima epoca glaciale (Vogiatzakis et al. 2008). Queste variazioni hanno ripetutamente influenzato i collegamenti di terra tra la Corsica, la Sardegna e la penisola italiana. Infatti, le due isole venivano unite da un ponte di terra ampio e di persistente durata risultando di fatto un’unica massa di terre emerse (Van Andel & Shackleton 1982). In seguito alle regressioni marine pleistoceniche non solo le isole si univano tra loro, ma anche una notevole porzione di larghe piane costiere emergeva, aumentando quindi la superficie totale delle due isole (Van Andel & Shackleton 1982). Questo accadeva in maggior misura per le coste della Sardegna a causa della conformazione geomorfologica propria dell’area. Nonostante la loro affinità geologica e la storia paleoclimatica condivisa, la Sardegna e la Corsica differiscono notevolmente nella diversità di ambienti che le caratterizzano. La Sardegna è la seconda isola più grande del Mediterraneo e presenta una ampia varietà di ambienti, che comprendono aree salmastre, dune sabbiose e foreste su rilievi montuosi. Caratterizzata per la maggior parte da altipiani e da coste rocciose presenta un clima mite. La Corsica è l’isola più a nord, la più ricca di ambienti umidi e la più montuosa del bacino del Mediterraneo, avendo al suo interno diverse cime che superano i 2000 metri sul livello del mare separate da valli parallele e scoscese. Il clima è più umido e rigido rispetto alla Sardegna. In accordo con alcuni recenti studi sembra inoltre che durante l’ultima epoca glaciale, mentre la Sardegna sarebbe stata mitigata nel clima dalla sua posizione più meridionale e dall’influenza di correnti marine più miti, la Corsica avrebbe invece presentato un clima più rigido con abbondanti precipitazioni, con alcune formazioni glaciali interne e venti polari nelle zone più a nord
(Kulemhann et al. 2008). Durante il Pleistocene, quindi, la Sardegna e la Corsica sarebbero apparse come un’unica massa di terra con aree fredde e montuose al nord ed aree più miti e pianeggianti a sud, risultando quindi un sistema piuttosto simile geograficamente e climaticamente alle penisole europee. Nonostante quest’area sia particolarmente interessante e complessa sotto molti aspetti che riguardano le attuali caratteristiche e le passate condizioni geografiche e climatiche, pochissimi sono gli studi che hanno indagato le tracce che gli eventi sopra descritti hanno lasciato nel genoma delle specie che la abitano (Harris et al. 2005, Falchi et al. 2009, Biollaz et al. 2010, Gentile et al. 2010, Salvi et al. 2010, Ketmaier et al. 2010).
Per iniziare ad indagare queste tracce, in questa tesi è stata analizzata la struttura della variazione geografica e la storia evolutiva di due specie di anfibi: la raganella sarda (Hyla sarda) e l’euprotto corso (Euproctus montanus).
La raganella sarda, endemica di questo complesso di isole, appare un ottimo modello per capire quali processi microevolutivi possano essere stati innescati in questo complesso dai cambiamenti climatici Pleistocenici. È una specie ampiamente distribuita in entrambe le isole, con popolazioni soprattutto al di sotto dei 1000 metri sul livello del mare (Vanni & Nistri 2006, Lanza et al. 2007). Vive preferenzialmente in prossimità di zone umide con acque stagnanti, come pozze e piscine d’acqua dolce, dove si ritrova per riprodursi durante la stagione primaverile e estiva. Anche se non esistono dati precisi a riguardo, in analogia con quanto rilevato per la specie affine Hyla arborea, si ritiene che la raganella sarda abbia buone capacità dispersive. Per H.arborea infatti, si è stimata una capacità di dispersione di oltre 10 km in un anno (Marsh & Trenham 2000). H.sarda è stata ritenuta a lungo una sottospecie di H. arborea e alla luce di dati fossili, biogeografici e filogenetici si ritiene che la separazione tra le due specie sarebbe avvenuta durante la crisi di salinità del Messiniano (5.33 milioni di anni fa circa) (Kotsakis 1980, Stock et al. 2008). Nonostante vi siano studi che hanno indagato le relazioni filogenetiche e le ipotesi sui momenti di popolamento delle isole da parte di questa specie (Lanza 1983, Nascetti et al. 1985, Stock
et al. 2008), ed altri che hanno indagato aspetti morfologici e bioacustici (Schneider 1974,
Rosso et al. 2001, Castellano et al. 2002), mancano del tutto studi sulla sua struttura genetica e la storia evolutiva pleistocenica.
L’euprotto corso, endemico della sola Corsica, risulta anch’esso un buon modello per questo genere di studi. È una specie distribuita in gran parte dei complessi montani dell’isola sino al di sopra dei 2200 metri sul livello del mare, anche se lo si ritrova più
abbondante tra i 600 e i 1500 metri. Vive prevalentemente in torrenti e più raramente in laghi montani; inoltre nella fase terrestre del ciclo annuale di attività, può ritrovarsi in aree limitrofe a queste zone umide, purché presentino rocce o rifugi lungo le rive dei corsi d’acqua e vegetazione boscosa o a macchia. La distribuzione nell’isola dell’euprotto corso sembra essere limitata prevalentemente dalla selettività della specie per gli habitat acquatici, generalmente corsi d’acqua ben ossigenati e non inquinati, e per la temperatura ottimale, tende infatti a distribuirsi al di sopra dei 600 metri. Le capacità dispersive di questo tritone sono limitate, soprattutto a causa dall’elevata dipendenza dai corsi d’acqua dai quali non si allontana per più di pochi metri (Lanza et al. 2007 e riferimenti all’interno). Nella lista rossa IUCN delle specie minacciate l’E. montanus è attualmente considerata una specie a basso rischio d’estinzione perché, sebbene il suo areale di distribuzione risulti inferiore a 20.000 km², essa sarebbe distribuita con continuità sull’isola, con una sola grande popolazione, ed inoltre non mostrerebbe evidenze di declino tanto significative da giustificare l’assegnazione ad una categoria di rischio maggiore (IUCN 2011).
Obiettivo generale di questa tesi è stato quello di indagare se e come le oscillazioni climatiche Plio-Pleistoceniche abbiano influenzato la storia evolutiva di specie endemiche insulari, e di individuare quali processi microevolutivi siano stati implicati nel determinare gli attuali pattern di diversità e di struttura genetica. In particolare, si è voluto indagare se fosse verificabile la doppia predizione di prolungata stabilità per queste specie, predizione (come poc’anzi anticipato) derivabile sia dalla letteratura sulle popolazioni insulari, sia dalla letteratura sulle aree di rifugio. A tal fine sono stati indagati i pattern di struttura genetica delle popolazioni, la filogeografia e la storia demografica di due specie endemiche del complesso sardo-corso che come poc’anzi ricordato, sebbene entrambe anfibi, sono tuttavia ben diverse dal punto di vista ecologico: la raganella sarda, specie termofila, euriecia e con discrete capacità dispersive, e l’euprotto corso, specie montana, stenoecia e con capacità dispersive limitate. Infine i risultati sono stati comparati con quelli ottenuti per altre specie endemiche insulari, per popolazioni di aree hotspot, e con la scarsa ma crescente letteratura filogeografica sulla variazione intra-isola. Tutto ciò al fine di valutare quale contributo queste specie possano offrire alla risoluzione del quesito sulla nascita ed il mantenimento degli hotspot di biodiversità.
2. G
ENETIC DIVERSITY AND EVOLUTIONARY HISTORY OF THET
YRRENHIAN TREEFROGH
YLA SARDA(A
NURA:
H
YLIDAE):
P
IECING THE PUZZLE OFC
ORSICA-S
ARDINIAN BIOTARoberta Bisconti, Daniele Canestrelli & Giuseppe Nascetti
A
BSTRACTThe Corsica-Sardinian archipelago is a hotspot of Mediterranean biodiversity. While tempo and mode of arrival of species to this archipelago and phylogenetic relationships with continental species have been investigated in many taxa, very little is known about current population genetic structure and evolutionary history following arrival. We investigated the genetic variation within and among populations of the Tyrrhenian treefrog
Hyla sarda, a species endemic to Corsica-Sardinian microplate and the surrounding
islands, by means of allozyme electrophoresis. Low genetic divergence (mean DNEI=0.01)
and no appreciable differences in the levels and distribution of genetic variability (He:
0.06-0.09) were observed among all but one populations (Elba). Historical demographic and isolation-by-distance analyses indicated that this diffused genetic homogeneity could be due to a recent demographic expansion. Along with paleoenvironmental data, such expansion could have occurred during the last glacial phase, when wide and persistent land bridges connected the main islands and a widening of lowland areas occurred. This scenario is unprecedented among Corsica-Sardinian species. Together with the lack of concordance even among the few previously studied species, this suggests that either species had largely independent responses to paleoenvironmental changes, or the history of assembly of the Corsica-Sardinian biota has most chapters still to be read.
KEYWORDS: Amphibians, allozymes, Hyla sarda, Sardinia, Corsica, Mediterranean islands, genetic differentiation.
2.1 I
NTRODUCTIONWithin the Mediterranean basin, the Corsica-Sardinian microplate is a well known hotspot of biodiversity (Thompson 2005, Blondel et al. 2010), and a major glacial refugium (e.g. Medail & Diadema 2009). Furthermore, it is particularly rich of endemic species for many taxonomic groups (Thompson 2005, Grill et al. 2007, Blondel et al. 2010 and references therein).
Corsica-Sardinian endemic differ in their origin and in the ways in which they populated the archipelago. Some of them were already present on islands at the time of the Corsica-Sardinian microplate disjunction from the Iberian Penisula, during the Miocene. Other species colonized the region during the Messinian crisis, when Mediterranean islands and the continent were largely connected for long time. Others are instead of relatively recent arrival, probably through land bridges caused by marine regression during the Plio-Pleistocene epoch. Finally, for some of these species, more than one of the above scenarios could explain equally well the available data (e.g. Lanza 1983, Carranza et al. 2005, Zangari et al. 2006, Carranza et al. 2008, Van der Meijdenn et al. 2009)
While several studies, carried out with different kind of data (based on genetics and fossils), have been conducted on species of this archipelago with the aim of investigating tempo and mode of arrival and phylogenetic relationships with continental species, very little is known about population history of species following colonization, their current population genetic structure and how they coped with the Plio-Pleistocene paleoecological changes (but see e.g. Capula 1996, Harris et al. 2005, Biollaz et al. 2010, Falchi et al. 2009, Salvi et al. 2009, 2010, Gentile et al. 2010, Ketmaier et al. 2010). This also apply to what concerns the amphibian fauna. Indeed, twelve are the autochtonous amphibian species and, among them, eleven are endemic to the microplate and – in some case - the surrounding islands. Furthermore, no studies have been carried out to date to infer the intraspecific evolutionary history following the microplate colonization.
In this paper we analysed the genetic variation within and among populations of Hyla
sarda De Betta,1853, sampled throughout the species range, by means of allozyme
electrophoresis of 20 putative loci. H. sarda is a small, cryptically coloured treefrog, endemic to Corsica, Sardinia and other neighbouring small islands, including Capraia and Elba which belong to the Tuscan archipelago (Lanza et al. 2007). It breeds in ponds, pools,
temporary waters and other freshwater habitats (Lanza 1983), and can be found at a wide range of altitudes but it is particularly abundant in lowland areas (Lanza et al. 2007, Vanni & Nistri 2006). Owing to the paucity of morphological differences, it has long been considered as a subspecies of Hyla arborea. Only after allozyme data became available, it was elevated to the species rank (Nascetti et al. 1985).
Our aims were to assess: 1) the current pattern of population genetic structure, 2) what it tells us about the recent evolutionary history of this species, 3) to start delineating testable hypotheses about how the climate-driven paleoenvironmental changes which affected the Corsican-Sardinian microplate could have contributed to shape intraspecific patterns of variation and the assembly of this microplate biota.
2.2 M
ATERIALS ANDM
ETHODSWe collected 111 individuals of Hyla sarda from 10 localities distributed throughout the entire species range. The location of sampling sites and samples details are shown in Table 1 and Figure 1A. Each individual was anaesthetized in the field by submersion in a 0.02% solution of MS222 (3-aminobenzoic acid ethyl ester), in order to take a tissue sample through a toe-clipping procedure, and was then released in the same sampling point. Collected tissues were carried to the laboratory in liquid nitrogen containers and then stored at – 80 °C.
Standard horizontal starch gel (10%) electrophoresis was performed in order to analyse the genetic variation of 20 putative allozyme loci, encoded by the following enzyme systems: Glycerol-3-phosphate dehydrogenase (G3pdh; EC 1.1.1.8), Lactate dehydrogenase (Ldh-1 and Ldh-2; EC 1.1.1.27), Malate dehydrogenase (1 and
Mdh-2; EC 1.1.1.37), Malate dehydrogenase NADP+-dependent (Mdhp-1 and Mdhp-2; EC 1.1.1.40), Isocitrate dehydrogenase (Icdh-1 and Icdh-2; EC 1.1.1.42), 6-Phosphogluconate dehydrogenase (6Pgdh; 1.1.1.44), Glyceraldehyde 3-phosphate dehydrogenase (Gapdh; EC 1.2.1.12,), Superoxide dismutase (Sod-1; EC 1.15.1.1), Aspartate transaminase (Aat-1 and Aat-2; EC 2.6.1.1), Adenosine kinase (Adk; EC 2.7.1.20), Creatine kinase (Ck; EC 2.7.3.2), Adenosine deaminase (Ada; EC 3.5.4.4), Mannose phosphate isomerase (Mpi; EC 5.3.1.8), Glucose phosphate isomerase (Gpi; EC 5.3.1.9), Phosphoglucomutase (Pgm-2; EC 5.4.2.2). Electrophoretic and staining procedures followed Canestrelli et al. (2007a). Alleles were designated by their mobility (in mm) relative to the most common one (100) in a reference population.
Estimates of allele frequencies and genetic variability (as mean observed and expected heterozygosity, percentage of polymorphic loci and average number of alleles per locus) were obtained for each population using the software BIOSYS-2 (Swofford &
Selander 1999). The Hardy-Weinberg equilibrium was evaluated for each locus in each sample by exact tests as implemented in GENEPOP ON THE WEB (Rousset 2008). The same
software was also used to compute Fisher exact tests for deviation from the expected linkage equilibrium between each pair of loci in each sample.
Data were reduced and ordered using a Principal Component Analysis (PCA) on allele frequencies of the polymorphic loci, by means of the software PCAGEN 1.2 (Goudet
1999). The statistical significance of each axis was evaluated over 10 000 randomizations. Genetic distances between populations were estimated as Nei’s (1978) unbiased genetic distance, and were then used to build an UPGMA phenogram by means of TFPGA
(Miller 1997). We ran 1000 bootstrap pseudoreplicates over loci to test the reliability of the UPGMA phenogram.
A hierarchical analysis of molecular variance (AMOVA; Excoffier et al. 1992) was carried out using ARLEQUIN 3.1 (Excoffier et al. 2005, significance assessed by 1023
permutation), with the aim of partition the total genetic variation into three hierarchical levels: among groups, among populations within groups, and within population. We used results of previous PCA and UPGMA analyses to define a-priori groups for the AMOVA analysis.
The occurrence of a significant correlation between genetic and geographic distances separating populations was assessed by means of a Mantel test. The geographic distance matrix was computed using GEOGRAPHIC DISTANCE MATRIX GENERATOR 1.2.3 (Ersts 2010).
To obtain estimates of the genetic differentiation between populations we first computed pairwise FST (Weir & Cockerham 1984), using the software FSTAT 2.9.3.2 (Goudet 2001),
and then converted these estimates into pairwise FST/(1-FST), following Rousset (1997).
The Mantel test was carried out using IBDW 3.16 (Jensen 2005), which was also used to
assess the strength of the correlation between matrices through a reduced major axis regression.
Finally, the genetic signature of past population size changes (decline or expansion) were evaluated by means of the Wilcoxon sign-ranks test (Cornuet & Luikart 1996) as implemented in the software BOTTLENECK 1.2.02 (Piry et al. 1999). We assumed an
infinite-allele model of mutation, which has been shown to be the most appropriate for allozyme data (Chakraborty et al. 1980).
2.3 R
ESULTSNine out the twenty loci analysed (Ldh-2, Mdh-2, Mdhp-2, Icdh-2, Gapdh, Sod-1,
Adk, Ck, Gpi) were found monomorphic for the same allele in all the samples studied.
Further two loci (Icdh-1, Aat-2) were found polymorphic in a single sample (Siniscola), with one allele not exceeding 5% in frequency. The allele frequency at the remaining loci are shown in Table 2. No deviations from the expected HW and linkage equilibria were observed.
Estimates of population genetic variability are given in Table 1. For all the estimated indices, the population from Elba was the least variable. For instance, the expected heterozygosity was 0.01 (±0.01) at Elba, whereas it ranged from 0.06 (±0.03) to 0.09 (±0.04) among the rest of samples.
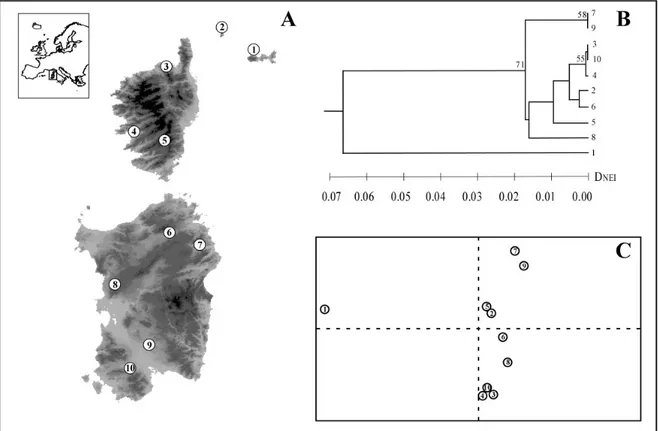
Only the first principal component from the PCA analysis (Fig.1C) was significant, and explained 61% of the total genetic variance. Along this principal component two main groups of populations were clearly apparent, one including only the population from the Elba island (sample 1), the other including all the remaining populations (samples 2-10).
The UPGMA phenogram based on the Nei’s (1978) unbiased genetic distance is shown in Fig.1B. As for the PCA analysis, two main groups were apparent, one including the sample from Elba, the other clustering all the remaining samples. The mean genetic distance between these two groups was 0.07 (0.01 s.d.), whereas within the second group it was 0.01 (0.01 s.d.).
The hierarchical analysis of the molecular variance AMOVA (Table 3) was carried out separating populations into the two groups indicated by both PCA and UPGMA analyses. This analysis revealed that the largest portion of the observed genetic variation (53%) is accounted for by the within-populations level of variation. The remaining variation was instead almost entirely explained by the among-groups level of variation (41%), whereas a minimal portion was explained by the among- populations within groups level. However all the variance components and the associated fixation indices were statistically significant (all P<0.05).
The possible occurrence of a significant correlation between genetic and geographic distances between populations was investigated both including and excluding the sample from the Elba island. In both cases the correlation between matrices was very weak
(R2=0.02 and 0.01 respectively) and non-significant. However the scatterplot of the genetic VS. geographic distances (Fig. 2) looked significantly different when including or excluding the sample from Elba. Indeed, in the latter case a much lower degree of scattering was observed over the same range of geographic distances.
Inferences of population size changes are expected to be as much reliable as more individuals and polymorphic loci are used (Cornuet & Luikart 1996). Since previous analyses of population structure identified samples from 2 to 10 as a homogeneous group, in order to maximize power of the analysis, we carried out it by grouping individuals from these samples into a single group. The Wilcoxon sign-ranks test indicated a statistically significant heterozygosity deficit (one tail test: P<0.05).
2.4 D
ISCUSSIONSThe population genetic structure and the evolutionary history of species with a Corsica-Sardinian distribution have been investigated in a limited number of studies (e.g. Capula 1996, Harris et al. 2005, Falchi et al. 2009, Salvi et al. 2009, 2010, Biollaz et al. 2010, Gentile et al. 2010, Ketmaier et al. 2010), none involving amphibians. As also pointed out by Salvi et al. (2010), the degree of concordance between the geographic-genetic patterns observed in these studies is very limited, suggesting that we still have a scanty picture of the evolutionary history of the Corsica-Sardinian biota. The population genetic structure observed in Hyla sarda adds a further piece to this building puzzle.
The only discontinuity in the geographic distribution of genetic variation was observed between the Elba island and the rest of the sampled populations. This discontinuity was supported by both the PCA and UPGMA analyses of population structure. The population from Elba was also the least variable at all the estimated indices. Taken together, the strong differentiation of this population, its low genetic diversity and its geographic location at the northern edge of the species' range, suggest that it could have been founded through a recent founder event (Allendorf & Luikart 2005), likely occurred through rare overseas dispersals (Vences et al. 2003, 2004). This scenario is also plausible in light of the paleogeographic knowledges for Elba island. Indeed, in spite of the close vicinity, it was not connected to the other islands by a Late Pleistocene land-bridge. On the other hand, during this period it was certainly connected to the Italian peninsula (e.g. Tortora et al. 2001). Thus, in case colonization wouldn't have occurred after the last insularization of the Elba island (i.e. at the Holocene interglacial) but before, a plausible expectation would have been a species occurrence even somewhere on the Italian peninsula, given the large continuity of lowland environments (see Porretta et al. 2011).
Interestingly, the same pattern of strong differentiation and low diversity was not observed for the population from Capraia island, which – as Elba island – is located at the northern edge of the species' range and was not connected neither to Corsica nor to Elba islands (and thus to mainland) during the Late Pleistocene sea low-stand. This pattern do not fit strict founder-effect models of island colonization (Whittaker & Fernández-Palacios 2007). However, recent findings on several species including Homo sapiens (Cleggs et al. 2002, Grant 2002, Tabbada et al. 2010 and references therein) suggest that single founder
events could not affect levels of diversity, nor do they result in immediate genetic differentiation between populations. Instead, successive founder events could be needed - during island hopping - to yield such pattern.
Among populations from Corsica, Sardinia and Capraia islands neither evidences of a significant population structure, nor remarkable differences in the levels of genetic variability were found. At a first glance this pattern could be taken as evidence of long-term demographic stability and absence of significant structuring processes in the recent evolutionary history of H. sarda throughout much of its range. However, the shape of the scatterplot of geographic vs. genetic distances and the BOTTLENECK analyses suggest an
alternative interpretation. When the population from Elba is removed from the analysis, the scatterplot of the geographic vs. genetic distances (see Fig. 2B) strictly match the case II of Hutchinson & Templeton (1999), whereby the observed pattern reflect the absence of a regional equilibrium between gene flow and genetic drift, with the former being relatively more influential. This pattern is expected in cases of a recent range expansion from a relatively homogeneous source population, and when the time since the expansion has not been already sufficient for a new migration-drift equilibrium to be achieved (Hutchinson & Templeton 1999). In the present case, this scenario would be also supported by the results of the BOTTLENECK analysis, which indicated a significant heterozygosity deficit at a
regional level, as expected in case of a recent population expansion (Cornuet & Luikart 2006).
When the observed genetic pattern is seen in light of the Late Pleistocene paleogeographic history of the Corsica-Sardinian block, the scenario of a recent expansion appears especially plausible. At present the two main areas of distribution of H. sarda (Sardinia and Corsica) are separated by a narrow seaway, the Bonifacio strait, which was even more extended during the last interglacial, when the sea was on everage 6 meters above its current level. With the onset of the last glacial phase the two areas became largely and persistently connected, until the sea-level rise at the beginning of the Holocene interglacial (Thiede 1978). Thus, during the last glacial phase there would have been large opportunities for wide migrations between the two main islands. Accordingly, two main scenarios could be drawn: 1) during the last glacial phase, populations from both islands underwent a secondary contact somewhere in the nearby of the Bonifacio strait; 2) during this phase, a population located in one of the two main islands expanded its range to the other parts of its current range. Based on the observed genetic pattern we could tentatively
favour the latter scenario over the former. Indeed, in case of a secondary contact between two previously differentiated populations, we would expect a pattern of variation reflecting some degree of population structuring, even in the form of clinal variation at some loci, and eventually a significant correlation between geographic and genetic distances separating populations (e.g. Durret et al. 2000). Based on our data, although favouring the second scenario, we cannot indicate the likely distribution of H. sarda before the last glacial phase, and thus the routes followed during the inferred expansion. To fill in this gap, further investigations of the genetic variation will be carried out using sequence-based molecular markers (either mtDNA or nuDNA), in order to assess the ancestral-derivative relationships between genetic variants found in different parts of the species range.
At a first look, the scenario of an essentially thermophilic treefrog which underwent a demographic expansion during the glacial phase could appear counter-intuitive. However, at least two further lines of evidence lead us to favour this scenario. First, lowland areas (i.e. those where the species currently reach higher densities) actually underwent a large increase in size during the last glacial, and growing evidences suggest that lowland areas along the coasts of the Mediterranean basin could have provided suitable areas for the persistence of large populations of thermophilic species (see Porretta
et al. 2011 and references therein). Second, demographic expansions linked to glacial
oscillations of shorelines - and the consequent widening of lowland habitats - have been recently inferred for other amphibian species, including the closely related Italian treefrog
H. intermedia (Canestrelli et al. 2007b, Canestrelli & Nascetti 2008).
The evolutionary history of the Tyrrhenian treefrog, as we have inferred here, is unprecedented among species endemic to the Corsica-Sardinian microplate (see citations above). Nevertheless, some issues of this history are likely to be shared with other species, especially those linked to lowland freshwater environments. For instance, the glacial widening of lowland habitats and opening of the Bonifacio strait, could have left detectable imprints even in the genetic patterns of variation of other species. Further studies of these imprints are thus needed to test scenarios of common vs. independent response of species from this area to the shared paleoenvironmental vicissitudes (see Sullivan et al. 2000 for an excellent discussion to this issue).
Interestingly, the study of the genetic variation in more species from the Corsica-Sardinian microplate, could also tell us something more. In the last three decades and more, many phylogeographic and population genetic studies have been accumulated for
species from several parts of the Mediterranean basin, especially the Iberian and Italian peninsulas. Thus, more recently, sound and testable hypotheses have began to be drawn about the general role of several microevolutionary processes in shaping intraspecific patterns of variation and the assembly of biota (Hewitt 2004, Hampe & Petit 2005, Gomez & Lunt 2006, Schmitt 2007, Canestrelli et al. 2010). The Corsica-Sardinia microplate, with its complex paleogeographic evolution and its rich, unique and so understudied biota, appears as a unique opportunity to test many of these hypotheses in a geographically independent but (paleo-)climatically correlated context.
2.5 T
ABLES AND FIGURES
Table 1 Geographic location, sample size and estimates of genetic variability for the 10
sampled populations of Hyla sarda. Standard deviations are shown in brachets.
Samples n Latitude N Longitude E Variability
He Ho A P 1 Elba 12 42°47' 10°15' 0.01 (0.01) 0.01 (0.01) 1.0 (0.1) 5 2 Capraia 10 43° 2' 9°50' 0.08 (0.03) 0.05 (0.02) 1.3 (0.1) 30 3 Zente 6 42°43' 9°11' 0.08 (0.04) 0.10 (0.05) 1.3 (0.1) 20 4 Avena 9 41°41' 9°20' 0.06 (0.03) 0.05 (0.03) 1.2 (0.1) 15 5 L’Ospedale 10 41°39' 9°11' 0.06 (0.03) 0.06 (0.03) 1.3 (0.1) 25 6 Luogosanto 10 41° 3' 9° 12' 0.09 (0.04) 0.11 (0.05) 1.3 (0.1) 25 7 L. Posada 10 40°38' 9°45' 0.06 (0.03) 0.07 (0.04) 1.3 (0.1) 20 8 Oristano 33 39°54' 8°35' 0.08 (0.04) 0.08 (0.04) 1.5 (0.1) 40 9 GiaraGesturi 5 39°43' 9° 2' 0.06 (0.04) 0.06 (0.04) 1.1 (0.1) 15 10 Musei 6 39°18' 8°39' 0.08 (0.04) 0.07 (0.04) 1.2 (0.1) 20
n, sample size; He, expected heterozygosity [Nei’s (1978) unbiased estimate]; Ho, observed
heterozygosity; A, mean number of alleles per locus; P, proportion of polymorphic loci (under the 99% criterion).
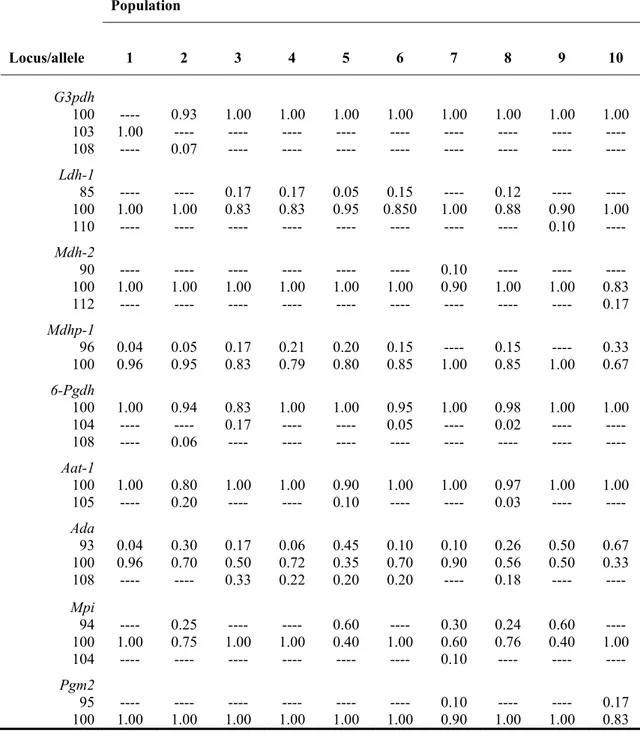
Table 2 Allele frequencies of the allozyme loci found polymorphic among the 10 sampled
populations of Hyla sarda.
Population Locus/allele 1 2 3 4 5 6 7 8 9 10 G3pdh 100 ---- 0.93 1.00 1.00 1.00 1.00 1.00 1.00 1.00 1.00 103 1.00 ---- ---- ---- ---- ---- ---- ---- ---- ---- 108 ---- 0.07 ---- ---- ---- ---- ---- ---- ---- ---- Ldh-1 85 ---- ---- 0.17 0.17 0.05 0.15 ---- 0.12 ---- ---- 100 1.00 1.00 0.83 0.83 0.95 0.850 1.00 0.88 0.90 1.00 110 ---- ---- ---- ---- ---- ---- ---- ---- 0.10 ---- Mdh-2 90 ---- ---- ---- ---- ---- ---- 0.10 ---- ---- ---- 100 1.00 1.00 1.00 1.00 1.00 1.00 0.90 1.00 1.00 0.83 112 ---- ---- ---- ---- ---- ---- ---- ---- ---- 0.17 Mdhp-1 96 0.04 0.05 0.17 0.21 0.20 0.15 ---- 0.15 ---- 0.33 100 0.96 0.95 0.83 0.79 0.80 0.85 1.00 0.85 1.00 0.67 6-Pgdh 100 1.00 0.94 0.83 1.00 1.00 0.95 1.00 0.98 1.00 1.00 104 ---- ---- 0.17 ---- ---- 0.05 ---- 0.02 ---- ---- 108 ---- 0.06 ---- ---- ---- ---- ---- ---- ---- ---- Aat-1 100 1.00 0.80 1.00 1.00 0.90 1.00 1.00 0.97 1.00 1.00 105 ---- 0.20 ---- ---- 0.10 ---- ---- 0.03 ---- ---- Ada 93 0.04 0.30 0.17 0.06 0.45 0.10 0.10 0.26 0.50 0.67 100 0.96 0.70 0.50 0.72 0.35 0.70 0.90 0.56 0.50 0.33 108 ---- ---- 0.33 0.22 0.20 0.20 ---- 0.18 ---- ---- Mpi 94 ---- 0.25 ---- ---- 0.60 ---- 0.30 0.24 0.60 ---- 100 1.00 0.75 1.00 1.00 0.40 1.00 0.60 0.76 0.40 1.00 104 ---- ---- ---- ---- ---- ---- 0.10 ---- ---- ---- Pgm2 95 ---- ---- ---- ---- ---- ---- 0.10 ---- ---- 0.17 100 1.00 1.00 1.00 1.00 1.00 1.00 0.90 1.00 1.00 0.83
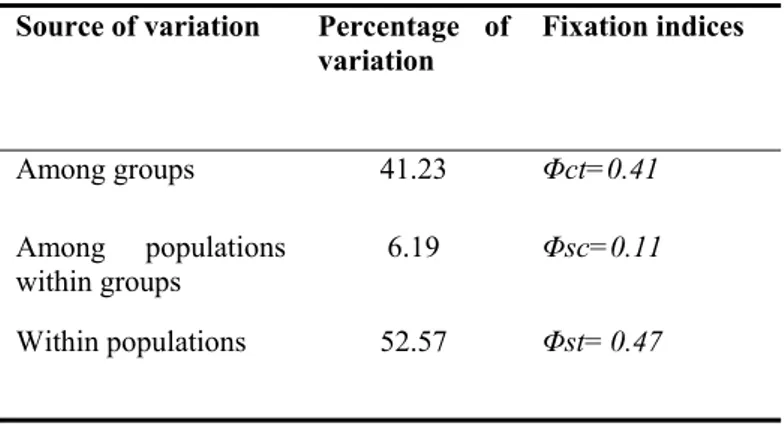
Table 3 Results of the AMOVA analysis for the eight sampled populations of Hyla sarda.
Groups were defined as the two main clusters identified by the both PCA and UPGMA analyses (Fig. 1).
Source of variation Percentage of variation Fixation indices Among groups 41.23 Φct=0.41 Among populations within groups 6.19 Φsc=0.11 Within populations 52.57 Φst= 0.47
Figure 1 (A) Geographic distribution of Hyla sarda and geographic location of the 10
populations sampled. Localities are numbered as in Table 1. (B) UPGMA phenogram showing genetic relationship among the ten populations sampled, based on Nei’s (1978) unbiased genetic distance (DNEI). Bootstrap values >50% after 1,000
pseudoreplicates are shown at the nodes. (C) Principal component analysis of allele
frequencies among the studied samples of Hyla sarda. Only the first principal component (x-axis) was significant (P < 0.01) over 10 000 randomizations. Samples are encoded as in Table 1.
Figure 2 Scatterplots of the genetic [FST/(1-FST)] VS. log-geographic (in km) distances among population pairs of Hyla sarda. (A) all populations; (B) Elba island excluded.
3. M
ULTIPLE LINES OF EVIDENCE FOR DEMOGRAPHIC AND RANGE EXPANSION OF A TEMPERATE SPECIES(H
YLA SARDA)
DURING THE LAST GLACIATION
Roberta Bisconti, Daniele Canestrelli, Paolo Colangelo & Giuseppe Nascetti
A
BSTRACTMany temperate species experienced demographic and range contractions in response to climatic changes during Pleistocene glaciations. In this study we investigate the evolutionary history of the Tyrrhenian treefrog Hyla sarda, a species inhabiting the Corsica-Sardinia island system (Western Mediterranean basin). We used sequence analysis of two mitochondrial (overall 1229 bp) and three nuclear (overall 1692 bp) gene fragments to assess the phylogeography and demographic history of this species, and species distribution modelling (SDM) to predict its range variation over time. Phylogeographic, historical demographic and SDM analyses consistently indicate that H. sarda does not conform to the scenario generally expected for temperate species but rather underwent demographic and range expansion mostly during the last glacial phase. Paleogeographic data and SDM analyses suggest that such expansion was driven by the glaciation-induced increase in lowland areas during marine regression. This unusual scenario suggests that at least some temperate species may not have suffered the adverse effects of glacial climate on their population size and range extent, owing to the mitigating effects of other glaciations-induced paleoenvironmental changes. We discuss previous clues for the occurrence of such a scenario in other species, and some possible challenges with its identification. Early phylogeographic literature suggested that responses to the Pleistocene glacial-interglacial cycles were expected to vary among species and regions. Our results point out that such variation may have been greater than previously thought.
KEYWORDS: glacial expansion, Western Mediterranean, phylogeography, historical demography, ecological niche modelling, Hyla sarda.
3.1 I
NTRODUCTIONPast climate changes have contributed greatly in shaping the current geographic patterns of the distribution and genetic diversity of terrestrial species (Hewitt 2000, Hewitt 2004). Climate change, however, can influence the survival of a species, its distribution and its intra-specific patterns of variation in many ways, both directly and indirectly, as is well exemplified by the growing literature on the ecological and evolutionary consequences of the recent climate change (Davis et al. 2005, Parmesan 2006, Blaustein et
al. 2010). While it is now well established that paleoclimate has influenced the
evolutionary history of species, the importance of various climate-related processes in generating observed patterns of diversity has been less explored. Sea-level oscillation is one such process that has strongly affected the paleogeographic evolution of landscapes. Such oscillations have led to repeated cycles of land bridge formation, merging and separating islands among one another and the mainland, and there is ample biogeographic evidence supporting the relevance of these cycles in the assembly of the current biota (see Thompson 2005, Whittaker & Fernàndez-Palacios 2007, Cox & Moore 2010 and references therin). But sea-level oscillations also affect the shape and extent of coastal plains in many parts of the world, owing to the cycles of withdrawal and advancement of shorelines (Ray & Adams 2001). Arguably, the evolutionary history of species inhabiting these regions, and consequently their genetic structure, is also affected by these climate-related processes (e.g. Canestrelli et al. 2007b, Hofman et al. 2007, Canestrelli & Nascetti 2008, Marske et al. 2009, Sakaguchi et al. 2010).
The paleogeographic evolution of the Western Mediterranean basin has been particularly affected by sea-level oscillations. During the Messinian salinity crisis (5.96-5.33 million years ago) this basin was almost desiccated (Hsü et al. 1973, Krijsman et al. 1999), with major effects on the species distribution patterns in the region (Thompson 2005, Hewitt 2011a). Quaternary climate-driven sea-level oscillations were of lesser extent, but nonetheless, they also had major effects on the Western Mediterranean paleogeography. For instance, during the last glacial maximum (LGM; about 23 000 to 19 000 years ago), when the sea-level dropped to about 120 m below its current level, the islands of several archipelagos, such as Balearic, Dalmatian, Aegean and Corsica-Sardinia were merged, each one forming a single landmass and/or were connected to the continent
(Van Andel & Shackleton 1982, Shackleton et al. 1984). Furthermore, large coastal plains became exposed during this phase, such as those in the east of Spain and Provence (France), east of Tunisia and Libya, south of Sicily, north of the Adriatic sea, northwest of Italy, and those around some (current) archipelagos, such as the Tuscan, Corsica-Sardinia, Balearic and Aegean archipelagos (for descriptions and maps of the coastal paleogeography of the Mediterranean at the LGM, see Van Andel & Shackleton 1982 and Shackleton et al. 1984). Interestingly, although a comprehensive overview of the paleoecological conditions along the Mediterranean coasts during the LGM is still lacking, there is growing evidence for the occurrence of areas of relative ecological stability along the Mediterranean coastal plains, where climatic oscillations were attenuated, and where cold and wet, rather than dry, climatic conditions prevailed (Carrion et al. 2003, Beaudouin
et al 2007, Ricci Lucchi 2008, Hughes & Woodward 2008).
The key role of sea-level lowstands during glacial stages has often been invoked to explain the dispersal patterns of the fauna and flora among the different areas of the Western Mediterranean (Hewitt 2011a). More recently, however, it has also been suggested that these lowstands may have been even more influential on the range dynamics of species, and in shaping the patterns of genetic diversity, than was previously thought. In fact to explain these patterns in some lowland-adapted species, it has been hypothesised that glaciation-induced increases in the extent of coastal plains may have counterbalanced the negative demographic consequences of climatic changes by providing new suitable habitats, and thus leading to net demographic stability or even expansions during these periods (Canestrelli et al. 2007b, Canestrelli & Nascetti 2008, Porretta et al. 2011).
Understanding the likely contributions of these processes to the current patterns of genetic diversity, may allow us to significantly improve our current knowledge regarding the location and extent of glacial refugia, historical demographic trends and the microevolutionary processes that drove them, and the tempo and mode of dispersal events between subregions. Furthermore, this improvement may be particularly important for the Mediterranean region, which is a major global hotspot of biodiversity, and has provided several areas for the long-term persistence of populations in the face of climatic instability (Myers et al. 2000, Medail & Diadema 2009, Blondel et al. 2010).
In this paper, to investigate the plausibility of a positive influence of glaciation-induced increases in the extension of coastal plains on population history trends, we analysed the pattern of genetic variation and carried out species distribution modelling of
the Tyrrhenian tree frog Hyla sarda, a species endemic to the Corsica-Sardinia island system. The Corsica-Sardinian block is in fact especially suitable for this purpose. Not only were these islands long connected throughout the glacial phase, but marine regressions also led to a significant increase of low-altitude areas. For instance, when considering the 0-500 m above sea level (a.s.l.) altitudinal range, the corresponding surface area was about 50% wider during the LGM than during the previous interglacial period (based on data from Jarvis et al. 2008), when the sea level reached about 6 m above its present level (Lambeck & Chappel 2001). Furthermore, the tree frog H. sarda also appears particularly appealing in the context provided above. H.sarda is widespread in the area but with more abundant populations at low and intermediate altitudes. It is mostly linked to a variety of lentic freshwater habitats including pools and temporary ponds. It breeds from spring to early summer, and remains near the breeding sites during most of the year (Lanza
et al. 2007). It is generally considered as having good dispersal abilities, similar to its sister
species Hyla arborea (which can disperse up to more than 10 km/year; see Stumpel & Hanekamp 1986), although these abilities have not been carefully evaluated for H.sarda.
A recent study analysing allozyme variation among 10 populations of this species (Bisconti et al. 2011), reported a genetic pattern including low divergence among populations, high variability within them, and lack of migration-drift equilibrium throughout the species range, which may be consistent with the above scenario. Here, we take advantage of a more extensive sampling throughout the whole species range, of sequence-based mitochondrial and nuclear markers, and of species distribution modelling. We carry out phylogeographic, historical demographic and paleodistribution reconstructions of this species. Our specific aim is to explore the plausibility of a scenario in which the temperate species H. sarda may have benefited from the glacial widening of lowlands areas, preventing or even reversing the demographic and range effects usually expected to be a consequence of the glacial climate.
3.2 M
ATERIALS AND METHODS3.2.1SAMPLING AND LABORATORY PROCEDURES
We sampled 174 individuals of Hyla sarda from 22 populations spanning its range. The geographical references and sample size of all sampled population are given in Table 1 and Figure1. Tissue samples were collected as toe clips and preserved in 95% ethanol until DNA extraction. All individuals were then released at the point of collection.
We extracted whole genomic DNA using proteinase K digestion followed by a standard phenol-chloroform protocol with RNase treatment (Sambrook et al. 1989). Polymerase chain reactions (PCR) were carried out to amplify fragments of two mitochondrial genes (cytochrome b, herein referred to as cyt b; NADH dehydrogenase subunit 1, herein referred to as ND1), and three nuclear genes (recombination-associated gene 1, RAG; ribosomal protein L9 intron 4, RPL; protein phosphatase 3 intron 4, PPP3). PCR cycling conditions were the same for all genes: 5 min at 92° C followed by 30 cycles of 1 min at 92° C, 1 min at the annealing temperature specific for each gene, and 90 s at 72° C, followed by a single final step of extension of 10 min at 72° C. Amplifications were conducted in 25 µL containing the following: MgCl2 (2.5 mM), a reaction buffer (1X; Promega), 4 dNTPs (0.2mM each), 2 primers (0.2μM each), an enzyme Taq polymerase (1 unit; Promega) and 2 μl of DNA template. The annealing temperatures and primer sequences (taken from the literature or designed for this study) for each gene fragment are given in Table 2. PCR products were purified and sequenced by Macrogen Inc. (http://www.macrogen.com) using an ABI PRISM 3700 sequencing system. All sequences
were deposited in GenBank (accession numbers: JN787963- JN88172).
3.2.2GENETIC DATA ANALYSIS
We checked the electropherograms visually using the program CHROMAS 2.31
(Technelysium ltd.) and carried out sequence alignment using CLUSTALX (Thompson et al.
1997). Nuclear sequences that were heterozygous for more than 1 nucleotide position were phased using PHASE, whereas the possible occurrence of recombination was assessed for
implemented in SPLITSTREE V.4.11(Huson & Bryant 2006). All subsequent analyses were
carried out using phased nuclear data and indels treated as missing data.
To verify the existence of significant heterogeneity in the phylogenetic signal between the two mtDNA fragments we carried out a partition-homogeneity test (Farris et
al. 1994) using the software PAUP * 4.0B10 (Swofford 2003). Since no significant
differences were detected, we used the combined mtDNA dataset for all subsequent analyses.
Sequence variation was analysed using MEGA 5.1, whereas nucleotide (π) and
haplotype (h) diversity (Nei 1987) were computed using the software DNASP 5 (Librado &
Rozas 2009). Furthermore, in order to compare estimates of haplotype diversity between the two larger islands (i.e. Sardinia and Corsica) taking into account their different sample sizes, we applied a rarefaction procedure (El Mousadik & Petit 1996) and estimated the allelic richness using the software CONTRIB 1.02 (Petit et al. 1998).
The phylogenetic relationships among haplotypes were investigated using the statistical parsimony procedure for phylogenetic network estimations implemented in TCS
1.21 (Clement et al. 2000), with a 95% criterion for a parsimonious connection. We preferred using a network-building procedure over tree-building procedures, as it provides a more accurate estimate of intra-specific gene genealogies, especially in cases of shallow genetic divergence among haplotypes (Posada & Crandall 2001). To solve for ambiguities in haplotype networks (represented by loops) we applied empirical criteria derived from coalescent theory (see Pfenninger & Posada 2002 and references therein).
The best-fit model of sequence evolution was selected for each dataset among 88 models using the Akaike Information Criterion (AIC) as implemented in JMODELTEST
(Posada 2008). This method suggested the TrN+Γ model (gamma distribution shape parameter=0.187) as the best fit for the mtDNA dataset, and HKY+I+ Γ (proportion of invariable sites=0.54; gamma distribution shape parameter =0.09), HKY and HKY+I+Γ (proportion of invariable sites=0.91; gamma distribution shape parameter =0.43) for the RPL, RAG and PPP3 genes respectively (Hasegawa et al. 1985, Tamura & Nei 1993). Nevertheless, since a gamma distribution already allows for sites with very low rates, we did not include a proportion of invariable sites during subsequent analyses (see Ren et al. 2005, Yang 2006).
A least-squares method (LS) recently described by Xia and Yang (2011) and implemented in the software DAMBE (Xia & Xie 2001) was used to estimate the time to the
most recent common ancestor (TMRCA), as well as the mean substitution rate for mtDNA data useed in subsequent analyses of historical demography. We chose to focus on mtDNA, as we had a larger data matrix for mtDNA than for individual nuclear genes, and because mtDNA evolves faster than nuclear genes do; thus mtDNA it is expected to contain more information to rely upon (see Heled 2010). A likelihood-ratio test was carried out with DAMBE to assess whether the sequences in our dataset can be reliably assumed to
have diverged in a clock-like manner. Based on this te
s
t, the null hypothesis, which states that there are no differences in the evolutionary rates among lineages, cannot be rejected. To carry out the LS procedure, a phylogenetic tree topology and at least one calibration point are necessary. The phylogenetic tree topology was obtained using the maximum-likelihood method as implemented in PHYML (Guindon 2004), with the model of sequenceevolution suggested by JMODELTEST, default options used for all other settings, and the
closely related species H. arborea used as an outgroup. As a calibration point, we set the root of the tree to 5.33 million years, corresponding to the end of the Messinian salinity crisis and the consequent re-flooding of the Mediterranean basin. Based on fossil records (Kotsakis 1980) and the biogeographical and phylogenetic patterns for the Western Palearctic tree frogs (Stock et al. 2008), this historical event has been indicated as the most plausible cause of divergence between H. sarda and the continental species H. arborea. The analysis with DAMBE was run using the MLCompositeTN93 genetic distance
(following suggestions in Xia & Yang 2011), a softbound option for the calibration point, along with 1000 bootstrap re-samplings to obtain the standard deviations of the estimates.
We used the simulated annealing procedure implemented in SAMOVA (Dupanloup et
al. 2002) to define the groups of populations that are geographically homogeneous and
maximally differentiated from each other. We carried out the analysis with the number of groups (K) ranging from 2 to 10, and assessed the optimal K as the one for which FCT (i.e. the genetic variance due to divergences between groups) was the highest and significant. To verify its consistency, we ran the analysis five times for each K value with 1000 independent annealing processes. Afterward, analyses of the molecular variance (AMOVA; Excoffier et al. 1992) were carried out with the software ARLEQUIN 3.11
(Excoffier et al. 2005), using groupings suggested by SAMOVA and the best-fit models of
sequence evolution as indicated by JMODELTEST.
The demographic history of the Tyrrhenian tree frog was explored by means of an Extended Bayesian Skyline Plot analysis (EBSP; Heled & Drummond 2008) using the
software BEAST 1.6.1 (Drummond & Rambaut 2007). The EBSP has an important
advantage over previous skyline methods: it allows the simultaneous analysis of data from multiple unlinked loci, taking into account their specific mode of inheritance, thus significantly improving the reliability of demographic inferences (Heled & Drummond 2008, Ho & Shapiro 2011). The EBSP analysis was run using clock models, substitution models, and trees unlinked across all markers, with the substitution rate previously estimated for the mtDNA fragment used as a stable reference for all other markers (see Heled 2010). A strict molecular clock was enforced, as it is generally a good approximation for analyses at the intra-population level (Yang 2006), and since, by simplifying the coalescent model, it helps analyses to converge (Heled 2010). The analysis was run three times to check for convergence, with 1.5 x 10⁸ generations sampled for every 5 x 10³ generations in each run. Convergence, stationarity, effective sample size for each parameter of interest in the analysis, and the appropriate burn-in were evaluated using the software TRACER 1.41 (Rambaut & Drummond 2008). Moreover, we constructed a
histogram describing the locations of the X-axis points of the demographic functions (i.e. with the bars’ height proportional to the number of demographic functions having an X-point at each interval of time; see Heled 2010), and we considered the EBSP demographic reconstruction to be reliable, backward in time until the first time interval with fewer than two data points.
Finally, the occurrence of past demographic changes was also assessed for each dataset separately by computing the statistics FS (Fu 1997) and D (Tajima 1989) using the software DNASP. The significance of the FS and D values was assessed through 1000 coalescent simulations, carried out under the hypothesis of selective neutrality and population equilibrium. As suggested by Fu (1997), the 2% cut-off criterion was used to assess the 5% nominal level of significance of the estimated FS values.
3.2.3SPECIES DISTRIBUTION MODELLING
Species distribution models for H. sarda were generated using MAXENT 3.3.3e
(Phillips et al. 2006). MAXENT is a program for maximum entropy modelling of the
geographic distributions of species; it combines presence-only data with ecological-climatic layers to predict species occurrence in areas where data points are unavailable. We used MAXENT to predict species occurrence under both present-day and LGM conditions.
Although potentially useful for this study, we avoided making predictions for the last interglacial phase (about 135 000-115 000 years before present; ybp), due to a lack of detailed bioclimatic data for this period. However it is worth mentioning that paleoclimatic conditions during this period were in many respects similar to current ones in the western Mediterranean basin (Bardaji et al. 2009 and references therein).
Since our specific aim was to predict the potential effect of sea-level drop during the last glacial phase, the models were built by considering only the Corsica-Sardinia microplate, i.e. an area that was largely and persistently connected into a single landmass during the Pleistocene glaciations.
A total of 190 localities were used to build the models. These localities included our own collection sites (20 localities), plus 170 additional sites drawn from the literature that we deemed reliable since detailed geographic data were provided by the authors. We built the models using the default parameters for convergence threshold (10-5) and number of iterations (500). To ensure the consistency of the model predictions, 75% of the localities were used to train the model and 25% were used to test it.
The ecological layers for the present conditions (resolution 30 arc-seconds) and data for LGM (resolution 2.5 arc-minutes) were downloaded from the WorldClim database website (www.worldclim.org). For LGM prediction we used data from both the Community Climate System Model (CCSM) and the Model for Interdisciplinary Research on Climate (MIROC). The WorldClim database provides 19 bioclimatic variables. We built two models, one using the entire set of variables, the other using only those layers that we considered biologically significant for H. sarda and that were not strongly correlated to each other (Pearson correlation coefficient, r2 <0.80). These layers included the following: BIO2, mean diurnal range in temperature; BIO3, isothermality (monthly/annual temperature range); BIO4, temperature seasonality (standard deviation *100); BIO7, annual range in temperature; BIO8, mean temperature of the wettest quarter of the year; BIO11, mean temperature of the coldest quarter; and BIO16, precipitation of the wettest quarter of the year.
The model performance was evaluated using the area under the Receiver Operating Characteristic (ROC) curve (AUC) calculated by MAXENT. Furthermore, to select the
model that best-fit the data, we compared the two models using the Akaike Information Criterion (AIC) as implemented in the software ENMTOOLS (Warren et al. 2010, see Warren
Finally, to allow a comparison of the area extensions of predicted presence between the present day and LGM, we also generated threshold models, using the ‘minimum training presence’ option for presence/absence prediction.
3.3 R
ESULTS3.3.1GENETIC DATA
The final mtDNA dataset included 531 bp of the cyt b gene (34 variable positions, 19 parsimony informative) and 698 bp of the ND1 gene (50 variable positions, 19 parsimony informative) sequenced across 169 individuals. The nuDNA dataset included 586 bp (29 variable positions, 17 parsimony informative) for the RPL gene, 480 bp (16 variable positions, 13 parsimony informative) for the PPP3 gene and 626 bp (10 variable positions, 7 parsimony informative) for the RAG gene, sequenced across 59, 81 and 62 individuals, respectively. No recombination events were indicated by the PHI tests carried out on the nuclear gene fragments. At the level of the entire dataset, 62 haplotypes were found in the mtDNA, 29 in the RPL, 25 in the PPP3 and 10 in the RAG.
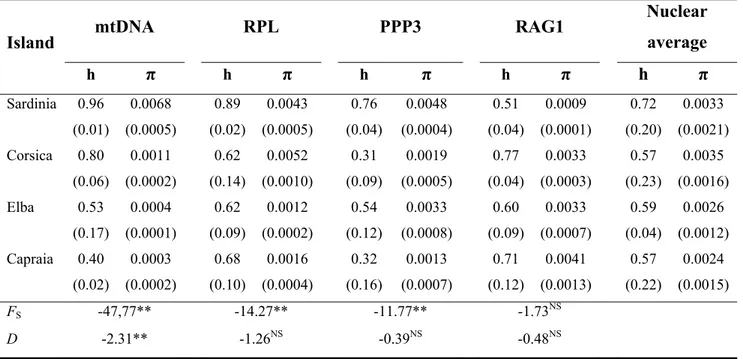
Estimates of nucleotide (π) and haplotype (h) diversity for each marker in each sampled island are given in Table 3. For the mtDNA, the highest levels of both π and h were observed for the island of Sardinia. On the other hand, for the nuDNA, h was also, on an average, higher on Sardinia than elsewhere, while almost identical values of mean π were observed between Sardinia and the island of Corsica. At all the markers studied but the RAG, also the allelic richness was higher in Sardinia (mtDNA: 16.0; PPP3: 11.6; RPL: 5.8; RAG: 2.0) than in Corsica (mtDNA: 5.0; PPP3: 1.0; RPL: 2.0; RAG: 5.0).
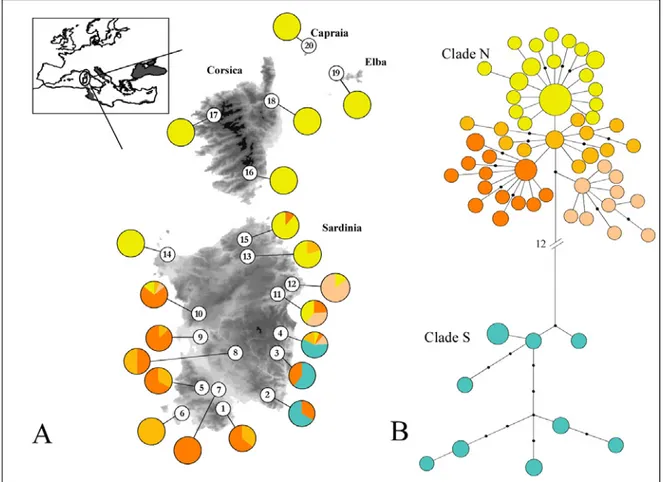
The statistical parsimony network showing the phylogenetic relationships between mtDNA haplotypes is shown in Fig. 1B. All the haplotypes were connected into a single network. Two main group of haplotypes were identified, clade N and clade S, whose geographic distributions are shown in Fig. 1A. The most represented at the level of the entire dataset was clade N, with 53 haplotypes of the total 62 haplotypes found. This clade was geographically distributed throughout the range of the species. Four star-like structures (SLS) were observed within clade N, separated from one another by no more than 3 nucleotide positions. One of these SLS (yellow of Fig. 1B) included the only haplotypes observed on the islands of Corsica, Elba and Capraia, besides being the most abundant among the northern Sardinian samples. The other 3 SLS were restricted to Sardinia, with a mostly central and southern distribution. Clade S, separated by 12 inferred haplotypes from clade N, was represented by 9 haplotypes, and was geographically restricted to the three

![Figure 2 Scatterplots of the genetic [F ST/(1-FST)] VS. log-geographic (in km) distances among population pairs of Hyla sarda](https://thumb-eu.123doks.com/thumbv2/123dokorg/2791511.1681/26.892.132.788.106.360/figure-scatterplots-genetic-geographic-distances-population-pairs-hyla.webp)