1
Dipartimento di Scienze e tecnologie per l’agricoltura, le foreste,
la natura e l’energia
(DAFNE)
CORSO DI DOTTORATO DI RICERCA BIOTECNOLOGIE VEGETALI- XXIV Ciclo
TUSCIA UNIVERSITY- VITERBO
DEPARTMENT OF SCIENCE AND TECHNOLOGIES FOR AGRICULTURE, FORESTRY, NATURE AND ENERGY (DAFNE)
PhD Course in
PLANT BIOTECHNOLOGY - XXIV CYCLE
2012
Molecular linkage map in an intraspecific recombinant inbred population
of durum wheat
(Triticum turgidum L. var. durum)
Sigla del settore scientifico-disciplinare AGR/07
Coordinator
Prof. Stefania Masci
Tutors
Prof. Mario A. Pagnotta
Prof. Renato D’Ovidio
Dottorando:
0
In
In
In
In the
the
the
the name
name
name of
name
of
of
of
G
God
G
G
od
od
od
Acknowledgements
I would be remiss if I did not thank my God and Savior. There were many times that I called on His name for help, comfort, and guidance; He was always right at my side.
I have been truly blessed to work with the best supervisor and scientist: Prof. M.A. Pagnotta. I wish to express my sincerest gratitude to him, for his continuous involvement, supervision, encouragements, patience, devotion, and advices. Not only did he provide professional guidance but extended my horizon to integrate multi-disciplinary approach in research.
I would like to thank him again for his strong support, friendship, and for giving me the opportunity to conduct research and work in his program with scientific freedom; and instill in me the love of Durum. I would like also to express special thanks to my professors/ supervisors Prof. R. D’Ovidio, Pr. M. Nachit, Proffe. S. Masci for their support, kindness, encouragements, constructive criticism, help, and friendship. Their welcoming was always warm, cordial, and friendly. It was a great opportunity to get to know this kind people.
Sincere appreciations and thanks are extended to my colleagues in ENEA and Tuscia Unuversity: Dott. L.Mondini, M. Abdolhosseini for their help, friendship, and pleasant way of working. I am thankful to Les Program leader and staff of ICARDA, wheat program.
I gratefully acknowledge ICARDA for their financial support through their Durum Breeding Program in Aleppo/ Syria.
And also so much thanks to my family for they have given everything to me and supported my distance.
1
LIST OF CONTENTS pages
Introduction ... 7
Chapter I: Introduction ... 10
1- PLANT OF WHEAT ... 11
1- 1- The origin of wheat ... 11
1- 1- 1- Natural mutants... 12
1- 2- Structure and development of Cereal plant ... 12
1- 3- Wheat plant description ... 14
1- 3- 1- The grain ... 15 1- 3- 2- Tillers ... 15 1- 3- 3- The roots ... 16 1- 3- 4- The stem ... 16 1- 3- 5- The ear ... 16 1- 4- Seed treatment ... 18
1- 5- Wheat, permitted the rise of Civilization ... 19
1- 5- 1- Emmer ... 19 1- 5- 2- Einkorn ... 20 1- 5- 3- Spelt ... 20 1- 5- 4- Bread wheat ... 20 1- 6- Wild wheat ... 21 1- 6- 1- Triticum dicoccoides ... 22 1- 7- Cultivated wheats... 23 1- 7- 1- Diploid wheat ... 24 1- 7- 1- 1- Triticum monococcum ... 24
1- 7- 2- Tetraploid Wheat- Triticum durum ... 25
1- 7- 3- Hexsaploid wheat ... 28
1- 8- ICARDA Center ... 29
1- 8- 1- Origin of different tetraploid wheat from ICARDA ... 29
2- POPULATION AND MARKER ... 30
2- 1- The population ... 30
2- 1- 1- Population size ... 31
2- 1- 2- Segregating populations (F2, F3 and Backcross) ... 31
2- 1- 3- BIL Population ... 31
2- 1- 4- DH Population ... 32
2- 1- 5- RIL Population ... 33
2- 1- 6- NIL Population ... 34
2- 2- Developing breeding population... 34
2- 3- Applications of molecular markers ... 34
2- 4- Molecular marker techniques ... 36
2- 4- 1- Non- PCR Based Techniques ... 37
2- 4- 1- 1- Restriction Fragments Length Polymorphism (RFLP) ... 37
2- 4- 2- PCR-Based Techniques ... 37
2- 4- 2- 1- Inter simple sequence repeat (ISSR) ... 39
2- 5- Microsatellites (SSR) ... 39
2- 5- 1- Explanation of the SSR markers ... 39
2
2- 5- 3- SSR markers in the Wheat ... 42
2- 6- Single nucleotide polymorphism (SNP) ... 42
2- 6- 1- Explanation of the SNP markers... 42
2- 6- 2- SNP-EST ... 44
2- 6- 3- SNP markers in the Wheat ... 44
2- 7- Comparison between SSR and SNP molecular markers ... 45
2- 8- Target specific genomic regions ... 46
2- 9- New generation sequencing ... 46
2- 9- 1- Association mapping using natural populations ... 48
2- 9- 2- Perspectives on genetic mapping and DNA markers... 49
3- GENETIC MAP... 51
3- 1- Genetic mapping ... 51
3- 2- Mapping the genome of wheat ... 52
3- 2- 1- Genetic maps of wheat through molecular markers ... 55
3- 3- The size of the wheat genome (tetraploid and hexaploid) ... 57
3- 4- ITMI map and inter varietal crosses ... 59
4- SEGREGATION OF MARKERS IN WHEAT CHROMOSOME... 61
4- 1- Computer software for genetic mapping ... 61
4- 2- Relationship between DNA marker and cytogenetic maps ... 62
4- 3- Distorted segregation of molecular markers ... 62
4- 4- Nonrandom segregation of nonhomologous chromosome ... 63
Chapter II: Material & Methods ... 66
1- Plant Material... 67
1- 1- Plant Material... 67
1- 2- DNA ... 67
1- 2- 1- Station of agricultural species (Tel Hadya Station): ... 69
1- 2- 2- Experimental Design ... 69
1- 3- SSR Markers ... 69
1- 4- Markers Screening and Amplification ... 72
1- 5- SNPs Identification: Multialignments and primer design ... 75
1- 5- 1- PCR conditions, sequencing and SNPs characterization ... 78
1- 6- Data analysis and linkage map construction ... 79
Chapter III: Results & Discussion ... 81
1- MOLECULAR MARKERS ... 82
1- 1- Molecular Markers in the population of Jennah Khetifa/ Cham I × Omrabi5/ T. dicoccoides600545//Omrabi5 ... 82
1- 1- 1- Overview of the genetic linkage map ... 82
1- 2- Microsatellite (SSR) markers analysis... 83
1- 3- Allele size differences in the SSR markers... 85
1- 4- The distribution of SSR markers ... 87
1- 5- Segregation distortion of SSR markers... 88
1- 6- Clustering of markers (SSR, SNP) ... 93
1- 7- The RILs distribution between parents for all markers ... 94
1- 8- Frequency of RILs with parental (non-recombinant) chromosome ... 96
3
1- 9- Characterization of (CT/GA)n and (GT/CA)n SSRs in our map ... 97
1- 10- The distribution of SNP markers ... 99
2- MAP CONSTRUCTION ... 102
2- 1- Genetic map ... 102
2- 2- Chromosomes and genomes ... 103
2- 3- Difference between “A” and “B” genomes ... 109
2- 4- Changes in location of markers ... 110
2- 5- Negative crossover interference ... 111
2- 6- Isogenic line and some trait ... 112
2- 6- 1- Gene transfer intra specie ... 113
3- HOMEOLOGOUS GROUP ... 114
3- 1- Homoeologous group one (1A, 1B)... 114
3- 2- Homoeologous group two (2A, 2B) ... 115
3- 3- Homoeologous group three (3A, 3B) ... 116
3- 4- Homoeologous group four (4A, 4B) ... 117
3- 5- Homoeologous group five (5A, 5B) ... 118
3- 6- Homoeologous group six (6A, 6B) ... 119
3- 7- Homoeologous group seven (7A, 7B) ... 120
4- COMPARISON OF PRESENT MAP, WITH THE OTHER MAPS ... 121
4- 1- Maps comparison ... 121
4- 2- High conserved order of microsatellite loci and structural changes of Chromosomes ... 124
4- 3- Transferability of the markers ... 129
4- 4- Parallel mapping in related taxa ... 130
5- IMPORTANT TRAITS ... 132
5- 1- The explanation of the traits and characters ... 132
5- 2- Explanation of the traits associated with markers ... 132
5- 2- 1- The explanation of Traits - Grain Size and Grain Shape ... 132
5- 2- 2- The explanation of Trait - PPO (Poly Phenol Oxidases) Pigment Color ... 135
5- 2- 2- 2- Quality of Pasta derivatives from durum wheat ... 137
5- 2- 3- The explanation of Trait - LOX ... 139
5- 2- 4- The explanation of Traits - GYPC, SC, PC ... 141
5- 2- 5- The explanation of Trait - GPC ... 142
5- 2- 6- The explanation of Trait - Rust Disease ... 144
5- 2- 7- The explanation of Trait - Photoperiod ... 146
5- 2- 8- The explanation of Trait - Growth ... 148
Chapter IV: General Discussion & Conclusion ... 152
4
INDEX OF TABLES pages
Table 1.1: Shoot structures to identify cereals and selected weeds.. ... 18
Table 1.2: Durum use and quality requirements in different part of the world (Nachit et al. 1992). ... 27
Table 1.3: The Molecular linkage maps have been constructed in different organisms. ... 52
Table 1.4: The map of Somers et al. 2004, consensus map. ... 60
Table 2.1: Origin of Cultivar and wild Species. ... 69
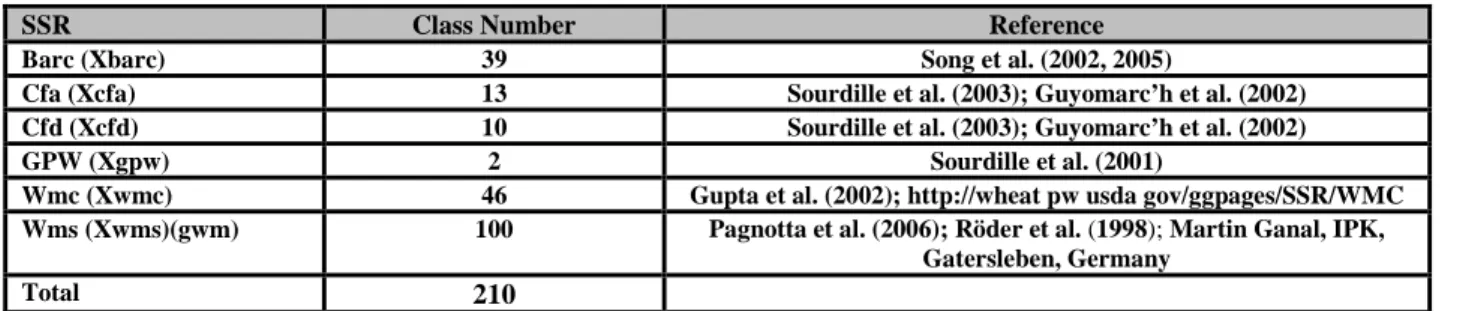
Table 2.2: The number of SSRs markers used in this work. ... 70
Table 2.3: The indications for Origins and references of SSR markers. ... 70
Table 2.4: Probed Polymorphic Microsatellites sequences and their optimal amplification program in Jennah.Ketifa/ChamI × Omrabi5/T.dicoccoides600545//Omrabi5. ... 71
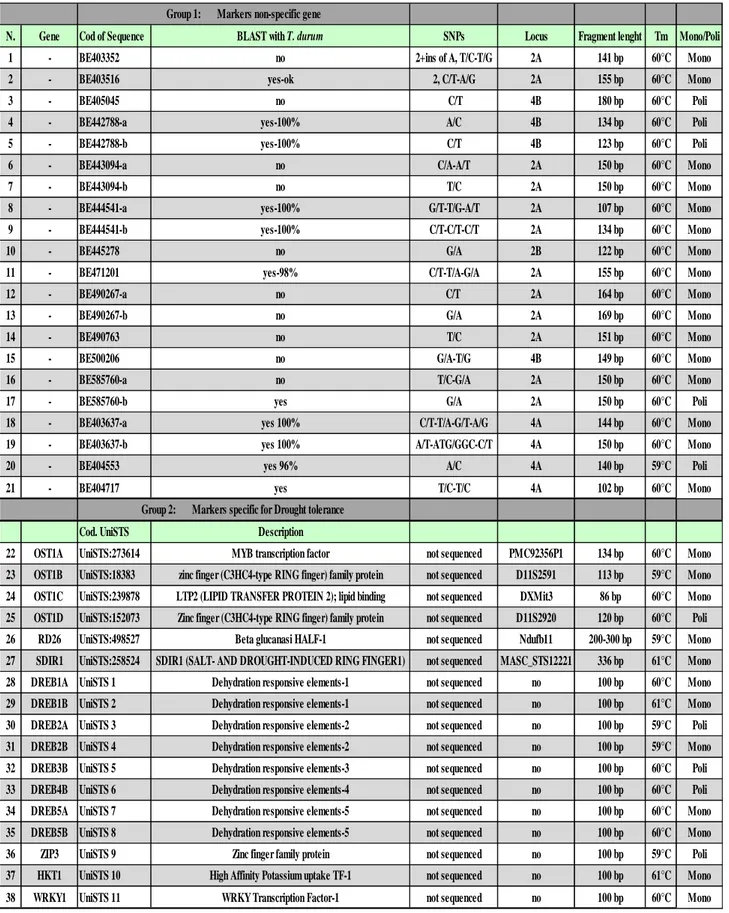
Table 2.5: SNP markers used correctly for the construction of our map came from the two-class. ... 77
Table 3.1: Number of generated and mapped SSR fragments and their chromosomal assignment in the Omra/dicoccoides//Omrabi5×Jennah.Khetifa/ChamI population in comparison with wheat published maps 85 ...
Table 3.2: Origin of the microsatellites markers used in this study. ... 87
Table 3.3: Distribution of SSRs markers in each of chromosome for similarity to parents... 90
Table 3.4: Distribution of SSRs markers in the homoeolougus group two for similarity to parents, Hetrozigosity and non positive result, in percentage. ... 91
Table 3.5: Number of durum wheat First Parental (J.K/C1) x durum wheat, Second Parental (O5d/O5) RILs with parental (non-recombinant) chromosomes ... 96
Table 3.6: The table indicates the percentage of repeated motifs in the total number of markers, Polymorphic markers and homoeologous groups. ... 98
Table 3.7: Chromosome assignment, distribution of markers, length of linkage groups, and marker density in genetic map constructed with the J.K/C1 × O5d/O5 recombinant inbreed line population ... 112
Table 3.8: Islands of Negative Interference along the Chromosomes ... 112
Table 3.9: Comparing the SSR markers on the maps of tetraploid and hexaploid wheat, with our markers and shown the similarity between these main maps and our map. ... 123
Table 3.10: Comparison of allele size differences among mapping parents and microsatellite sources. SE Standard error. ... 124
Table 3.11: Comparison of map length (cM) of tetraploid wheat genome in various linkage maps generated in different mapping populations, a Mapping populations: (1) durum wheat × wild emmer wheat, (2) durum wheat × durum wheat, (3) bread wheat × bread wheat. ... 128
Table 3.12: Association of Markers with the characters and Traits. J.K/C: First parental: Jennah Khetifa/ChamI, Od/O: Second parental: Omrabi5//dicoccoides/Omrabi5. ... 150
Chapter I
Chapter III Chapter II
5
INDEX OF FIGURES pages
Figure 1.1: The distribution of industrial plant in the world (FAO, 2010). ... 11
Figure 1.2: Schematic diagram of a mature wheat plant high1 ... 17
Figure 1.3: Schematic diagram of a mature wheat plant high2 ... 17
Figure 1.4: Schematic diagram of a mature wheat plant high3 ... 17
Figure 1.5: Structures of the wheat inflorescence (spike or ear), spikelet and floret of the wheat plant ... 17
Figure 1.6: A diagrammatic representation of the current theory of the evolution of wheat (Wheat Genetics Resource Center web site: http://www.ksu.edu/wgrc).. ... 22
Figure 1.7: The distribution of the wheat in the world, Top ten wheat producers-2010(million me…).. ... 25
Figure 1.8: World durum wheat trade forecast (CWB, 2008). ... 26
Figure 1.9: Center of crop origin, for plant genetic diversity, and ICARDA region contains. ... 26
Figure 1.10: Different reaction of different marker on the gel electrophoresis ... 36
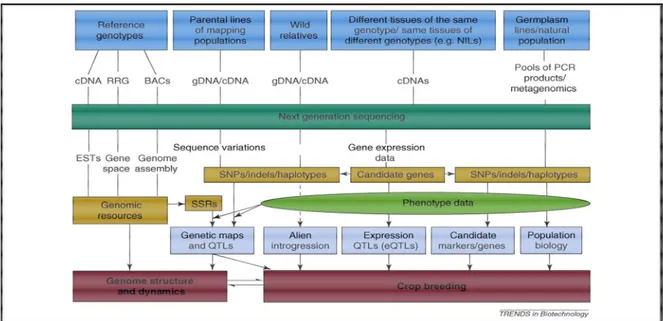
Figure 1.11: Overview of NGS applications in crop genetics and breeding. ... 48
Figure 2.12: The different type of Triticum turgidum L. subsp. durum. ... 68
Figure 2.13: The figure and the drawing for our cross between the three cultivar varieties of durum wheat and one wild varieties of durum wheat. ... 68
Figure 2.14: Meteorological data Average of 1999/2009, Min. temp = minimum temperature; Evap. = evaporation; Max. temp = maximum temperature ... 69
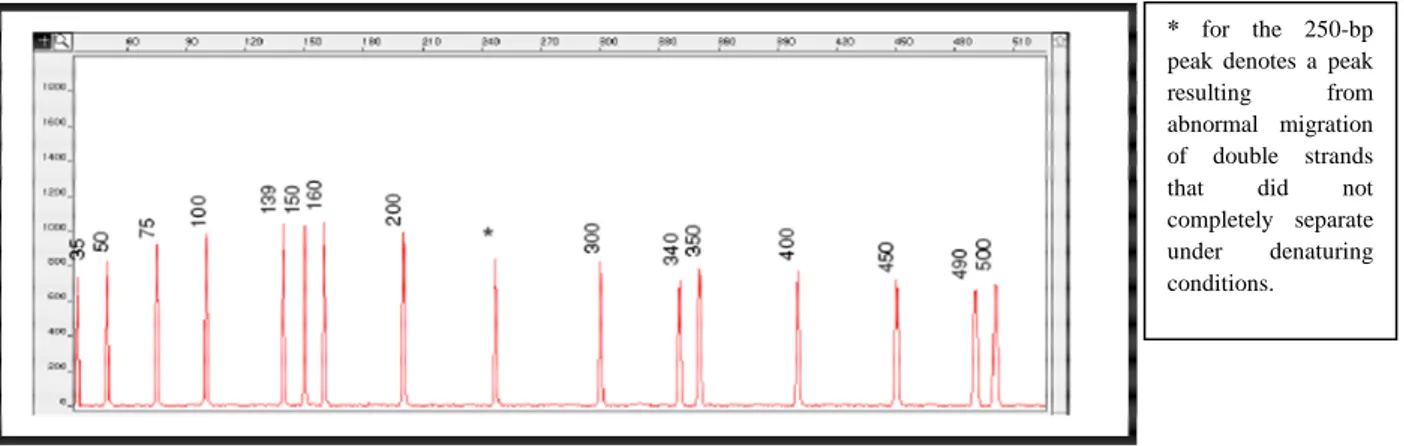
Figure 2.15: Electro program of the GeneScan-500 size standard run under denaturing conditions on the ABI PRISM 310 Genetic Analyzer... 74
Figure 2.16: Imagines of robot and sequencing. ... 74
Figure 2.17: The procedure to make the Blast and in the following construction of SNP primers. ... 75
Figure 2.18: An example of a multi-alignment of sequences used to design primers and different plots of melting curves showing the polymorphism. ... 78
Figure 3.1: Identification of SSR markers to be polymorphic and monomorphic between our two parental (J.K/C1) × (O5.d/O5) ... 84
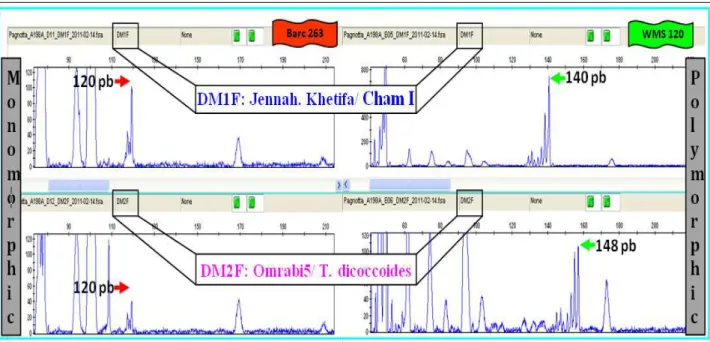
Figure 3.2: Graphs on the left came from genemapper V.4.0 evidenced by a peak with a size equal for both parents (Barc263). But the graphs on the right showed two different sizes for screening of relatives (WMS) ... 84
Figure 3.3: Analyzed WMS291 Marker on the RIL n.131 and n.113 with FAM florescent trough of Genemapper V.4.0. ... 85
Figure 3.4: The differences size between two alleles of homologous chromosomes. ... 86
Figure 3.5: The average of differences between parents in allele size: (a) different homeologous groups, (b) different SSR markers group, (c) different SSR markers group. Homeologous groups and chromosoms brought together in the same graphical to compare their variability with their average. ... 86
Figure 3.6: Distribution of the fragments amplified through (a) monomorphic markers, (b) polymorphic markers. For the similarity of parents in the 18 RILs (76-93). ... 87 Figure 3.7: Allele frequencies as a function of the genetic linkage map along chromosomes 2A, 2B,
4A and 6A, The x-axis indicates the segregation distortion from the 1:1 ratio observed for each marker, and the y-axis corresponds to the genetic linkage map, Markers marked with crossed square indicate the significance threshold of P < 0.05, (a) chromosome 2A that the majority of markers are distributed to the first parental, (b) chromosome 2B that the majority of markers in the short arm are distributed to the first parental, and long arm to the second parental, (c) chromosome 4A that the majority of markers are distributed to the first parental, (d) chromosome 6A that the majority of markers are distributed to the second parental. Segregationdistortion between 0.45- 0.55 (45%-55%) frequency of
Chapter II
Chapter III Chapter I
6
alleles,: Frequency of alleles between first and second parental, :Frequency of alleles
nearby first parental, Frequency of alleles nearby first parental. ... 89
Figure 3.8: Distribution of SSRs markers in the homoeolougus group two for similarity to parents and Hetrozigosity Similar of first parental, Similar of second parental, Hetrozigosity. ... 91
Figure 3.9: Different distribution of SSRs marker in Chromosome, Homoeologous, genome and all the two genomes, // Similar to first parental, // Similar to second parental. ... 92
Figure 3.10: Distribution of SSR and SNP loci along chromosomes 2A, 2B, and 4B of the of the (J.K/C1) x (O5d/ O5) genetic map. ... 94
Figure 3.11: The distribution of the 192 RILs the percentage similarity with (a) First Parental J.K/C1, (b) Second Parental O5d/O5,() with high similarity to the parental, (4, 5, 27, 62, 147 and 150 RILs number do not exist).. ... 95
Figure 3.12: The dispersion of RILs number in the percentage of similarity (a) to the first Parental (b) to the second Parental. and the equation of the line in this dispersion of 192 RIL. ... 95
Figure 3.13: The identification numbers of RIL or genotypes for the similarity (a) to the first parental (b) to the second Parental (c) the number of genotypes represented from both parents, These arrows indicated the RIL numbers preferable (superior) in each of the three groups, the similarity of the first parent, the similarity of the second parent. ... 95
Figure 3.14: Occurrence of parental chromosomes (non-recombinant chromosome) in the mapping data set set as associated with chromosome length (cM)... 96
Figure 3.15: The repetition (times) of the SSR motifs (a) in the total and polymorphic markers (b) in differences homoeologous group. ... 98
Figure 3.16: Distribution of SNPs by the type of nucleotide substitutio transitions(C/T; A/G) and transversions (C/A; C/G; T/A; T/G) ... 100
Figure 3.17: (a) The percentage of polymorphism and monomorphism in the total number of SNP markers, (b) The distribution of SNP markers for the similarity to the two parental and the central part which shows the percentage of heterozygosity. ... 100
Figure 3.18: Charts to (a) identify Polymorphic SNPs, (b) identify SNPs. ... 100
Figure 3.19: Indication Genetic map of tetraploid wheat (Triticum durum). ... 105
Figure 3.20: Location of some markers in our map that changed positions ... 111
Figure 3.21: (a) The number of total monomorphic and polymorphic SSR markers. (b) The percentage of polymorphic markers (SSR) in different homoelogus group (1-7). (c) The percentage of monomorphic and polymorphic markers (SNP), and the polymorphic markers devising in two class [Group of 4 or other group (1, 2, 3, 5, 6, and 7)] ... 114
Figure 3.22: Total number of markers used and division between monomorphic and polymorphic in homoeologous group one compared to other homoeologous groups... 115
Figure 3.23: Total number of markers used and those monomorphic or polymorphic in homoeologous group two compared to other homoeologous groups. ... 116
Figure 3.24: Total number of markers used and those monomorphic or polymorphic in homoeologous group three compared to other homoeologous groups. ... 117
Figure 3.25: Total number of markers used and those monomorphic or polymorphic in homoeologous group four compared to other homoeologous groups. ... 118
Figure 3.26: Total number of markers used and those monomorphic or polymorphic in homoeologous group five compared to other homoeologous groups. ... 119
Figure 3.27: Relationship between the percentage of recombination and distances between markers ... 120
Figure 3.28: Total number of markers used and those monomorphic or polymorphic in homoeologous group six compared to other homoeologous groups . ... 120
Figure 3.29: Total number of markers used and those monomorphic or polymorphic in homoeologous group seven compared to other homoeologous groups ... 120
Figure 3.30: (a) The confrontation of our map with the map of Kofa × UC1113 population in chromosome 1A, (b) The confrontation of our map with the map of J.K × Cham II population in chromosome 1A, (c) The confrontation of our map with the map of Messapia × dicoccoides population in chromosome 1A, (d) The confrontation of our map with the map of Omrabi5 × dicoccoides population in chromosome 1A.. ... 125
7
Figure 3.31: (a) The confrontation of our map with the map of Synthetic × Opata population in chromosome 1A. (b) The confrontation of our map with the map of Synthetic × Opata
population in chromosome 2A... 126
Figure 3.32: (a) The confrontation of our map with the map of Kofa × UC1113 population in chromosome 2A. (b) The confrontation of our map with the map of J.K × Cham II population in chromosome 2A. (c) The confrontation of our map with the map of Messapia × dicoccoides population in chromosome 2A. (d) The confrontation of our map with the map of Omrabi5 × dicoccoides population in chromosome 2A. ... 126
Figure 3.33: (a) The confrontation of our map with the map of Synthetic × Opata population in chromosome 4A (b) The confrontation of our map with the map of Kofa × UC1113 population in chromosome 4A... 127
Figure 3.34: The association between A, B, D genome of wheat ... 130
Figure 3.35: The comparing of our map with the map of Barley, the differences in some inversion in some chromosome. ... 131
Figure 3.36: The association of some markers with PPO activity trait in several chromosomes (present in our map) ... 135
Figure 3.37: The association of some markers with PPO activity trait ( present in our map). ... 137
Figure 3.38: The associations of markers with QTL for gene control. ... 137
Figure 3.39: The distribution of Lox gene and LPX locus in the group homoelogous of 4 and 5 ... 140
Figure 3.40: The association of markers including a short distance with the different traits. ... 140
Figure 3.41: The association of some markers with GPC trait in several chromosomes(present our map) ... 142
Figure 3.42: The association of some markers with GPC trait in several chromosomes(present our map) ... 144
Figure 3.43: The association of some markers with temperature-sensitive resistance and FHB traits in several chromosomes ( present in our map). ... 146
Figure 3.44: The association of some markers with APD trait in several chromosomes(present our map) ... 148
Figure 3.45: The association of some markers with growth trait in several chromosomes(present our map) ... 148
8
INTRODUCTION
Most projections suggest that wheat, already the most important food source for human-kind, will also be the primary food staple in the developing world in the next 15 years. Demand for wheat in developing countries is expected to grow at around 2.2 percent annually, about the same rate as production growth. By the year 2020, the production-consumption gap that is made up by wheat imports could approach 120 million tons annually, twice today (Rosegrant et al. 1995). It was recently postulated that there would be a need to produce 1 billion tons of wheat by the year 2020 (Braun et al. 1998). These projections assume that increases in global productivity will meet these demands without real price increases, which is highly desirable for consumers. Since increases in the area sown to wheat are likely to be small, productivity increases will have to come almost entirely from the development and application of new technologies. At the same time, greater sustainability and environmental demands on wheat farming systems will have to be met, and yield stability of the world. Genetic improvement of wheat is likely to remain the major source of productivity gains. The crop‚ yield potential has risen about 25 percent annually over the past 30 years. This trend is expected to continue but may require greater breeding resources, especially as recent gains in efficiency that resulted from computerization and mechanization of breeding begin to dwindle. Innovations in molecular biology appear unlikely to effect an impact on yield progress anytime soon. Despite considerable progress in the last 100 years, huge scope still exists for strengthening and making more durable the resistance of wheat to diseases, viruses and insects. This appears to be the area in which molecular biology will make its first impact on wheat breeding. Molecular biology is also likely to aid conventional breeding in changing the quality of wheat grain by developing it for novel industrial uses and improving its nutritional structure in ways that would clearly benefit consumers (increasing its content of available iron, zinc, vitamin A and certain amino acids).
The last 30 years have witnessed an unprecedented level of international wheat germplasm exchange and the development of a greater degree of genetic relatedness among successful cultivars globally. The concept of broad adaptation has thus been well vindicated. However, this is seen by some as increasing genetic vulnerability to pathogens, although such vulnerability depends more on similarities in resistance genes, which may actually be more diverse now than before. Various new factors, including the growing strength of national breeding programs in the developing world and the advent of breeders‚ rights, should result in increased diversity among cultivars and perhaps lead to the exploitation of hitherto-overlooked specific adaptation in wheat. This would be especially important if climate change accelerates. Just as increasing nitrogen supply and improving weed
9
control have been almost universal driving factors of wheat cultivation in the last 50 years, higher atmospheric concentrations of carbon dioxide and global warming with resulting warmer temperatures could significantly influence breeding objectives in the next 50 years.
In the last 10,000 years, the earth's population has doubled ten times, from less than 10m to more than six billion now and ten billion soon. Most of the energy for human nutrition, which made that increase possible, has come from three plants: maize, rice and wheat. Wheat is the oldest and most widespread crop.In the 2007 the wheat world production was 607 million tons, making it the third most-produced cereal after maize (784 million tons) and rice (651 million tons).
10
CHAPTER I
CHAPTER I
CHAPTER I
CHAPTER I
11
1- PLANT OF WHEAT
1- 1- The origin of wheat
The wheat is derived from three wild ancestral species in two separate inter specific hybridizations. The first took place in the Levant 10,000 years ago, the second near the Caspian Sea 2,000 years later. From the Fertile Crescent extends from Palestine through Syria and southern Turkey into Iraq and western Iran. 7000 BC and then spread quickly as a Neolithic agriculture package to other parts of West Asia, the Nile Valley, and the Balkans. Three millennia later, this wheat-and-barley Neolithic farming system provided food for people living in an extensive area of the Old World from the Atlantic Ocean to the Indian subcontinent and from Scandinavia to the Nile Valley. The Near East crop complex has made a significant contribution to feeding the human population in historical times as well as today (Heun MR et al. 1997).
The hybridization together with domestication resulted in a specie with extra-large seeds incapable of dispersal in the wild, dependent entirely on people to sow them.
The wheat diffusion was parallel with human populations’ migrations. The farmers brought not only seeds, but also their habits and agricultural practices: not just sowing, reaping and threshing, but baking, fermenting, owning, hoarding, as well as the wheat use in animal feeding to get meat and milk. The wheat from its origin site in the Middle East spread overall the world, 5,000 years ago reached Ireland, Spain, Ethiopia and India. A millennium later it reached China: paddy rice was still thousands of years in the future (Ozkan et al. 2002).
The wheat plant evolved mainly for three traits to suit its new servants: the seeds grew larger; the “rachis” which binds the seeds together became less brittle so whole ears of grass, rather than individual seeds could be gathered. And the leaf-like glumes that covered each seed loosened, thus making the grains “free-threshing”. In the past twenty years, the different mutations of loci involved in these changes have been located within the wheat plant's genome (Colledge 2007).
Figure: 1.1: The distribution of industrial plant in the world (FAO, 2010).
12 1- 1- 1- Natural mutants
Eager farmers took it up with astonishing results. By 1974, Indian's wheat production had tripled and India was self-sufficient in food; it has never faced a famine since. In 1970 Norman Borlaug was awarded the Nobel Peace Prize for firing the first shot in what came to be called the “green revolution”. Borlaug had used natural mutants; soon his successors were bringing on mutations artificially.
Scientists used thermal neutrons, X-rays, or ethyl methane sulphonate, a harsh carcinogenic chemical “anything that will damage DNA” to generate mutant cereals. Most of the wheat varieties growing in the field were produced by “mutation breeding”. The irony is that genetic modification (GM) was invented in 1983 as a gentler, safer, more rational and more predictable alternative to mutation breeding-an organic technology. Instead of random mutations, nowadays scientists could add the traits they wanted. In 2004, 200m acres of GM crops were grown worldwide with good effects on yield (up), pesticide use (down), biodiversity (up) and cost (down). Yet, far from being welcomed as a greener green revolution, genetic modification soon ran into fierce opposition from the environmental movement. Around 1998, a century after Crookes and two centuries after Malthus, green pressure groups began picking up public disquiet about GM and rushed the issue to the top of their agendas, where it quickly brought them the attention and funds they crave (Staple food, 2005).
Wheat, because of its unwieldy hexaploid genome, has largely missed out on the GM revolution, as maize and rice accelerate into world leadership. The first GM wheats have only recently been approved for use, their principal advantage to the farmer being so-called “no till” cultivation the planting of seed directly into untilled soil saves fuel and topsoil (Ears of plenty, 2011).
1- 2- Structure and development of Cereal plant
Cereals belonging to the Graminacee family. Worldwide, the most cultivated are wheat, corn, rice, barley, oats and rye. Wheat (Triticum aestivum) has been, since prehistoric times, the most important cereal. This feature depends on its adaptability to all types of terrain and different climates. Therefore its cultivation area is between 30°-60° north latitude and 20°-40° south latitude and it is found in culture even at the equator and beyond the Arctic Circle.
Like all of the temperate cereals, wheat undergoes profound changes in structure through its life cycle. The delicate growing point at the shoot apex, at first produces leaves, and then later changes to form the flowering spike or ear. The stem, at first compact and measuring a few millimeters, rapidly expands to a structure that may be a thousand millimeters or longer.
13
Plant growth and development concerns the length of the plant's life cycle, its subdivision into distinct stages, and the processes of formation of the plant's organs, the leaves, tillers and spikelets. These organs are important because are the basis for the plant adaptation to environments. Cultivars with differing developmental patterns are needed for different sowing dates and regions.
Structural and developmental patterns are also important because many decisions about nutrition and crop management are best made on a developmental rather than a calendar time scale.
The major developmental processes for a cereal are: 1-Germination and seedling establishment
2-Initiation and growth of leaves 3-Tillering
4-Growth of the root system 5-Ear formation and growth 6-Stem extension
14
1- 3- Wheat plant description
The cereals group includes several genera such as wheat (Triticum), barley (Hordeum), Oats (Avena), rye (Secale) and the man-made hybrid triticale (Triticosecale).
There are about 30 species of wheat, and more than 40,000 cultivars have been produced in the world. Wheat species can be divided into three groups depending on the number of chromosomes present in vegetative wheat plant cells: diploid (14 chromosomes); tetraploid (28 chromosomes); and hexaploid (42 chromosomes). These species can cross breed in nature or by plant breeders. Only three species of wheat are commercially important:
1-Triticum aestivum, 2-Triticum turgidum cv. durum – durum wheats: hard wheats (from Latin, durum, meaning ‘hard’), e.g. cv. Yallaroi and Wollaroi. Flour from these wheats holds together well due to high gluten content, cultivars are generally used for pasta and bread products. 3-Triticum
compactum – club wheats: This species is sometimes considered a subspecies of common wheat.
These are usually soft grained wheats often used for cake flour (http:/www.kstate.edu/wgrc/ Taxonomy/taxtrit.htmi).
Wheat and all other grasses have a common structure which provides the basis for understanding the growth and development of the crop and the reasons for particular management practices.
Wheat is a grass between 50 and 150 cm high. The physical appearance of the grain is familiar to most consumers, with a long stalk that terminates in a tightly formed cluster of plump kernels enclosed by a beard of bristly spikes. Wheat is an annual, which means that at the end of each year, fields must be plowed and prepared again to grow the grass.
Ancestral wheats looked very different, with much smaller kernels. The early domesticators of wheat obviously wanted to select for plants with particularly large kernels, since more nutrition could be eked out from each stalk. Because wheat is generally a self pollinating plant, each plant tends to produce pure lines. When farmers want to hybridize a wheat strain, they must physically pollinate the different plants. Farmers blending wheat for various purposes usually combine different seeds at harvest time and spread them evenly over the field. The wheat grown in general falls into two categories: winter wheat, which is planted in the fall and matures in the summer, and spring wheat, which is planted after the danger of frost is over and also matures in the summer.
Planting Soil: Adequate Sunlight: Full
15
Wheat's characteristic golden color at harvest time is well known and often appears in artwork that uses wheat (Dubcovsky and Dvorak 2007).
1- 3- 1- The grain
The grain, in cereals, is the small (3-8 mm long), dry, seed-like "fruit" of a grass, especially a cereal plant. (kernel is an older term for the edible seed of a nut or fruit). Grain is considered as a one-seeded "fruit" (called a caryopsis) rather than a "seed". A seed is a mature ovule which consists of an embryo, endosperm and the seed coat. However, a fruit is a mature ovary which includes the ovule or seed, in addition to the ovary wall that surrounds the seed (pericarp). In wheat, the pericarp is thin and fused with the seed coat (Figure 1.2), and this makes wheat grain a true "fruit". In other plants the pericarp may be fleshy as in berries or hard and dry forming the pod casing of legumes (Setler and Carlton 2000).
Seen in cross-section (Figure 1.4), the main constituents of grain are the bran coat, the embryo or young plant, and the endosperm. In most wheat cultivars, the proportions of grain are: bran 14%, endosperm 83% and embryo 3%. The bran coat, covering the grain, is made up of an outer pericarp derived from the parent plant ovary wall; a testa or seed coat derived from the ovule. And the aleurone layer, important as a source of enzymes and growth factors in germination (Figure 1.2). The endosperm makes up the bulk of the grain, it provides the energy for the seed germination, and it is the store of starch and protein which is milled for production of white flour.
The whole wheat flour is made of the ground products of the entire grain and therefore naturally contains more vitamins and minerals from the bran and embryo.
The embryos (Figure 1.2) consists of a short axis with a terminal growing point or shoot apex, and a single primary root known as the radical. Around the growing point are the primordial of the first three leaves (Cramb et al. 2000).
1- 3- 2- Tillers
Tillers are basal branches which arise from buds in the axils of the leaves on the main stem. Structurally, they are almost identical to the main stem, and are thus potentially able to produce an ear. Leaves on a tiller are also produced alternately. The tiller is initially enclosed in a modified leaf – the prophyll – which is similar to the coleoptile that encloses the main stem during emergence (Figure 1.3). Reduced tillering in new cereal cultivars is proposed by some scientists to try and increase yield, i.e. by eliminating stems that do not produce ears. However, tillers that have their own roots produce ears. Tillers may also contribute to grain yield as a source or sink for excess sugars and nutrients of the main stem. In the localities where insects, diseases or environmental stresses are common, tillers offer assurance that crop losses are minimal. The wide range of
16
environments where wheat is grown resulted in a diversity of cereal plant types (Setler and Carlton 2000).
1- 3- 3- The roots
Seminal roots which develop from primordial within the grain. As is the case for leaves and tillers, all the root axes of a plant can be given designations to describe their position, type and time of appearance on the plant. The growing, meristematic tissues of roots are located in the first 2-10 millimeters of the tip of each root. Hence, as roots grow the meristematic tips move further away from the shoot deep into the soil. This contrasts with the structures of blades and sheaths where the meristematic tissue remains close to the stem and pushes older tissues away from the plant (Figure 1.3). Why roots have evolved differently from leaves to have their growing meristematic tissue at the tip is unknown (Cramb et al. 2000). One possibility is that this allows immediate control over root growth in the event of environmental changes such as water or nutrient supply. Hence this enables better control of the direction of root growth in the diverse soil matrix.
1- 3- 4- The stem
The stem of the wheat plant is made up of successive nodes, or joints, and internodes (Figs 1.2; 1.3). The stem is wrapped in the sheaths of the surrounding leaves. This structure of stem and sheaths gives strength to the shoot, and it is what keeps the cereal shoot erect and reduces lodging. Nodes are the places on stems where other structures such as leaves, roots, tillers and spikelets join the stem. This is also where the vascular channels carrying nutrients into and out of these organs join the vascular connections of the stem. Only when stem elongation begins, do the internodes begin to grow to form the characteristic tall jointed stem of the mature wheat plant (Figure 1.3). As the stem grows, it evolves from a support tissue for leaves, to also become a storage tissue for carbohydrates and nutrients in preparation for subsequent grain filling. At the time of ear emergence, carbohydrates account for 25 to 40% of the dry weight of stems of most wheat. This is an adaptive trait for wheat grown in rainfed environments, since even if severe drought occurs at the end of the season this carbohydrate can used to fill some grains.
1- 3- 5- The ear
The inflorescence or ear of wheat is a compound spike made up of two rows of spikelets (Figure 1.5) arranged on opposite sides of the central rachis. Like the stem, the rachis consists of nodes separated by short internodes, and a spikelet is attached to the rachis by the rachilla at each node. From the ears structure it is possible identify the diploid, from tetraploid and hexaploide wheat. On each ear there is a single terminal spikelet arranged at right angles to the rest of the spikelets (Figure 1.5). At the base of each spikelet there are two chaffy bracts called sterile or empty glumes
17
(Fig. 1.5). These enclose up to ten individual flowers called florets, although the upper florets are usually poorly developed. Generally only 2 to 4 florets form grains in every spikelet (Cramb et al. 2000).
A typical wheat ear will develop 30 to 50 grains. Each flower will produce one grain which grows in the axil of a bract called the lemma, and is enclosed by another bract called the palea. The long awns (sometimes called "beards") found on many modern wheats are extensions of the tip of the lemma (Fig. 1.5), (Kirby and Appleyard 1987).
Structure of the wheat grain.
Schematic diagram of a mature wheat plant highlighting tiller, leaf and internode numbering and position.
Table 1.1: Shoot structures to identify cereals and selected weeds.
Grass Ligule Auricles Leaves Leaf sheath
Wheat Barley Oats Annual Ryegrass Barley grass Wild oats Fringed membrane membrane membrane membrane (<2 mm) membrane (<2 mm) membrane (<2 mm); hairless
Yes-large clasping, with hairs
Yes-very large, without hairs none
yes – large, clasping yes – large, pointed
none
Usually twist clockwise; no hairs Twist clockwise; usually
hairless Twist anticlockwise; no hairs
No hairs Soft hairs Twist anti- clockwise; no
hairs split split split Slight split Slight split split Figure 1.2: Figure 1.3: Figure 1.4:
Structures of the wheat inflorescence (spike or ear), spikelet and floret of the wheat plant Figure 1.5:
18
1- 4- Seed treatment
Seed health is an important attribute of quality, and seed used for planting should be free from pests. Seed infection may lead to low germination, reduced field establishment, severe yield loss or a total crop failure. For example, severely infected wheat grains with Karnal bunt either fail to germinate or produce a greater percentage of abnormal seedlings (Singh 1980; Singh and Krishna 1982). In wheat, fungi (Fusarium spp., Tilletia spp., Drechslera spp., Septoria spp. and Ustilago spp.), bacteria (Corynebacterium, Pseudomonas and Xanthomonas) and nematodes (Anguina tritici) are the most important seed-borne diseases due to their worldwide distribution and losses they incur in crop production (Mamluk and van Leur 1986; Diekmann 1996 a).
Chemical seed treatment is one of the efficient plant protection. But another way more effective than this treatment can be used genetic. These resistance genes protected young seedlings or adult plants against attack from seed-borne, soil-borne or airborne pests. The disease-resistance genes have been transferred from wild grasses into bread wheat using a new pre-breeding technique that allows the genes to be inherited together.
Led by Dr Phil Larkin and Dr Ligia Ayala-Navarrete, the CSIRO team targeted the Lr19, Sr25 and Bdv2 genes that are effective against leaf rust, stripe rust and barley yellow dwarf virus. In tests against all races of the new stem rust pathotype Ug99, the Sr25 gene has provided total resistance while Bdv2 is the first gene to provide true resistance to barley yellow dwarf virus, the most widespread and economically significant cereal virus in Australia. The CSIRO strategy involves two wild relatives of bread wheat: Thinopyrum ponticum (the donor of Lr19 and Sr25) and Th. inter
medium (the donor of Bdv2). For each wild species, the team selected translocations that moved a
chunk of wild chromosome (containing the disease-resistance genes) to wheat chromosome 7D. These translocated chromosomes were then crossed so that during sexual reproduction – when chromosomes pair up to exchange DNA – the Th. inter medium and Th. ponticum fragments were also brought together.
In the hexaploid wheat (Triticum aestivum L.) more than 50 leaf rust resistance (Lr) genes against the fungal pathogen Puccinia triticina have been identified in the wheat gene pool, and a large number of them have been extensively used in breeding. Of the 50 Lr genes (AWLr10, Lr23), all are known only from their phenotype and/or map position except for Lr21, which was cloned recently (Feuillet et al. 2003).
19
In wheat, race-specific resistance to the fungal pathogen powdery mildew (Blumeria graminis f. sp.
tritici) is controlled by the Pm genes. There are 10 alleles conferring resistance at the Pm3 locus
(Pm3a to Pm3j) localized on chromosome 1AS of hexaploid wheat (Triticum aestivum L.).
The diploid T. monococcum and the tetraploid T. turgidum ssp. durum, also carry the gene pm3 (Yahiaoui et al. 2004).
Rong et al. (2000) working in Triticum turgidum var. dicoccoides have been verified that the powdery mildew resistance gene was designated as Pm26 associated with some markers (WMS149, WMS445).
Seed production in disease-free areas or under effective disease control and field inspection schemes is very important to obtain disease-free seed. So knowing the genes involved in the resistance mechanisms against these diseases will save time in eliminate the damage came from pathogen agents.
1- 5- Wheat, permitted the rise of Civilization
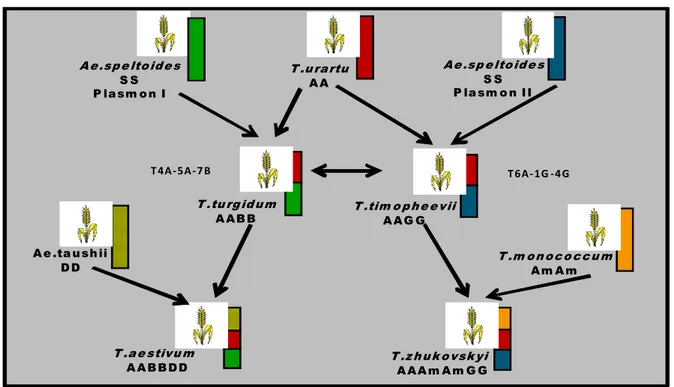
The wheats known today are cereals that evolved in the Middle East through repeated hybridizations of Triticum spp. with members of a closely related grass genus, Aegilops.
The process which began some ten thousand years ago involved the following major steps. Wild einkorn T. boeoticum crossed spontaneously with Aegilops speltoides to produce Wild Emmer T.
dicoccoides; further hybridizations with another Aegilops, Ae. squarrosa, gave rise to Spelt, Emmer T. dicoccum and early forms of Durum Wheat. Bread Wheat finally evolved when cultivated
Emmer re-crossed with Ae. squarrosa in the southern Caspian plains. This evolution was accelerated by an expanding geographical range of cultivation and by human selection, and had produced Bread Wheats as early as the sixth millennium BC (Gregg 2001).
Modern varieties and Major cultivated species of wheat are selections caused by natural mutation starting with:
1- 5- 1- Emmer
Emmer (Triticum dicoccum), a tetraploid species, cultivated in ancient times but no longer in widespread use. A low yielding, tall (2m) awned wheat with small grains and originating from a mutation with no husk. Closely related to the modern durum wheat used for pasta, Emmer dates from approximately 7000 BC. This wheat along with barley has been found on sites, including the Pyramids, all over the near east and Europe from the earliest times. In fact Emmer wheat was the staple cereal of prehistory, the real reason why early agriculture actually worked. Even today it is grown in remote areas of Turkey and Syria (Fleure and Davies 2001; Ozbek et al. 2007).
20 1- 5- 2- Einkorn
Einkorn (Triticum monococcum), a diploid species with wild and cultivated variants. Domesticated at the same time as emmer wheat, but never reached the same importance. It was widely cultivated in Neolithic times and, by the Iron Age, Bread Wheat T. aestivum was sustaining populations in much of Europe. A sub species, Club wheat T compactum, was notably grown by Neolithic farmers in Swiss lake side villages. Identification of the types of crops grown in the Iron Age comes from three sources of evidence; carbonized seed, pollen grains and impressions of seed fired into pottery. In proportion related to the climate of the site; Einkorn is more resistant to cold, heat, drought, fungous diseases and bird predation, although its yield is lower than those of emmer, spelt and naked wheat (Chen et al. 2009).
1- 5- 3- Spelt
Spelt (Triticum spelta), a hexaploid species cultivated in limited quantities. Similar to Emmer but with a tough husk that cannot be removed. Spelt was probably first sown and harvested in the Bronze Age. Spelt has an appalling yield (by weight, not volume) and even when threshed is mostly husk, consequently it is not surprising that Bronze Age man had very worn teeth. Along with Emmer wheat, Spelt was grown extensively in Britain during the late Iron Age and the Roman period. Its modern use is for specialist bread and breakfast cereals (Fleure and Davies 2001).
1- 5- 4- Bread wheat
Bread wheat (Triticum aestivum), a hexaploid species that is the most widely cultivated in the world. Husk free and with (usually) no awns, it is typically short (less than 1m) and stands well in highly fertile situations (Gregg 2001).
21
1- 6- Wild wheat
The narrow genetic basic of durum and common wheat is a major constraint for the improvement of these crops (Feldman and Sears 1981). Therefore, it is of great importance to widen the genetic variation of desirable traits, particularly, those affecting yield and quality (Nachit 1998, 2000). Wild relatives of wheat, having a much wider range of genetic variation, could serve as an excellent source for improvement of such desirable traits. In fact, wild relatives hold rich pools of genetic variation and carry many genes of great economic potential (Feldman and Sears 1981). For this reason, many programs are now carrying out hybridization, based on inter specific or intra specific crosses between wild species and cultivated wheats. For instance, the joint ICARDA, CIMMYT durum-breeding project has mainly based its hybridization program on crosses between improved genotypes, Mediterranean landraces and wild relatives to improve and broaden the genetic base for resistance to biotic and abiotic stresses. Thus, landraces and wild relatives from the Middle East have been used to enhance drought tolerance, from Turkey and Algeria to incorporate cold resistance and from Morocco-Iberia region to improve resistance to root rot and Hessian fly (Nachit 1989; Nachit et al. 1995).
Wild species, relatives to actual wheats, belong to Triticeae tribe. The genus has Wild as well as domesticated species occur in both the diploid and tetraploid groups. Only domesticated species occur in the hexaploid group, although Dekaprelevich (1961) reported hexaploid wheat with fragile rachis growing wild in Georgia, and Sears (1977) synthesized such a hexaploid from wild tetraploid wheat and T. tauschii (Sharma and Waines 1980).
At the diploid level, basically only one species, T. monococcum has been domesticated and possibly has been used by humans for 8,000 to 10,000 years. In general, diploid species are rather resistant to disease (particularly to rusts) and have profuse tillering with narrow leaves, and good elastic straw and high resistance to lodging. Wild wheats differ from those domesticated mainly in two characteristics: 1) the spikes of the wild wheats disarticulate at maturity while those of domesticated wheats have a tough rachis and remain intact. 2) The kernels in wild wheats are enclosed tightly by the palea, lemma, and glumes, whereas, in the domesticated wheats the kernels are loosely held by the glume and are threshing. Nevertheless, Triticum monococcum L. is not exactly free-threshing. These differences between wild and domesticated wheats are apparently caused by gene mutations accompanied by selection under domestication (Sharma and Waines 1980).
The Triticeae tribe forms an important subdivision of the Graminea family. It holds fourteen genus sharing out, according to their morphologic characters, in two sub-classes, the Hordeinae and the
Triticinae (Fig. 1.6). The species such as barley (Hordeum ssp.) of the Hordeinae sub-class
22 A e .sp e lto id e s S S P la sm o n I T .u ra rtu A A T .tu rg id u m A A B B T .tim o p h e e vii A A G G A e .ta u sh ii D D T .m o n o c o c c u m A m A m T .a e stivu m A A B B D D T .z h u k o vsk yi A A A m A m G G A e .sp e lto id e s S S P la sm o n I I T 4A - 5A - 7 B T 6A - 1G -4 G
(Secale ssp.) and wheat (Triticum ssp.) of the Triticinae under-tribe have usually just one spikelet per rachis (Feldman and Sears 1981). In wheat the inflorescence is a determinate, composite spike. Sessile spikelets are alternate on opposite sides of the rachis of the main axis of the spike, forming a true spike.
Figure 1.6: A diagrammatic representation of the current theory of the evolution of wheat (Wheat Genetics Resource Center web site: http://www.ksu.edu/wgrc).
Even if the wild species have, probably, a common ancestor, they differentiate widely from each other, not only by their morphology but also by their geographic and ecological distributions. Cytogenetic analysis has confirmed the taxonomic classification and distinction. Each diploid species has a specific genome that is genetically isolated, in variable degrees, from others species. The polyploid wild species of Triticum constitute a classical example of evolution by amphiploidy (Feldman and Sears 1981).
1- 6- 1- Triticum dicoccoides
Between tetraploid wheat, the first species is T. turgidum from var. dicoccoides and other wild form of T. timopheevii, now these are species, do these have a common origin or separately as there are different. Wild emmer or T. dicoccoides (syn. T. turgidum ssp. dicoccoides Thell.) is the immediate progenitor of all cultivated forms of tetraploid and hexaploid wheats (Feldman and Sears 1981). The wild tetraploid is endemic primarily to the western arc of the Fertile Crescent (Kimber and Feldman 1987). It grows on terra rosa or basalt soil in the herbaceous cover of the oak park forest, dwarf shrub formations, pastures, abandoned fields and edges of cultivation.
23
T. dicoccoides is a tetraploid carrying two genomes A and B. It seems that its cytoplasm is similar
to that of Triticum longissimum Schweinf. and Muschl. Harlan (1987) reported that T. dicoccoides was formed from T. boeoticum wild einkorn and the little weedy goat grass Aegilops speltoides Tausch. Wild emmer is distributed over the near East Fertile Crescent (Feldman and Sears 1981). Most certainly, wild tetraploid wheats were already largely distributed in the Near East when men started harvesting its grain and using its straw in nature. Their general size and particularly the size of head and the kernels made them much more worthwhile for domestication than diploid wheats. Their large grains attracted pre-agricultural collectors who eventually domesticated it, presumably, in the southern part of the Fertile Crescent (Kimber and Feldman 1987), probably in the Syrian Haurani plain.
The analysis of seed storage protein of T. dicoccoides has shown that this species is highly variable for HMW glutenin subunits (gs) encoded by the Glu-A1 and Glu-B1 HMW loci and for the B-group LMW gs (Damania et al. 1988; Nachit et al. 1995). Liu and Shepherd (1996) found 7 different LMW gs patterns in Kushnir’s collection and 72 different B subunit patterns in Nevo’s collection. These results are in accordance with those reported by Ciaffi et al. (1993) on T.
dicoccoides lines from Jordan and Turkey. They also have observed enormous variation of LMW gs
banding patterns beside the usual w35/g45/LMW2. The genetic diversity of these T. dicoccoides lines appeared geographically structured and partially predictable by ecology and alloenzyme markers (Liu and Shepherd 1996). It should be noted that protein bands with similar molecular weight could be derived from different protein alleles. Nevertheless, it appeared that the greater band variation in the old tetraploid wheats than in durum cultivars indicated a greater variation of their protein alleles. The electrophoretic analysis has shown that T. dicoccoides alleles by the Glu-A1, Glu-B1, and Glu-B3 loci are uncommon among cultivated durum. Nachit et al. (1995 b), by evaluating F6 progenies of T. durum × T. dicoccoides, they found that these progenies have allelic variants at the Glu-A1, Glu-B1, Gli-B1 and Glu-B3 loci, which are not usually present in durum. The presence of a wide polymorphism and the detection of unique subunits in this wild wheat would make worthwhile the assessment of the effect of different gluten components on technological properties (Ciaffi et al. 1991).
1- 7- Cultivated wheats
Wheats belong to Triticum genus and as mentioned above, the basic chromosome number of this genus is seven (x=7). The cultivated species have different levels of ploidy as follows:
Genetic and cytogenetic analyses conducted mainly at the hexaploid level have demonstrated that the chromosomes of the three basic genomes in hexaploids (ABD), two in tetraploids (AB) or one in diploid (Am), can be grouped into seven basic types. One pair of chromosomes of the genome A
24
is at least partially able to substitute for a specific pair of the genomes B (in tetraploids) or B and D in hexaploids. Very often, similar mutations (or variations) can be found in all of the three types of genomes, in corresponding homoeologous chromosomes. This is easily explained by the fact that the three genomes (A, B, and D) may have had a common ancestor in the past (Bozzini 1988).
1- 7- 1- Diploid wheat
The A genome of diploid wheat consists of 5 billion bp of DNA organized into seven pairs of chromosomes. Kuspira and his colleagues (Friebe et al. 1990) carried out cytogenetical studies and developed a primary trisomic series that proved to be of limited value due to its high sterility. Friebe et al. (1990) constructed the standard karyotype, and all chromosomes were individually identified. In addition to cytological polymorphism associated with different geographical populations, the diploid wheats contain a translocation involving chromosomes 4A and 5A (Dubcovsky et al. 1996). There has been some differentiation between the A genome of diploid and polyploid wheats as evidenced from the reduced level of pairing, or absence of pairing in the case of chromosome 4A (Gill and Chen 1987), in the amount of C-heterochromatin (Friebe and Gill 1996) and other structural features (Jiang and Gill 1994).
Genetic transfers are feasible from diploid to polyploid wheats by bridging crosses or direct crosses (Cox et al. 1991). However, because of genome differentiation, linkage drag is likely, and methods to enhance recombination may need to be deployed (Dubcovsky et al. 1995). Those who wanted to improve T. monococcum by crosses with 4x and 6x wheats were disappointed as such transfers are impossible (Sharma and Waines 1981).
1- 7- 1- 1- Triticum monococcum
Is still cultivated as feed for poultry and swine in the mountains of some Mediterranean countries (Italy, Spain, Turkey, Iran, etc.). Diploid cultivated wheat, Triticum monococcum L. ssp.
monococcum L. (2n = 2x = 14), is one of the most ancient crops domesticated in the Middle East
(Harlan 1980). T. monococcum is closely related to T. urartu Thum. However, their hybrids are sterile (Johnson and Dhaliwal 1976). T. monococcum was assumed to be the ancestor of the A genome of polyploid wheats. Chromosome pairing and recombination between T. monococcum chromosomes individually substituted in wheat and the wheat chromosomes of the A genome is low if the wheat Ph1 locus is active (Paull et al. 1994; Dubcovsky et al. 1995a), which indicates that some differentiation has occurred between these genomes. The existence of genome differentiation between T. monococcum and to other species is also evident from extensive differences in the restriction profiles of repeated nucleotide sequences and the promoter region of the 18S5.8S-26S rRNA genes, which show very little intraspecific variation in the Triticum species (Dvorak et al.
25
1993). For these reasons, it was proposed to redesignate the genome of T. monococcum as (Am ) (Dvo et al. 1993; Dubcovsky et al. 1995 a).
Since the cultivars of T. aestivum have low levels of polymorphism, while wild genotypes of T.
monococcum show high levels of restriction fragment length polymorphism (Castagna et al. 1994;
Le corre and Bernardi 1995), T. monococcum was used to produce high-density RFLP maps that complemented the genetic maps of T. aestivum. A similar rationale was used for the construction of linkage maps of T. tauschii (Coss.) Schmalh. (Kam-morgan et al. 1989; Gill et al. 1991; Lacuda et al. 1991).
The fact that linkage groups in this map are longer than the linkage groups in the genetic maps of other species in the tribe Triticeae complicates comparisons. A map of chromosome 1Am of T.
monococcurn ssp. uegilopoides has been reported and was of a similar genetic length as a map of
chromosome 1A of T. aestivum and for this reason that A genome is the unnamed (Am) (Dubcovsky et al. 1995a).
1- 7- 2- Tetraploid Wheat- Triticum durum
Durum wheat (T. turgidum subsp. durum) is a tetraploid species (2n=28, genomes AABB), a very important crop for the human diet, particularly in the Mediterranean basin where about 75% of the world’s durum grain is produced. With about 21.0 million hectares under cultivation (about 8% of the total wheat cultivated area), durum wheat ranks eighth among all cereals. Except for the small amount used in manufacturing couscous and local bread in some Mediterranean countries, its only significant finished product is represented by alimentary pasta. With wide variation due to drought stress, diseases and pests.
The major exporting countries of the European Union (EU), Canada, and the United States combined, account for 51 percent of total durum production, followed by Syria, Morocco, Russia, Turkey, Mexico.
Wheat is the major crop in Syria with annual production of 2.5 million tons. It is planted in different agroclimatic zones, in both rainfed and irrigated areas.
Measurements of genetic diversity in cultivated crops have important implications for plant breeding programs and for the conservation of genetic resources (Tinker et al. 1993).
Figure 1.7:
The distribution of the wheat in the world, Top ten wheat producers-2010 (million metric ton).
26 8 .0 7 .0 6 .0 5 .0 198 9-90 1992-93 1995-96 1998-99 2003-04 2008-09 2011-12 M il li o n t o n n e s 1 9 9 4 -9 8 av erag e= 6.1 M T
The EU‘s 2009/10 durum crop is estimated to be 8.0 million tons. Europe’s durum crop is concentrated along the drier Mediterranean Basin area with Italy, France, Spain, and Greece being the largest durum producing countries. Italy is the main market for the European Community durum wheat. With a growth area larger than 1.5 million hectares, and a production of about 4t million tons, Italy is one of the most important durum wheat producing countries in Europe.
Durum wheat is one of the oldest cultivated plants in the world and is grown mainly in the middle and near East region and North Africa, which are considered the centers of origin and diversification of this crop (Vavilov 1951). Based on archeological evidence it is generally accepted that durum wheat was domesticated at least 2000 years before bread wheat (Morris and Sears 1967) during the late Mesolithic period and the early Neolithic age (Harlan 1986). The adaptation of durum wheat largely overlaps that of bread wheat, but is less widely grown (Autrique et al. 1996) In addition, durum wheat trade expectations for the coming years show an increase of 21% by 2012 (CWB, 2008).
Figure 1.8: World durum wheat trade forecast (CWB, 2008).
The cause of such differences is mainly due to the different pedology and climatic conditions. In fact, durum wheat is primarily grown under rainfed conditions, and grain yield is strongly limited by the frequent and irregular occurrence of drought combined with heat stress at the late phases of the growth cycle (Araus et al. 2002; Condon et al. 2004). Furthermore, fungal pathogens and other diseases also concur to reduce the field performance with losses reaching 30-50% in grain yield. For these reasons, the improvement of plant capacity to cope with water stress and the accumulation of disease resistance genes into the same genotype are the main objects of the breeding programs for durum wheat in order to reduce the gap existing between potential and actual yield.
Durum wheat is not only a food crop, but it also has a broad use in the industrial sector and in animal feeding. However, the most peculiar characteristics of the wheat kernel, elasticity and extensibility of the gluten complex, which confers the viscoelastic properties of the dough, make
27 N o r t h A f r i c a , E u r o p e , A m e r ic a , A u s t r a lia H ig h V i t r e o u s n e ss , m e d iu m t o s t r o n g g lu t e n , h i g h y e l lo w p ig m e n t s. C o u n t r y /r e g io n U s e R e q u ir e m e n t P a s t a N o r t h A f r ic a C o u s c o u s , B r e a d H ig h V i t r e o u s n e ss , m e d iu m t o s t r o n g g lu t e n , h i g h y e l lo w p ig m e n t s. M id d l e E a s t U n le a v e n e d b r e a d M e d i u m t o s t r o n g g l u t e n N e a r a n d M i d d le E a s t H ig h V i t r e o u s n e ss , m e d iu m t o s t r o n g g lu t e n , y e llo w p ig m e n t . B u r g h u l A n d e a n r e g io n M o t e H a r d g r a i n .
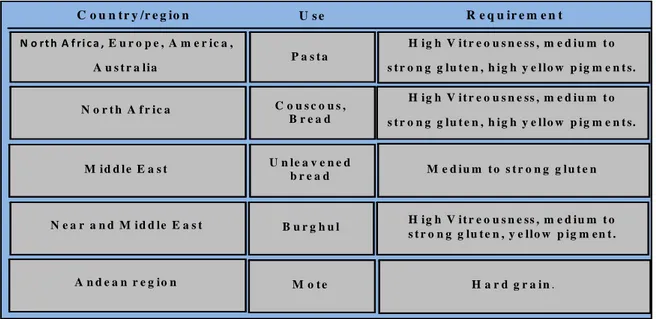
durum wheat well suited for pasta, as well as bread, couscous, burghul, frike and other local food products. In fact, those end-products have various priorities according to the country (Table 1.2). Recently, the researchers from some countries (Chine, Iran, India) to making Nano-Crystalline cellulose, that camed from straw of durum wheat. These Nano-Crystalline are cells that contain a natural polymer with microfibrils by highly order, that trough of Plants constantly being produced. Generally, these end-products require large vitreous kernels with high protein content, good yellow pigment and strong gluten.
Table 1.2: Durum use and quality requirements in different part of the world (Nachit et al. 1992).
As compared to hexaploid wheat, durum wheat underwent a more limited selection until 1960, when more intense breeding programs based on innovative germplasm introgressions and multi-environment testing for wide adaptation was applied also to durum wheat. Accordingly, the genetic gains obtained after 1970 in grain yield (GY) of durum wheat are comparable to those obtained for hexaploid wheat. These gains have mainly been attributed to a balanced improvement in fertility because of higher allocation of assimilates to the growing tillers and ears concomitant with a general increase in total biomass production, with the harvest index remaining practically unchanged (Slafer and Andrade 1993; Slafer et al. 1996; Pfeiffer et al. 2000; De Vita et al. 2007; Slafer and Araus 2007). As suggested by Pfeiffer et al. (2000), GY components have reached a near-optimal balance in modern elite durum wheat cultivars. While the improvement of GY under optimal growing conditions has prevailingly been attributed to increased spike fertility, under Mediterranean- like conditions the importance of traits at the basis of growth plasticity, such as early vigor and a finely tuned heading date that allows the plant to escape from terminal drought, has been universally recognized (Richards 2000; Spielmeyer et al. 2007).