Dottorato di ricerca in ‘ Scienza dei
materiali e nanotecnologie’ XXXI ciclo
Electrochemical sensors for
environmental and clinical analyses
Dottorando: Tutor:
Bernardo Patella Carmelo Sunseri
2
Index
List of acronyms ... 5
Motivation and aim of the research ... 7
References ... 10
2. General Introduction ... 11
2.1 A monitored world ... 11
2.2 Electrochemical sensors and effect of nano-sized electrodes ... 15
2.3 Main electrochemical techniques ... 20
References ... 29
Preface ... 31
3. Sensors for hydrogen peroxide ... 32
Abstract ... 32
3.1 Introduction ... 33
3.2 Experimental ... 43
Electrode Synthesis ... 43
Electrochemical tests ... 47
3.3 Results and discussion ... 48
Electrodes fabrication ... 48
Sensor calibration ... 58
Selectivity, Accuracy and stability ... 66
Economic Analysis ... 71
Real samples ... 72
Comparison with the literature ... 76
3.3 Conclusions ... 77
References ... 79
4. Sensors for heavy metals ... 82
Abstract ... 82
4.1 Introduction ... 83
4.2 Nickel oxide based electrode for mercury detection ... 96
3
Sensing electrode synthesis and characterization ... 96
Electrochemical measurements ... 97
Real samples analysis ... 98
4.2.2 Results and discussion ... 99
Electrode synthesis and characterization ... 99
Electrochemical tests ... 103
Selectivity tests ... 109
Real samples analysis ... 110
Comparison with the literature ... 112
4.2.3 Conclusions ... 113
4.3 Gold microband array for mercury, copper and lead detection ... 114
4.3.1 Experimental ... 114
Electrode Fabrication ... 114
Electrochemical measurements ... 115
Chip holder fabrication ... 117
Real Sample Analysis ... 118
4.3.2 Results and discussion ... 118
Electrode Characterization ... 118
Mechanism of detection ... 120
Optimization of deposition time, deposition potential, and pH ... 122
SWASV analysis of Lead, Copper and Mercury ... 126
Metal interferences ... 131
pH control ... 136
River Water Analysis ... 144
4.3.3 Conclusions ... 147
References ... 148
5. Sensors for proteins: proof of concept and application towards cancer biomarkers ... 154
Abstract ... 154
5.1 Introduction ... 155
5.2 Experimental ... 165
4
Au-NPs synthesis and antibody conjugation ... 166
Fabrication of Reduced graphene oxide electrode and immunoassay ... 166
5.3 Results and discussion ... 168
Electrode characterization ... 176168
Au-NPs characterization and conjugation with antibodies ... 176
Electrochemical measurements on the immunoassay, calibration lines ... 182
PTHLH detection ... 187
Comparison with bibliography ... 190
5.4 Conclusions ... 191
References ... 192
6 Conclusions and outlook ... 199
General Conclusions ... 199
7 List of publications, conferences and internships ... 202
7.1 Papers ... 202
7.2 Patent ... 203
7.3 Conferences ... 203
7.4 Internships ... 204
5
List of acronyms
AA Ascorbic Acid
A Working electrode area
AP Acetomiophen
BDD Boro Doped Diamond
BSA Bovine Serum Albumine
BV Buttler-Volmer
Cb Bulk Concentration
Cd Capacitance of Double Layer
CA Citric Acid
CHFH copper hexacyanoferrate
CNTs Carbon Nanotubes
CRGO Chemical Reduced Graphene Oxide
CV Ciclic Voltammetry
D Diffusion Coefficient
DA Dopamine
DI Distillated Water
DPV Differential Pulse Voltammetry
Eo Standard Potential
EDC 1-ethyl-3 (3-(dimethylamino)-propyl) carbodiimide
EDL Electrical Double Layer
EDS Energy Dispersive Spectroscopy
ELISA Enzyme Linked ImmunoSorbent Assay
EPA Enviromental Protection Agency
ETA Etanolammine
EToH Ethanol
F Faradic Constant
f Frecuency of Square Wave
GAT Gold Aggregation Test
GCE Glassy Carbon Electrode
GFAAS Graphite Fournace Atomic Absorpiton Spectroscopy
Glu Glucose
GO Graphene Oxide
HER Hydrogen Evolution Reaction
HIgG Human Immunoglobulin G
HRP Horseradish Oxidaxe
if Forward Current of Square Wave
ip Peak Current
ir Reverse Current of Square Wave
ICP-MS Inductecly Coupled Plasma Mass Spectroscopy
6
LOD Limit Of Detection
LR Linear Range
LSGO Laser Scribed Graphene Oxide
LSV Linear Sweep Voltammetry
MAE Microband Array Electrode
n Number of electrons
NHS N-Hydroxysuccinimide
NiO@Ni Nickel oxide/ Nickel core/shell
NPs Nanoparticles
NTs Nanotubes
NWs Nanowires
PB Prussian Blue
PBS Phosphate Buffer Solution
PTHLH Parathyroid Hormon Like Hormon
PTWI Provisional Tolerable Weekly Intake
Pox Potassium Oxalate
R Gas Constant
Rct Resistance of solution
RΩ Resistance of charge transfer
r.d.s Rate Determining Step
rGO reduced Graphene Oxide
S Sensitivity
SEM Scanning Electron Microscopy
SO Sodium Oxalate
SPCE Screen Printed Carbon Electrode
SPE Screen Printed Electrode
td Deposition time
T Temperature
TEM Transmission Electron Microscopy
UA Uric Acid
ULR Upper Limit of Linear Range
UPD Under Potential Deposition
Vd Deposition potential
WHO World Health Organization
WSR Water Splitting Reaction
XRD X-Ray Driffraction
Accuracy
Scan Rate
eff Thickness of diffusion layer
p Step Potential
7
Motivation and aim of the research
The main aim of my Ph.D research was the development of novel sensors for clinical and environmental analyses. Nowadays, the concepts of smart cities, smart houses and Homo Deus (potential next stage in human evolution) are taking more and more attention [1-2-3-4]. Sensors have a key role in this context: recording different parameters, such as pollution, traffic jam, blood pressure, blood composition, brain activities or the functioning of organs, it will be possible to design cities able to manage efficiently all the resources or to warn people if a particular kind of disease, such as cancer or diabetes, is taking place. Current way of detecting these parameters or molecules are often laborious and expensive and cannot be used as in situ and real time [5]. In this scenario, the development of new kind of sensors, able to fit to these new necessities is of great importance. Electrochemical sensors, especially nano-sized sensors, are perfect candidates to address these challenges. Indeed, these sensors do not require special instrumentations to work but just an usual battery, so that this technology is really cheap and suitable for in situ action. Furthermore, the signal, which is an electrical signal (current, potential or resistance), can be recorded over time and can be acquired and managed in remote [6]. The main challenge of this technology is to achieve a Limit Of Detection (LOD) low enough to make the use of these sensors competitive with other analytical techniques, such as Inductively Coupled Plasma Mass Spectrometry (ICP-MS) or Enzyme Linked ImmunoSorbent Assay (ELISA) and, at the same time, to achieve a good reproducibility and stability when used with real samples like blood, urine or sea/river water [7]. These goals can be achieved by nano-sized materials because they enhance mass transport and electron transfer rate. In addition, to once found the right sensing material, it is8
possible to select the electrochemical detection technique giving the best performances in dependence on the analyte that has to be detected [8].
During my 3 years of Ph.D I studied different electrodes to detect, electrochemically, 3 different analytes: i) heavy metals, ii) proteins, and iii) hydrogen peroxide. Heavy metals are the main source of water pollution. They have been extensively used in various applications due to their specific properties. The main problem using these chemicals is that they are non-biodegradable and thus they can accumulate in the human body through either the food chain or respiratory function. Among heavy metals, one of the most dangerous is mercury because just the exposure to some ppb (µg/l) can cause several problems to human body. Lead, cadmium, zinc, arsenic and copper are considered toxic and dangerous as well, therefore, their monitoring is really important [9-10-11]. H2O2 is a widely used chemical, employed as bleaching agent in textile and paper industry, for medical and pharmaceutical applications and to remove organic compounds from waste water and contaminated soil. Furthermore, H2O2 has a key role in the human body as well. For instance, its detection can be useful because can give indications about the glucose concentration and so it could be useful for diabetic patients. Furthermore, it is a biomarker of oxidative stress that is a pathological condition due to breakdown of the antioxidant defense system. [12-13-14]. Detection of proteins was also investigated during my Ph.D. In order to detect these bio-compounds it is mandatory to use some bio recognition elements (such as antibodies, DNA or aptamers) so that the sensors are usually named biosensors. During my studies, I developed a biosensors towards Human ImmunoGlobulin G (H-IgG) and ParaThyroid Hormone Like Hormone (PTHLH). H-IgG is a protein always present in the human fluids (blood, urine, sweat) and its detection has not any particular relevance. It can be used as a model because is a cheap protein that has the bio-chemical properties of many other proteins. Instead, PTHLH is
9
overproduced owing to different kind of cancer, consequently it can be used as a biomarker. This kind of application is really of great value because PTHLH starts to be produced at the beginning of the disease, so that its detection is useful for early diagnosis. [15-16-17].
Summarizing, the main goals of this Ph.D work are:
1. To develop new and innovative ways to fabricate electrodes with high surface area such as nanowires, nanotubes, thin film, microbands and porous substrates;
2. To find new and cheap electrochemical sensors featured by fast response in real time, high selectivity, low LOD, and able to work in situ, for detecting hydrogen peroxide, heavy metals, and proteins was the challenge of the research. It has been addressed with the proper development of nanostructured materials easy to be prepared. ;
3. Validate these sensors using real sample such as real water sample, cell cultures or body fluids.
10
References
1 L. Berntzen, M. R. Johannessen, A. Florea, Sensors and the Smart City, SMART conference, 2016,
2 R. M. Alarm, M. B. I. Reaz, M. A. M. Ali, A review of smart homes - Past, present, and future, IEEE Transaction on system, man and cybernetics C, 2012, 42, 1190-1203
3 H. Alemdar, C. Ersoy, Wireless sensor networks for healthcare: A survey, Computers Networks, 2010, 54, 2688-2710
4 O. Tane, J. Polonetsky, A.R. Sadeghi, Five Freedoms for theHomo Deus, IEEE Security and privacy, 2018, 16, 15-17
5 A. Turner, Biosensors: then and now, Trends. Biotechnol., 2013, 31, 119- 120
6A. J. Bandodkar, J. Wang, Non-invasive wearable electrochemical sensors: a review, Trend. Biotechn., 2014, 32, 363-371
7 K. Stulik, Challenges and Promises of Electrochemical Detection and Sensing, Electroanal., 1999, 11, 1001-1004
8 P. R. Bueno, C. Gabrielli, Electrochemistry, Nanomaterials, and Nanostructures, Nanostr. Mat. Electrochem. En. Prod. Stor.,2009, 81-149
9 Järup L., 2003, Hazards of heavy metal contamination, Br. Med. Bull.68, 167-182.
10 W. Hao, Screen-Printed gold electrode with gold nanopartilcles modification for simultaneous electrochemical determination of lead and copper, Sensors and Actuators B:Chemical, 2015, 209, 336-342
11 N. Ratner, D. Mandler, Electrochemical Detection of Low Concentrations of Mercury in Water Using Gold Nanoparticles, Analytical Chemistry, 2015, 87, 5148-5155
12 B. Thirumalraj, D.H. Zhao, S. M. Chen, S. Palanisamy, Non-enzymatic amperometric detection of hydrogen peroxide in human blood serum samples using a modified silver nanowire electrode, J. Colloid Interface Sci., 2016, 470, 117-122.
13 F. Tamay-Cach, J. C. Quintana-Pérez, J. G. Trujillo-Ferrara, R. I. Cuevas-Hernánde, L. Del Valle-Mondragón, E. M. García-Trejo, M. G. Arellano-Mendoza, A review of the impact of oxidative stress and some antioxidant therapies on renal damage, Ren Fail., 2016, 38, 171. 14 M. Han, S. Liu, J. Bao, Z. Dai, Pd nanoparticle assemblies--as the substitute of HRP, in their biosensing applications for H2O2 and glucose, Biosens. Bioelectron., 2012, 31, 151-156 15 C. Fenzl, P. Nayak, T. Hirsch, O. S. Wolfbeis, H. N. Alshareef, A. J. Baeumner, Laser-Scribed Graphene Electrodes for Aptamer-Based Biosensing, ACS Sens.,2017, 2, 616–620 16 H. B. Noh, M. A. Rahman, J. E. Yang, Y. B. Shim, Ag(I)-cysteamine complex based electrochemical stripping immunoassay: ultrasensitive human IgG detection, Biosens Bioelectron., 2011, 26, 4429-4435
17 A. Chamorro-Garcia, A. de la Escosura-Muniz, M. Espinosa-Castaneda, C. J. Rodriguez-Hernandez, C. de Torres, A. Merkoci, Detection of parathyroid hormone-like hormone in cancer cell cultures by gold nanoparticle-based lateral flow immunoassays, Nanomedicine., 2016, 12, 53-61
11
2. General Introduction
2.1 A monitored world
A sensor is a device able to detect a change in its environment and convert this change into a readable signal that can be electrical, optical, thermal, mechanical and so on. A sensor is formed by two separate parts, namely a sensing element able to detect the parameter of interest and a transducer to get a reliable reading of the signal. This signal can have different forms: it could be binary (yes/no) or a numeric value (for example temperature, light, wind, humidity, precipitation, position, composition) and it provides us the desired information. We actually live surrounded by sensors, often without even noticing. Just to make an example, a car from 2013 has installed at least 70 sensors, while, a luxury car of the same period, has up to 300 [1]. These numbers are expected to grow and grow over time. Another sensor application is for the environmental monitoring: an interesting example can be found in the Green Watch Project. In this case, 200 sensors have been distributed among the people living in Paris. These devices were able to detect air composition and the level of noise pollution while people lived their ‘normal life’. This study shown how it is possible to drastically reduce the city pollution (and so to save money) just applying a network of sensors that work in real time and in situ [2]. One of the main challenges in the field of sensors is the real time and in situ analysis. These functions will allow the personnel/citizens to trigger a corresponding action in a fast and efficient way. Let us think about a city where air, seawater, river water, drinkable water, traffic jam and so on are regularly monitored over time: this can save a lot of money and, at the same time, it can improve the citizens quality of life, over and over.
12
FIGURE 2.1CONCEPT OF SMART CITY [3]
Another interesting application of sensors is in the field of healthcare. In the last 5-10 years, Apple and Google released different kind of ‘Smart Watches’ able to tell you how long and how good do you sleep, what is your blood pressure over a day, your heartbeat and so on. In this scenario, electrochemical sensors can play a key role: let us think about a wearable device that, regularly over time, or once/twice in a day, make a check-up of your blood, urine or sweat and alerts the person about the plausible onset of disease. Again, this system can save a lot of people and money.
13
In the last year, Wang et al. developed a 1.5µm thick, gold based, e-tattoo sensor that can be directly pasted on human skin. They tested it under different mechanical stress, like compression, stretch and twist and they found a good performance under these conditions. This e-tattoo sensor is able to measure electrocardiogram, body temperature, skin hydration, heart and respiratory rate in a non-invasive way [6]. Similarly, Ameli et al. developed a graphene-based electrode, with a sub µ-meter thickness (less than 500nm thick). The aim of this work is to decrease the cost of the e-tattoo sensor replacing gold, a biocompatible and expensive material, with a cheaper material like graphene. Different graphene-based sensors have been developed but they require expensive fabrication process, such as photolithography. Here, the graphene electrodes were fabricated by a ‘wet transfer, dry patterning’ process, that is cheaper and minimizes the chemical contamination of the electrode, providing a more reproducible and biocompatible sensor. Furthermore, this kind of e-tattoo sensor looks totally transparent and can be applied on visible part of the body, such as face or arms [7]. In the same way, Kim et al. developed a wearable temporary electrochemical sensor, made of Bismuth/Nafion, that detects zinc cation trace in sweat, from 100 to 2000 ppb, with a constant scanning rate of 5 minutes [8]. Zinc is an important component of many biological processes and its concentration in bio fluids, such as sweat, is an indicator of many physiological states. Main problems are related with a zinc deficiency owing to a loss in resistance and muscular damage. Moreover, athletes need a continuous, non-invasive and in situ monitoring of many parameters during the training. Lactase, sodium, chloride ions, pH, can be used as markers to estimate the quality of the training or, for example, to warn the athlete of a possible muscular cramp. In 2017, Anastasova et al. developed a multi-platform system able to detect, simultaneously, Na+, Lactase and pH during the training in human sweat, directly on-body. A continuous sampling of sweat is achieved using a flexible microfluidic system that brings sweat, with a constant flow rate, into the sensor
14
trough microneedles of 50 µm of diameter. [9] These examples are referred to electrochemical sensors and show how it is possible to improve human being using an appropriate, efficient and easy to use network of sensors. All the data are transferred directly, through a wireless connection, to our mobile phone that, just using an App, alerts us about a possible problem concerning our sport activity or about the water we use to drink or about our healthcare. Among the clear advantages that these new technologies may bring to the users, there is another one, maybe more hidden and less obvious: the patient care will move from the hospital to the home, drastically reducing the health care costs.
In this scenario, electrochemical (bio)sensors are perfect candidates being cost effective, small, portable, wearable, user friendly and providing an electrical output signal that can be easily controlled in remote. As a proof of that, the global market of electrochemical sensors and biosensors is expected to grow, with a Compound Annual Growth Rate (CAGR) of 9.7%, to USD 23707 million by 2022 [10]. Among all the applications of these sensors, the market of electrochemical sensors for healthcare will be by far the fastest growing, reaching USD 12689 million by 2022.
FIGURE 2.3 A) WEARABLE SENSOR FOR GLUCOSE MONITORING B) EXAMPLE OF PORTABLE POTENTIOSTAT WIRELESSLY CONNECTED WITH A MOBILE PHONE FOR HEAVY METAL DETECTION
15
This huge and fast-growing market is taking more and more place due to the development of nanotechnology. Indeed, sensitivity, selectivity and Limit Of Detection (LOD) of these sensors are highly affected by surface area and so, nanostructures like NanoWires (NWs), NanoTubes (NTs) and NanoParticles (NPs), can drastically enhance these features.
2.2 Electrochemical sensors and effect of
nano-sized electrodes
The American National Standard Insitute defines a sensor as a device which provides a usable output signal (V) in response to a specific measurand, M (or input) [11]. The output signal is often an electrical signal while the input one could be every kind of quantity or property. When the input is a concentration of a chemical present in an environment, the sensor is named ‘chemical sensor’. There are different kinds of chemical sensors, depending on the chemical reaction that occurs at the sensing surface. When the reaction is a redox reaction the electrode is named electrochemical sensor. A typical electrochemical sensing element is composed of three parts: working electrode, where the redox reaction of interest occurs, counter electrode, where a second redox reaction occurs to close the circuit, and a reference electrode, necessary to polarize the working electrode by applying a known and fixed potential.
The main feature of an electrochemical sensor, and in general of every kind of a sensor, is the calibration curve. This is the mathematical function between the input and the output, V=f (M). The main feature of an electrochemical sensor, and in general of every kind of a sensor, is the calibration curve. This is the mathematical function between the input and the output, V=f (M). It is possible to find different trends of the calibration curve such as logarithm, exponential or polynomial. Besides, electrochemical sensors quiet often show a behaviour
16
typically evidenced by the plot of Figure 2.4 where, at low value of M (the parameter to be detected) the calibration curve has a linear trend. At higher analyte concentration, the calibration curve shows a transition region, where different linear correlation can be found. At the highest analyte concentration, the calibration curve became almost flat, reaching the ‘surface saturation’.
FIGURE 2.4STANDARD CALIBRATION CURVE FOR AN ELECTROCHEMICAL SENSOR
In the case of a linear dependence, the sensor is calibrated in the linear range, where the input and the output are related by a linear equation:
𝑉𝑚= 𝑆 ∗ 𝑀 + 𝑎 (2.1)
EQ 2.1GENERAL EQUATION TO CALIBRATE AN ELECTROCHEMICAL SENSOR Where Vm is the output in the linear range, a the intercept at M=0, i.e. the value of the blank, and S is the slope of the linear interval, also named sensitivity. This is a very important feature because it is the increment in the output due to an unitary increment of the input: higher is the sensitivity, higher is the resolution of the sensor. As it is evidenced in Figure 2.4, the sensitivity is maximum in the first linear range. This is why is usual to calibrate the sensor just in this range of
17
concentration. Another important feature of the sensor is the Limit Of Detection (LOD). This is defined as the lowest concentration that, statistically, the sensor is able to detect with a reliable precision. A more precise and accurate definition of the LOD is provided by IUPAC according which, it represents the concentration that provides an output equal to the blank plus 3 times the standard error of the blank [12]. Substituting this definition into the equation (2.1):
𝑎 + 3 𝑆𝑑 = 𝑆 ∗ 𝐿𝑂𝐷 + 𝑎 (2.2)
𝐿𝑂𝐷 = 3 𝑆𝑑
𝑆 (2.3)
EQS.2.2-2.3:MATHEMATICAL PROCEDURE TO CALCULATE LOD Where S is the sensitivity and Sd is the standard error of the blank.
Other important features are accuracy and reproducibility. They are often confused despite have totally different meanings. Accuracy involves how close you get to the correct result; instead, reproducibility is how consistently you can get the same result using the same method. Figure 2.5 shows how a sensor is reproducible but not accurate or vice versa. A non-accurate sensor simply needs of a new calibration, probably due to some modification of the sensing element; instead, reproducibility is often related to some random phenomena occurring during the sensing process that modify the system itself.
18
Another important parameter is the selectivity. It involves how much the sensor can be affected by the presence of other compounds in the environment. This feature is highly important working with real sample such as blood, urine or sea water. For instance, electrochemical detection of dopamine (DA) is highly affected by the presence of ascorbic acid (AA) and uretic acid (UA) because the redox potentials of these compounds are close to the dopamine one. Unfortunately, these three compounds are present all together in the blood, where DA is normally detected, consequently, it is crucial to check the effect of these compounds on DA detection.
Briefly, other important features are:
Drift: it represents the life time of the sensor. The electrode surface can change over time, so that a new calibration could be necessary. The drift time is the average time during which a calibration is reliable;
Reversibility: it depends on how a sensor responds to the same stimulus over time. It is possible to distinguish, reversible, semi-reversible and disposable sensors.
All these features can be drastically enhanced using nanostructured based electrodes. The properties of nanostructures, such as NWs, NTs or NPs, are widely known and studied. Briefly, several novel properties appear as a dimension goes down, in addition to the surface enhancement. For instance, materials with a dimension less than 100 nm show also dramatic change of the chemical reactivity due to change in density and distribution of electrons in the outermost energy level. These changes lead to novel optical, electrical, magnetic thermal properties. A nanoparticle of about 10 nm contains about 100 atoms and 1–5% of them are on the surface [13]. Thus, compared to a massive material, the surface area and the number of ‘edge atoms’ are drastically enhanced.
19
Electrochemical (bio)sensors at nano-scale benefit arising from enhanced mass to volume ratio, electron transfer rate, reduced capacitive charging, and lower signal to noise ratio [14-15]. For instance, when the critical dimension of the electrode goes down to 10 nm, standard Butler-Volmer (BV) equation is not valid anymore, or not totally. Indeed, the effective thickness of diffusion layer, δeff, linearly depends on the nominal electrode radius, as shown in Figure 2.6.
FIGURE 2.6CONCENTRATION PROFILE AND DIFFUSION LAYER OVER 1NM AND
100 NM SCALE
When the radius is higher than 10-7 m, the diffusion layer and the Electrical Double Layer (EDL) are completely separate (dotted line of Figure 2.6). When δeff decreases up to 5nm the EDL and the diffusion layer start to overlap, enhancing mass transfer at nano-sized electrodes (continuous line of Figure 2.6) [16]. Such an effect explains the faster electron transfer kinetics at nano-sized electrodes. Formally, the BV equation cannot be used anymore and it has to be replaced by the Marcus-Hush or Marcus-Hush-Chidsey model [17].
Furthermore, nano-scale can improve performances of (bio)sensors owing to steric hindrance: indeed, most of biomolecules, like proteins and nucleic acids,
20
have dimensions of about 1-100 nm, and so the interaction and/or reaction between them is much easier.
All these issues characterize a lot of applications, not only in the field of sensors and biosensors [18-19], but also in the field of energy storage [20] and energy conversion[21], catalysis [22], ultra-capacitors [23] , and so on.
2.3 Main electrochemical techniques
The major advantage of the electrochemical sensors consists also in the opportunity to select the most suitable detecting technique in dependence on the type of analyte. Indeed, it is possible to polarize the sensing electrode by applying different potential and/or current waveforms for controlling molecules/ions reactions.
In this chapter, the main electrochemical techniques are briefly described. Primarily, it has to be highlighted the effect of the presence of water in the media. 90% of the solutions of practical interest in sensing field use water as a solvent. Water can interfere with electrode reactions through the Water Splitting Reaction (WSR):
2 𝐻2𝑂 = 𝑂2+ 2𝐻2 (2.4)
REACTION 2.1.WATER SPLITTING REACTION This reaction is the resultant of two semi-reactions:
4𝐻++ 4𝑒− = 2𝐻
2 𝐸0 = 0 − 0.059 𝑝𝐻 (𝑉) 2 𝐻2𝑂 = 𝑂2+ 4𝐻++ 4𝑒− 𝐸0 = 1.23 − 0.059 𝑝𝐻 (𝑉)
21
For example, at physiological pH, hydrogen evolution occurs at potentials more cathodic than -0.413 V, while molecular oxygen is produced at potentials more anodic than 0.817 V. These two reactions have to be always considered to properly study an electrochemical cell.
Cyclic voltammetry is one of the most used electrochemical technique to investigate the electrochemical behaviour of a materials acting as a working electrode. The electrode is polarized through a triangular potential waveform applied between reference and working electrode. The slope of the triangular waveform gives the polarization rate of the working electrode, which can be selected in dependence of the application. The current response under potential polarization is recorded and usually plotted vs. potential. Figure 2.7 shows a plot of reactant concentration vs. distance from the electrode (Figure 2.7 A) and typical CV curves at different scan rates (Figure 2.7 B).
FIGURE 2.7CONCENTRATION PROFILE DURING A CV(A) AND TYPICAL CV IN PRESENCE OF FE2+/3+ IONS AND POTENTIAL WAVEFORM (INSET)(B) When the potential is far away from the formal redox potential of the couple, E0, the current flowing through the cell is a non-faradic current. When the potential is close to E0, a faradic current starts with a consequent increase in the total current, i. This faradic current leads to a consumption of reactant and when the reactant concentration at the electrode/solution interface is depleted, owing to higher reaction rate than mass transport one, the electrode process goes under
A
22
diffusion control and a peak appears in the CV curves. For a diffusion controlled electrode process, the peak current is related to the scan rate by the Randles-Sevick equation:
𝑖𝑝 = 0,446 ∗ 𝑛 ∗ 𝐹 ∗ 𝐴 ∗ 𝐶𝑏 ∗ (𝑛∗𝐹∗𝑣∗𝐷𝑅∗𝑇 )0.5 (2.6)
EQ 2.4.RANDLES-SEVICK EQUATION
Where ip is the peak current, n is the number of electrons that take place in the redox reaction, F is the faradic constant, A the area of the working electrode, C the concentration of the redox couple, R the gas constant, T the temperature, D the diffusion coefficient of the reactant in the media, and the scan rate.
Since A is referred to the total working electrode area, CV can be used also for determining the real electrode surface when either porous or nanostructured electrodes are used. In addition, the linearity of the ip vs. 0.5 is revealing of diffusive control of the electrode process. The reversibility of the electrode reaction can be estimated by the anodic and cathodic peak separation which has to be constant with the scan rate, and equal to 0.059 V/n. Therefore, CV analysis is a valuable technique, because can provide many useful information, but it is not reliable for electrochemical sensing because gives a LOD in the µM-mM range. [24-25-26-27-28]
A more precise and useful electrochemical technique in sensing is the chronoamperometry. A general compound Ox is present in the media and the following redox reaction can occur, with a general formal potential, E0:
Ox + ne- = Red (2.7)
REACTION 2.4GENERAL REDOX REACTION
A fixed potential is applied and, at electrode potential more anodic than E0, reduction of Ox occurs, therefore, its concentration at the electrode/solution interface decreases up to depletion. The thickness of the depletion layer
23
increases over time up to a limit value of current density. As the depletion layer is established under the potential scan, the current density decreases because the depletion layer increase. Of course, the current density depends on the bulk concentration of the oxidized species in otherwise identical condition.
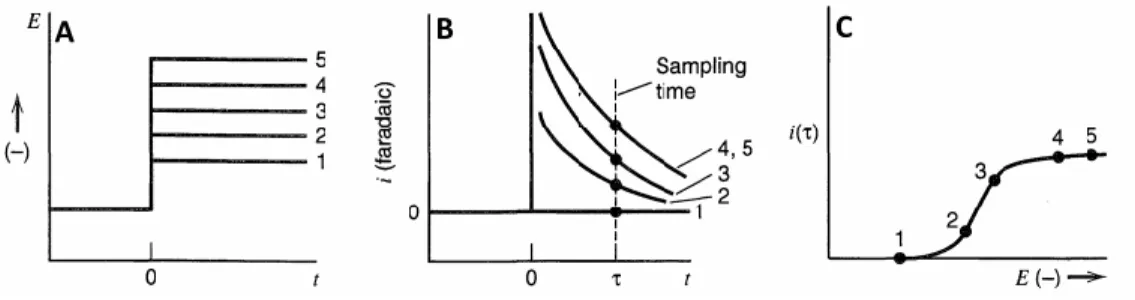
FIGURE 2.8(A):APPLIED POTENTIAL VS. TIME PLOT;(B): FARADIC CURRENT
VS. TIME PLOT FOR DIFFERENT APPLIED POTENTIAL;C: CURRENT DENSITY SAMPLED AT THE TIME OF FIG.2.8BVS.POTENTIAL
Figure 2.8 well schematizes this behaviour. Figure 2.8A shows different values of applied potential for a generic reduction process. In particular, level 1 represents a potential value more anodic than the thermodynamic one of the reduction process. Consequently, the faradic current at this potential is zero (Figures. 2.8B and C). Level 2, and 3 of Figure 2.8A represents two potential values at which the oxidised species concentration at the electrode surface is lower than the bulk one but higher than zero. Level 4 and 5 correspond at potential values at which the oxidized species is depleted at the electrode/solution interface. The current density at a time shows a sigmoidal trend as a function of the applied potential (Figure 2.8C). This last figure clearly evidences how is needles to apply a potential more cathodic than the level 4 for detecting the species Ox, because the current density does not increase as the limiting value is attained at a less cathodic level. Furthermore, a potential higher than level 4 can just decrease the selectivity of the sensor because, if other species are present in the media, they can start to react at more cathodic potentials. A theoretical explanation of this behaviour can be found by second
24
Fick’s law, with the appropriate boundary conditions. By this way, Cottrel’s equation is obtained: 𝑖𝑡 = 𝑛 𝐹 𝐴 𝐷 0.5𝐶 𝑏 ( 𝜋 𝑡 )0.5 (2.8) EQ 2.5.COTTREL’S EQUATION
Cottrel equation shows how it is possible to use chronoamperometry as a sensing technique due to the linear dependence of i from Cb. With this technique lower LOD can be achieved, in the nM-µM range, as shown in the literature. [29-30-31-32]
Chronoamperometry can be used in many cases but is not suitable for some analytes, such as heavy metals. In this case, a more effective and precise technique is the Square Wave Voltammetry (SWV), discovered by Ramaley and Krause and further developed by Osteryoungs and their co-workers. The strength of this technique is based on the application of the square waves. A typical sequence of potential waveforms to be applied to the sensing electrode is shown in Figure 2.9.
FIGURE 2.9WAVEFORM OF POTENTIAL IN SQUARE WAVE VOLTAMMETRY
25
During the scan, the potential is swept from cathodic to anodic potential but not linearly, like in the CV. The main parameters of this technique are:
ΔEp: Step Potential; ΔEs: Step Amplitude;
frequency: number of cycle per second.
As a consequence, the scan rate is not a parameter of the process but is automatically calculated by these 3 parameters. During the process, two current density values are recorded: a forward current (if, at the beginning of the pulse) and a reverse current (ir, at the end of the pulse). At the end, the difference between if and ir (Δi) is plotted vs. potential, as shown in Figure 2.10.
FIGURE 2.10TWO EXAMPLES OF PEAK ENHANCEMENT AND BACKGROUND DEPRESSION USING SWV[35]
26
Let’s consider a general reversible redox reaction like 2.7, where Ox is reduced to Red. When the potential is more anodic than the thermodynamic one E0, both the reverse and forward current will be non faradic so that Δi will be close to zero. This is the first advantage of SWV: the background current is depressed almost to zero, because non faradic current are very low. When the potential goes next to E°, Ox reduction starts with formation of Red, close to the electrode surface. A faradic current is circulating giving a peak. During the ‘reverse step’, Red is oxidized back to Ox producing a current peak opposite at the previous one. The net current will be so the difference between an oxidation and a reduction peak. This is the second advantage of SWV: the peak current in the i-E plot is enhanced compared to the one coming from the forward or reverse current. Peaks in the differential current vs. applied potential plot are indicative of redox processes, and the magnitudes of the peaks in this plot are proportional to the concentrations of the various redox active species according to:
Δ𝑖𝑝 = 𝑛 𝐹 ΔΨ𝑝 𝐷0.5𝐶𝑏
( 𝜋 𝑡 )0.5
(2.9)
EQ 2.6.SWV EQUATION [24]
where Δip is the differential current peak value, A is the surface area of the electrode, Cb is the concentration of the species, D is the diffusivity of the species, tp is the pulse width, and ΔΨp is a dimensionless parameter which gauges the peak height in SWV relative to the limiting response in normal pulse voltammetry.
The main application of this technique is for heavy metals detection. Here, an heavy metal cation is dissolved in the media and the following reaction can occur:
𝑀𝑛𝑧++ 𝑧𝑒− = 𝑀
𝑛 (2.10)
27
For heavy metals detection, SWV is slightly modified and takes the name of Square Wave Anodic Stripping Voltammetry (SWASV). Here, before to apply SWV, a fixed cathodic potential is applied for a certain time t. During this time, heavy metal is deposited on the electrode surface, according to the Reaction 2.10. Then, SWV is applied, starting from a cathodic potential higher than E0 to an anodic one. The deposited metal will be stripped off from the electrode surface, giving a current peak that is related to the metal concentration. By this technique, it is possible to detect heavy metals also in trace, up to pM-nM range as shown in the literature. [33-34-35-36-37]
Another valuable and useful technique is the Electrochemical Impedance Spectroscopy (EIS). An electrochemical cell can be seen as an electrical circuit, including resistances (resistance of the electrolyte, the electrode, charge transfer and so on) and capacitances (first of all, the double layer capacitance).
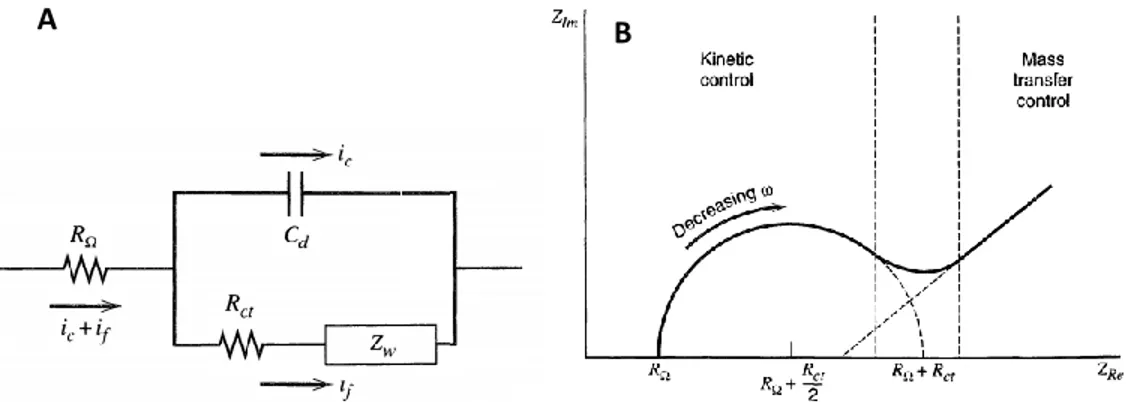
FIGURE 2.1 A): TYPICAL EQUIVALENT CIRCUIT OF AN ELECTROCHEMICAL CELL;B):TYPICAL ELECTROCHEMICAL IMPEDANCE SPECTROSCOPY (EIS)
DIAGRAM
Figure 2.11A shows a typical equivalent circuit where RΩ, Rct, Cd and Zw are the resistance of the solution, the charge transfer resistance, the capacitance of double layer and the Warburg impedance, respectively. The last one is kind of a resistance related to the diffusive mass transport. In a typical EIS measurement,
28
the total impedance of the cell/electrode is calculated over a frequency range and by this way, it is possible to check the interfacial properties of an electrode in terms of resistance and capacitance with high precision. The most common EIS plots show the real part of the impedance vs the imaginary one (Figure 2.11B). This curve is made of a semicircle and a straight line. By the semicircles, it is possible to calculate the resistances of the circuit, because it is possible to demonstrate that the radius is equal to Rtot/2. The intersect of the straight line with the x-axes represents the double layer capacitance. EIS is an hard and difficult method, highly affected by many parameters but, if properly used, can be really useful. For example, if the detection method requires physical interaction of the analyte with the electrode surface (for instance, for protein detection, where the protein has to bond with its antibody), it is possible to detect also a single molecule by this method, reaching low LOD, in the order of fM-pM. [38-39-40-41]
29
References
1 S. Abdelhamid, H. S. Hassanein, and G. Takahara, Vehicle as a Mobile Sensor, Procedia Computer Science, 2014,. 34, 286–295.
2 C. Ratti , A. Townsend, Smarter Cities - The Social Nexus, Scientific American, 2011,. 305, 42–48,.
3 http://motori.ilgiornale.it/smart-cities-globali-un-mercato-da-2-trilioni-di-dollari/ 4 https://www.engadget.com/2014/11/09/engadget-expand-mc10-wearables/
5 https://www.dezeen.com/2014/03/14/epilepsy-aid-uses-wearable-technology-to-predict-seizures/
6 Y. Wang, Y. Qiu, S. K. Ameri, H. Jang, Z. Dai, Y. A. Huang, N. Lu, Low-cost, μm-thick, tape-free electronic tattoo sensors with minimized motion and sweat artifacts, npj Flexible
Electronics, 2018, 2, 1-7
7 S. K. Amerit, R. Ho, H. Jang, L- Tao, Y. Wang, L. Wang, D. M. Schnyer, D. Akinwande, N. Lu, Graphene Electronic Tattoo Sensors, ACS Nano, 2017, 11, 7634-7641
8 J. Kim, W. R.de Araujo, I. A.Samek, A. J.Bandodkar, W. Jia, B. Brunetti, T.R.L.C.Paixão, J. Wang, Wearable temporary tattoo sensor for real-time trace metal monitoring in human sweat, Electrochem. Comunic., 2015, 51, 41-45
9 S. Anastasova,B. Crewther,P. Bembnowicz,V. Curto, H. M. Ip, B. Rosa, G.Z. Yang, A wearable multisensing patch for continuous sweat monitoring, Biosens Bioelectron., 2017, 93, 139-145 10 https://www.prnewswire.com/news-releases/global-electrochemical-biosensors-market-research-report---forecast-to-2022-300643898.html
11 https://www.ansi.org/
12 A. D. McNaught, A. Wilkinson , IUPAC. Compendium of Chemical Terminology, 2nd ed. (the "Gold Book"), Blackwell Scientific Publications, 1997
13 Bueno P.R., Gabrielli C. (2009) Electrochemistry, Nanomaterials, and Nanostructures. In: Leite E.R. (eds) Nanostructured Materials for Electrochemical Energy Production and Storage. Nanostructure Science and Technology. Springer, Boston, MA
14 P. H. Robbs, N, V. Rees, Nanoparticle electrochemistry, Phys. Chem. Chem. Phys., 2016,18, 24812-24819
15 Y. Liu, R. He,Q. Zhang, S. Chen, Theory of Electrochemistry for Nanometer-Sized Disk Electrodes, Phys. Chem. C,2010,114, 10812–10822
16 R. He, S. Chen, F. Yang, B. Wu Dynamic Diffuse Double-Layer Model for the
Electrochemistry of Nanometer-Sized Electrodes, J. Phys. Chem. B, 2006,110, 3262–3270 17 R. A. Marcus, On the theory of oxidation-reduction reactions involving electron transfer, Int. J. Chem .Phys., 1956, 24, 966–978
18K. J. Kim, J. H. Choi, S. H. Pyo, K.S. Yun, J. Y. Lee, J. W. Choi, B. K. Oh, Nanostructure Modified Microelectrode for Electrochemical Detection of Dopamine with Ascorbic Acid and Uric Acid, J Nanosci Nanotechnol. 2016;16, 3058-61.
19 C. Zhu, G. Yang, H. Li, D. Du, Y. Lin, Electrochemical Sensors and Biosensors Based on Nanomaterials and Nanostructures, Anal. Chem., 2015, 87, 230–249
20 J. Park, J. Li,W. Lu, A. M. Sastry, Geometric consideration of nanostructures for energy storage systems, Journal of Applied Physics, 2016, 119
21 S. Buller, J. Strunk, Nanostructure in energy conversion, Journ. Energ. Chem., 2016, 25, 171-190
22 Y. J. Pagàn-Torres, J. Lu, E. Nikolla, A. C. Alba-Rubio, Chapter 17-Well-Defined
Nanostructures for Catalysis by Atomic Layer Deposition, Studies Surf. Scien. Catal., 2017, 177, 643-676
30
23 P. Xiong, J. Zhu, X. Wang, Recent advances on multi-component hybrid nanostructures for electrochemical capacitors, Journ. Power Sour., 2015, 294, 31-50
24 A. Scozzari, V. Evangelista, L. Barsanti, A.M. Frassanito, V. Passarelli, P. Gualtieri, Electrochemical Sensing Methods: A Brief Review, Algal Toxins: Nature, Occurrence, Effect and Detection,2008
25 A. J. Bard, L. R. Faulkner, Electrochemical Methods: Foundamentals and applications, 2nd Edition, 2011
26 R. S. Nicholson, Theory and Application of Cyclic Voltammetry for Measurement of Electrode Reaction Kinetics, Anal. Chem., 1765, 37, 1351-1355
27 http://shodhganga.inflibnet.ac.in/bitstream/10603/88264/10/10_chapter%201.pdf 28 J. D. Wiedemann, K. T. Kawagoe, R. T. Kennedy,E. L. Ciolkowski, R. M. Wightman, Strategies for Low Detection Limit Measurements with Cyclic Voltammetry, Anal. Chem.,1991, 63, 2965–2970
29 R. G. Compton, M. E. Laing, D. Mason, R. J. Northing, P. R. Unwin , Rotating Disc Electrodes: The Theory of Chronoamperometry and Its Use in Mechanistic Investigations, Proceedings of the royal society A, 1988, 418
30 M.Sluyters-Rehbach, J.H.O.J.Wijenberg, E.Bosco, J.H.Sluyters, The theory of
chronoamperometry for the investigation of electrocrystallization mathematical description and analysis in te case of diffusion controlled growth, Journ. Electroanal. Chem. Intef. Electrochem., 1987, 236, 1-20
31 B. Patella. R. Inguanta, S. Piazza, C. Sunseri, A nanostructured sensor of hydrogen peroxide, Sens. Act. B., 2017, 245, 44-54
32J. C. Vidal, M. A. Yague, J. R. Castillo, A chronoamperometric sensor for hydrogen peroxide based on electron transfer between immobilized horseradish peroxidase on a glassy carbon electrode and a diffusing ferrocene mediator, Sens. Act. B, 1994, 21, 165-141
33 J. G. Osteryoung, R. A. Osteryoung, Square wave voltammetry: Anal. Chem., 1985, 57, 101-110 •
34L. Ramaley, M.S. Krause, Theory of square wave voltammetry, Anal. Chem., 1969, 41, 1362-1365
35V. Mirceski, S. Komorsky-Lovric, M. Lovric, Square-Wave Voltammetry Theory and Application
36 B. Patella, S. Piazza, C. Sunseri, R. Inguanta, NiO thin film for mercury detection in water by square wave anodic stripping voltammetry, CET, 2017, 60, 1-6
37 S. H. Wu, Z. Y. Zheng, J. F. Zhang, Z. W. Song, F. Fang, J. J. Sun, Subppt Level Detection of Mercury(II) Based on Anodic Stripping, Electroanal., 2015, 27, 1610-1615
38 E- Barsoukov, J. R. Macdonald, Impedance Spectroscopy: Theory, Experiment, and Applications, 2005
39 W. Reitz, A Review of: “Impedance Spectroscopy, Theory, Experiment, and Applications, Mat. Manuf. Processes, 2007, 22, 294-
40 B. Zhu, O. A. Alsager, S. Kumar, J. M. Hodgkiss, J. Travas-Sejdic, Label-free
electrochemical aptasensor for femtomolar detection of 17β-estradiol, Biosens. Bioelectr., 2015, 398-403
41 R. Salimian, L. Kèkedi-Nagy, E. E. Ferapontova, Specific Picomolar Detection of a Breast Cancer Biomarker HER‐ 2/neu Protein in Serum: Electrocatalytically Amplified Electroanalysis by the Aptamer/PEG Modified Electrode, Chem. Electro. Chem., 2017, 4, 872-879
31
Preface
Part of the experimental activity of this work has been conducted in the Tyndall National Institue at Nanotechnology Lab, Ireland (chapter 4.3) and at Catalan Institute of Nanoscience and Nanotechnology, ICN2 , – Spain (chapter 5). As it is usual in these cases, the experimental procedure and results are shared with the host Lab, therefore every detail cannot be disclosed. Despite such constraints, I will present and discuss almost completely the results and expose the experimental procedure. Here, I regret for some minor but unavoidable omission, and simultaneously I acknowledge Prof. Alan O’Riordan, Dott. Pierre Lovera and Prof. Arben Merkoci for their kind hosting and scientific assistance during my stay in Cork, and Barcelona, respectively. In addition, I would like to acknowledge the many friends and colleagues who supported and cooperate with me for the lab activity.
32
3. Sensors for hydrogen peroxide
Abstract
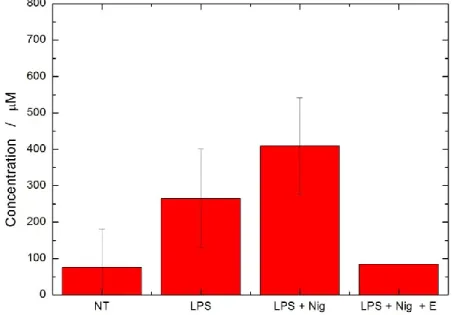
In this chapter, the development of two nanostructured sensors to detect H2O2 are described. This has relevance for both environmental and clinical applications. Indeed, its concentration in human body fluids (mainly in blood) is related to glucose concentration and can be used to evaluate the oxidative stress of our body. Today, there is not any device able to detect this compound in a easy, portable and cheap way. Currently, the sample has to be collected, moved into a laboratory, tested and, often after several days, the result is sent to the patient. The possibility to make this process shorter and easier, using electrochemistry, has been studied in this chapter. The high surface area of the electrode allowed to reach low limit of detection, in the µM range (less than 1 mg per liter). We also found that the electrode material plays an important role because a noble metal, such as palladium, has high selectivity, high stability and reproducibility, while a less noble metal, like copper, has good features but is less performing. On the other side, the copper based electrode is 10 times cheaper than the palladium one so the applicability of these sensors are different: the copper one can be used for a qualitative analysis, when minor precision is accepted, while palladium has to be used for a more precise and reliable analysis. In order to check its technological applicability, we used it to evaluate the oxidative stress by detecting hydrogen peroxide produced by different cellular culture under stressing conditions. The good results support the conclusion that just stimulated macrophages release hydrogen peroxide, whose amount can be easily detected by these sensors.
33
3.1 Introduction
Hydrogen peroxide is the simplest peroxide, with a chemical formula H2O2. A covalent bond links the hydrogen atoms while a polar covalent bond links the oxygen and hydrogen atoms. It is a non planar molecule, with a bond angle of 111°. At room temperature, it is an uncoloured liquid and is diluted in aqueous solutions. Due to the low activation energy (49 kcal/mol), it spontaneously reacts, producing water and molecular oxygen:
𝐻2𝑂2 = 𝐻2𝑂 + 𝑂2 (3.1)
REACTION 3.1.HYDROGEN PEROXIDE DECOMPOSITION REACTION
It is an exothermal reaction (-98.3 kJ/mol). The main peculiarity of hydrogen peroxide concerns the oxidation state of oxygen, equal to -1. It makes hydrogen peroxide both a reducing and an oxidant agent:
𝐻2𝑂2 = 𝑂2+ 2𝐻++ 2𝑒− (3.2.1)
𝐻2𝑂2+ 2 𝐻++ 2𝑒− = 2𝐻
2𝑂 (3.2.2)
REACTIONS 3.2.HYDROGEN PEROXIDE AS REDUCING (3.2.1) AND OXIDIZING AGENT (3.2.2)
Both these reactions produce ‘green compounds’, such as either oxygen or water, therefore, hydrogen peroxide can be used as a ‘green oxidising/reducing agent’. This is why, in the last years, many chemical plants started to use hydrogen peroxide to minimize the environmental impact of the factory.
H2O2 was discovered in 1818 by Louise Jacques Thènard, by the reaction between nitric acid and barium di-oxide [1]. Today, the main process to produce hydrogen peroxide is the oxidation of 2-etil-antrachinone to 2-alchilantrachinol producing a quiet concentrated solution (close to 40% in volume). In order to
34
obtain more concentrated solutions, a vacuum distillation is required, drastically increasing the price [2]. Actually, hydrogen peroxide concentration unit is the ‘volume’. It represents the volume of oxygen that can be produced by 1 L of a solution of hydrogen peroxide, at room temperature. It is possible to convert the ‘volume concentration’ to molarity by the following equation [3]:
𝑀𝐻2𝑂2 = 0.08931 ∗ 𝑉𝐻2𝑂2 (3.1)
EQ.3.1CORRELATION BETWEEN MOLAR AND VOLUME CONCENTRATION
At low concentration, H2O2 is a non toxic and dangerous compound, but it became really aggressive at concentration higher than 40%.
The world production of this compound is about 2.2 Mton/year and is mainly employed as bleaching agent in textile and paper industry [4], but also in pharmaceutical and medical applications and for chemical syntheses [5]. Another important application concerns treatment of waste water and contaminated soils [6-7] to remove organic impurities by Fenton’s reaction, in which hydrogen peroxide is used to generate highly reactive hydroxyl radicals, able to destroy aromatic and halogenated compounds which are difficult to remove by other methods. For many of these applications (e.g., the use as anti-pathogen agent), it is important to detect the exact concentration of hydrogen peroxide in the given environment either before or after its reaction. For instance, during Fenton’s reaction, it is fundamental to maintain suitable concentration of hydrogen peroxide for ensuring efficient degradation of the organic compounds.
In the field of health, hydrogen peroxide is a marker of oxidative stress, a pathological condition due to breakdown of the antioxidant defense system with consequent imbalance between production and elimination of oxidizing chemicals. During the course of this disease, hydrogen peroxide is released so it
35
can be used as a biomarker for a rapid and noninvasive detection of the disease [8]. Furthermore, hydrogen peroxide sensors can be used to detect glucose, for diabetic patients. When glucose reacts with its enzyme, glucose oxidase, hydrogen peroxide is produced:
𝐺𝑙𝑢𝑐𝑜𝑠𝑒 + 𝑂2 = 𝐺𝑙𝑢𝑐𝑜𝑛𝑖𝑐 𝐴𝑐𝑖𝑑 + 𝐻2𝑂2 (3.3)
REACTION 3.3.REACTION BETWEEN GLUCOSE AND GLUCOSE OXIDASE
Hydrogen peroxide detection is faster and more efficient than glucose one, therefore, a more reliable, rapid and sensitive detection can be achieved [9-10], as demonstrated by different commercial devices already in the market [11]. Hydrogen peroxide is also a secondary product of many other enzymes (alcohol oxidase, lactate oxidase, urate oxidase, cholesterol oxidase, and so on), therefore, its detection is of value in many other fields [12]. Besides its well-known cytotoxic effects, H2O2 plays an important role in living organisms, because it acts as an ‘alert’ of many biological processes, such as immune cell activation, vascular remodeling, apoptosis, stomatal closure and root growth. [13-14]
Therefore, real-time and reliable monitoring of H2O2 concentration is important. The most used methods for detection of hydrogen peroxide are IR spectroscopy, spectrophotometry, citometry and redox titration. These methods are often expensive or require very high detection time. Besides, are just qualitative methods and cannot be used for in situ and real time analyses [15]. Instead, electrochemical sensors are cheap with detection time lower than 3s. Besides, it is highly reliable and easy to produce. Among electrochemical sensors, the amperometric ones are the most used because are easier to use. Another great advantage of the amperometric sensors is that the managing costs are very low because they can work under an applied potential close to 0 V (The standard potential of hydrogen peroxide is E0 = 1.8 – 0.066 pH V (NHE)) [16-17-18].
36
Electrochemical sensors detect the presence of hydrogen peroxide owing to a redox reaction occurring at the electrode/solution interface. Consequently, performance of the sensor will be improved by increasing the surface area. For this reason, the use of nanostructures, such as nanowires, nanotubes or nanoparticles, is of advantage owing to the high surface to volume ratio which considerably improves the performance of the sensor.
Electrochemical sensors for hydrogen peroxide can be classified as bio-labeled and non-enzymatic sensors.
Bio-labeled electrochemical sensors are often more selective owing to the bio-recognition of the hydrogen peroxide by peroxidase (HRP). The high selectivity is due to the structure of the HRP (and in general to the enzyme structure): enzymes have an active site with a stereospecific interaction that allows just to the right substrate to penetrate and react. When the active site and the substrate react, the products will leave the site and regenerate the active site, therefore, the enzyme is not consumed over time.
On the other hand, the immobilization of these compounds into the electrode surface is often unreproducible and unstable [19]. For these reasons, these electrodes generally have a shelf life often lower than 7 days. The other severe drawback is the electron transfer between the enzyme and the electrode. This kind of transfer generally occurs by tunneling effect. In many proteins, the active site is shielded by a thick layer of polypeptides that make this transfer hard owing to the long distance [19].
In this field, Jönsson et al. [20] developed a graphite electrode with absorbed peroxidase for hydrogen peroxide detection. They obtained a LOD of 0.5 µM with a wide linear range but they confirmed the scarce stability. They found that just after 10 sample injections (10 measurements) the electrode loses about 10 to 15% of its initial response and more than 40% after 300 measurements. In order
37
to decrease this effect, Zhang et al. [21] modified an Indium Tin Oxide (ITO) electrode with magnetic NPs of Fe3O4, the main compound of peroxidase enzyme. They found a longer stability but the features are not so good, having a LOD of 200 µM and a linear range up to 2mM. In 2013, Xin et al. [22] slightly modified this process, by modifying a Screen Printed Carbon Electrode (SPCE) with Fe3O4-Au nanoparticles coated with horseradish peroxidase and graphene. In their work, they obtained an excellent stability over time (decrease of 10% of the current density after 28 days of storage) with a 10 times lower LOD (12 µM). Ferric hexacyanoferrate or Prussian blu (PB) is a compound morphologically similar to HRP so that has been named ‘artificial peroxidase’. Its polycrystalline structure allows small molecules to reach the active side, increasing the selectivity in comparison with Fe3O4. Big molecules, such as Ascorbic Acid (AA), Uretic Acid (UA), Potassium Oxalate (POX), glucose (GLU) cannot react with the electrode. Du. et al. [23] used electro co-deposited Prussian Blu and carbon nanotubes (CNTs) on the surface of a planar gold electrode. Due to the presence of both the CNTs and PB a LOD of 23 nM has been achieved with high sensitivity (almost 1 µA/nM). Cao et al. [24] developed a graphene based electrode with a PB layer chemically deposited via wet process. The results are really interesting, reaching a LOD of 45 nM with an extremely high stability over time. After 100 consecutive cycles, the signal remained highly stable (the current density decrease was less than 5%) while the current decrease was of about 9% over 2 weeks of storage. The main drawback of this material is its stability in neutral and alkaline media. The reduced form of PB, named ‘Prussian white’, is soluble in these solutions. In order to overcome this problem, other kinds of metal hexacyanoferrates (copper, lead, nickel) have been investigated. This aspect has been confirmed by Garjonite et al. [25] that developed a copper hexacyanoferrate (CHFH) based electrode. They compared the electro-catalytic stability of PB electrodes with CHFH electrodes and found interesting results. Operating at pH5, PB based electrodes are stable for H2O2
38
detection, but when the pH arises to 7 (physiological pH), the PB based electrode loses 45% of its sensitivity from the 1th to 3th cycle. This drop diminishes a little bit by working at anodic potential (0.6V instead of - 0.2V) but it is still present and deep. Using CHFH electrode, the sensitivity at low pH (=5) is lower than PB electrode, but it drastically increases (+25% working at cathodic potentials and +100% at anodic potential) working at pH 7. Ali Eftekhari [26], developed an aluminum electrode covered with cobalt hexacyanoferrate film and they demonstrated how it is possible to work at neutral pH, achieving a LOD of 200 nM.
In the case of non-enzymatic sensors, metals, metallic oxides, and carbonaceous materials has been investigated, each with different morphologies such as NWs, NTs and NPs. The reduction of hydrogen peroxide to water occurs on these materials through an adsorption mechanism where the Rate Determining Step (R.D.S.) is the formation of adsorbed OH (OHads) [27].
H2O2 (bulk) = H2O2 (surface) (3.4.1) H2O2 (surface) + e−= OH−+ OHads (3.4.2)
OHads+ e−= OH− (3.4.3)
2OH−+ 2H+ = 2H
2O (3.4.4)
REACTIONS 3.4.MECHANISM OF ELECTRO REDUCTION OF HYDROGEN PEROXIDE
Metallic atoms such Ag, Pd, Cu, and their alloys can act as active sites for OH adsorption, suggesting that the use of nano-structured sensors based on these metals should imply an increase of the reaction kinetics, with consequent better performance of the sensor. Since performances of the sensor can be improved considerably by enhancing active area, the use of different shaped nanostructures, such as nanowires, nanotubes or nanoparticles is of great advantage. Nasirizadeh et al. [28] have shown that multiwall carbon nanotubes
39
on glassy carbon electrode have excellent catalytic activity and reproducibility for detecting hydrogen peroxide, reaching a LOD of 0.27 µM and an excellent stability. They were also able to detect H2O2 in orange juice. About metal-based electrode, Nie et al. [29], developed a Pd nanocube modified electrode to detect H2O2. They found good features, with a LOD of 7.4 µM and a wide linear range up to 24mM. Furthermore, the interference from other compound was negligible and the standard deviation was lower than 9%. Nevertheless the good features of this enzyme-free sensor, palladium is an expensive material. Selvaraju et al. [30] fabricated a Cu-NPs modified glassy carbon electrode and they found a LOD of 0.5 µM. Anyway, the good result in term of LOD was not supported by stability and linear range. In fact, the linear range was really narrow, from 0.5 to 8 µM. In addition, the electrode properly worked just for 1 week. Furthermore, they did not test the nanostructured electrode against any interference compound, that is mandatory for an enzyme-free electrochemical sensor. In recent years, bimetallic nanomaterials have attracted great attention for application in many fields, including detection of hydrogen peroxide. Xiao et al. [31] modified in 2008 a chitosan film with AuPt-NPs, using an electrodeposition method. Chitosan has the property to adsorb different material so that has been used to trap the metal ions that were cathodically electrodeposited. A really low LOD of 0.5 nM has been reached. They tested the electrode with real samples, as well (honey, milk, urine and plasma) obtaining excellent results as confirmed by a standard photometric method. The good features of this electrode should come from the combination of Au and Pt: Pt is an excellent electroactive material but OH groups hardly desorb from it. The authors suggest that gold decrease this effect, increasing the electro activity of the electrode. Table 3.1 summarizes most of the example reported.
40
TABLE 3.1.EXAMPLES OF ELECTROCHEMICAL SENSORS AND BIOSENSORS FOR HYDROGEN PEROXIDE
N.S.NOT STUDIED,BLBIO LABELLED,MEAMIMIC ENZYMATIC ACTIVITY,NLNOT LABELLED
LOD-ULR (µM)
Stab. Days
Select. Real sample Type of
sensor HRP/graphite 0.5-500 300 cycles N.S. N.S. BL 20 Fe3O4/Au/ HRP
12-2500 28 UA,AA,GLU Lenscare sol. BL 22
Fe3O4-NPs 10-2000 30 UA, AA N.S. MEA 21
Graphene/PB 0.045-120 100 cycles
N.S. N.S. MEA 24
PB/CNTs 0.023-5000 N.S. N.S. N.S. MEA 23
Co-HCF 0.2-1700 120 K, Cl, Br, I, Na Seawater MEA 26
CNTs 0.27-28 N.S UA,AA,OXA,DA Orange Juice NL 28
Cu-NPs 0.5-8 7 N.S. N.S. NL 30
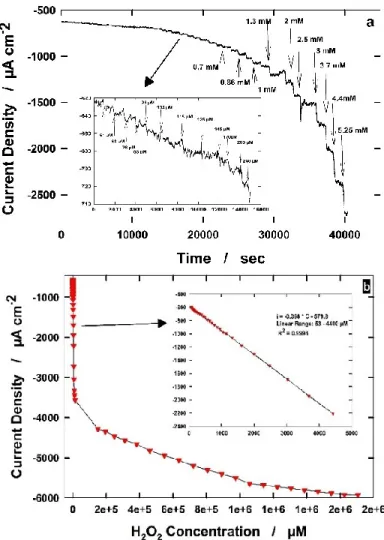
Cu-NWs 13.8-3700 7 AA, AU, GLU N.S. NL This
work
Pd-NPs 7.4-24000 N.S N.S. N.S. NL 29
Pd-NWs 13.3-4400 30 AA, UA, GLU, POX
N.S. NL This
work AuPt NPs 0.003-0.35 30 Metals,
cysteine, etoh
Milk, honey, urine, plasma
NL 31
AMT Analysenmesstechnik GmbH and Dulcostest [32-33], already developed two prototypes of electrochemical sensors for hydrogen peroxide, that are available in the market (Figure 3.1 A-C). The AMT sensor has a wide linear range (8mM-4200 mM) but with a quiet high LOD (8 mM). It is able to make a measurement each 2 seconds and is stable in a wide range of pH (0-11). If