Contents
1 Introduction 1
1.1 Hemostasis . . . 2
1.2 Blood Coagulation . . . 2
1.3 Modulation of Coagulation Factor Levels . . . 8
1.4 Present Investigation . . . 10
2 The effects on a healthy diet in the coagulation factors levels and throm-bin generation in middle-aged women with moderate CVD risk 14 2.1 Introduction . . . 15
2.2 Material and Methods . . . 16
2.3 Results . . . 20
2.4 Discussion . . . 24
3 The effects of physical training on the coagulation and inflammatory factors levels in uremic patients: a pilot study 33 3.1 Introduction . . . 34
3.2 Material and Methods . . . 35
3.3 Results . . . 38
3.4 Study limitations and discussion . . . 40
4 The Blood Coagulation Factor V 48 4.1 Gene and Biosynthesis . . . 48
4.2 Structure . . . 50
4.3 Activation . . . 52
4.4 Procoagulant FV activity . . . 57
4.5 Anticoagulant FV activity . . . 63
4.6 FV deficiency . . . 64
5 Modulation of Factor V levels by intragenic components 72 5.1 Introduction . . . 73
5.2 Material and Methods . . . 74
5.3 Results . . . 80
5.4 Discussion . . . 88
6 Conclusion 97
Chapter 1
1.1
Hemostasis
The term hemostasis defines a dynamics process aimed at maintaining the blood fluid under physiological conditions, and at limiting the blood loss in case of vascular lesion. This homeostatic process involves the vascular endothelium, platelets and a number of circulating and transmembrane proteins.
In the resting state endothelial cells provide a non-thrombogenic surface that inhibits the platelets adhesion and blood coagulation. Moreover, the synthesis of prostacyclin and heparin-like substances, and the presence of protein complexes (thrombin-thrombomodulin), leading to generation of anticoagulant proteins (activated protein C), prevents clot forma-tion in normal blood vessels [1].
In reaction to the vessel wall injury, damaged endothelial cells expose negatively charged phospholipids and release procoagulant proteins, platelets adhere to macromolecules in subendothelial layer and aggregate to form the primary hemostatic plug, necessary to tem-porary blocks the blood loss.
The interaction between platelets and the damaged endothelium is allowed by a large multimeric plasma protein, named von Willebrand Factor (vWF), that acts as a bridge between the sub-endothelium collagen and specific receptor on platelet surface [1].
The platelet activation that occurs in this early phase induces specific morphologic and biochemical alterations on their membrane surface and the release of molecular components necessary for the initiation and propagation of blood coagulation.
Later, as wound healing occurs, fibrin clot is broken down and removed [2].
1.2
Blood Coagulation
Blood coagulation involves a stepwise participation of a large number of plasma proteins, that progressively amplify the triggering signal in order to massively generate thrombin. Newly formed thrombin is necessary to stabilize the primary hemostatic plug.
factor X [FX], factor XI [FXI], factor XII [FXII] and prothrombin [PT]) are all vitamin K-dependent serine proteases. They circulate in plasma as inactive precursors (zymogens), and they need to be activated in order to participate in the coagulation reactions. To increase the catalytic efficiency of the serine proteases, allowing a rapid response to injury, the coagulation system also provides three cofactors: tissue factor (TF), factor V (FV) and factor VIII (FVIII).
For a long period, the blood coagulation has been described as a process where each clot-ting factor as proenzyme could be converted to an active enzyme, participaclot-ting then to the activation of another one (waterfall model ). In particular, this classical view divided the coagulation process into two pathways: an intrinsic pathway, so named because all the components are present in blood and, an extrinsic pathway, in which the subendothelial cell membrane protein TF is required in addition to circulating components. The initiation of both pathways finally resulted in the activation of FX and the generation of thrombin (also called FIIa), Fig. 1.1.
This classic concept is now integrated into a more comprehensive view of blood coagula-tion, where the cellular components acquire more importance, Fig1.2 [3].
The process of blood coagulation starts by the exposures of TF-expressing cells to the blood flow.
TF is an integral membrane glycoprotein that it is constitutively expressed on cells such as fibroblasts, smooth muscle cells, activated monocytes, activated platelets, and even cellular-microparticles but not on resting endothelium [4]. When the vessel integrity is interrupted, it becomes exposed to the blood flow, where it interacts with the circulating FVII. TF-bound FVII becomes susceptible to activation by trace amounts of proteases present in blood, among which FVIIa itself. The new formed TF-FVIIa complex activates small amounts of FX and FIX.
FXa associates with its cofactor, activated Factor V, and forms the so called prothrombinase-complex on the surface of the TF-bearing cells, leading the activation of small quantity of circulating PT into Thrombin.
pro-motes the secretion of partially activated FV from their α-granules. Moreover the small amount of newly generated Thrombin contributes to the activation of the cofactors FV, FVIII and, it is also sufficient to activates FXI, which in turn activates FIX.
The next phase, the so called amplification of clot formation, occurs on the surface of activated platelets. In this phase the FXa generation is supported by the prothrombinase complex on the surface of activated platelets and by FIXa-FVIIIa, the so called tenase complex. Additional FIXa can be supplied by platelet-bound activated-FactorXI.
More than 95% of the total amount of thrombin production takes place in the amplification phase, after initial clot formation [5]. This excess of thrombin has been proposed to play an important role in clot stabilization by activating Factor XIII [FXIII], (the fibrin stabi-lizing factor [6]), cleaving the platelet protease-activated receptor-4 [PAR-4] (contributes to the full activation of platelets [7]), and, activating thrombin activable fibrinolysis in-hibitor [TAFI] [8]. TAFI is a carboxypeptidase that removes terminal lysine residues from fibrin, thereby removing potential binding sites for fibrinolytic enzymes and enhancing clot resistance to fibrinolysis [9].
1.2.1
Macromolecular complexes in blood coagulation
All the enzymatic proteins involved in coagulation are vitamin K-dependent serine pro-teases. They show an highly homologous catalytic domain and share a number of con-served structural motifs (Gla domains, EGF-like domains, kringle domains), that mediate interactions with other proteins and membranes.
Their activation, required to participate in the coagulation process, is done by limited proteolysis of determined peptide bounds. In contrast to other serine proteases, the blood coagulation proteases have evolved versatile and sensitive regulatory mechanisms for con-trolling the specificity of substrate recognition, mediated by specific surfaces of the enzyme far away from the catalytic site (exosites) [10].
Activation of clotting factors does not occur in the solution phase, but within membrane-bound macromolecular complexes, each comprising a vitamin K-dependent serine-protease,
a non-enzymatic protein cofactor, a zymogen substrate, and calcium ions. The protein-phospholipids and protein-protein interactions within the macromolecular complexes en-hance reaction rates by several orders of magnitude. Moreover, the localization of different enzyme complexes on the same membrane surface allows product channelling between suc-cessive reaction centers, a circumstance that protects activated factors from inactivation by circulating inhibitors [11].
Finally, macromolecular complexes offer several opportunities for the control of coagula-tion reaccoagula-tions. In fact, complex assembly requires a number of simultaneous events: the conversion of a zymogen to the active serine protease, the activation of a procofactor to the active cofactor and the availability of negatively charged phospholipid membranes. This latter condition guarantees the confinement of the coagulation process to the sites of injury.
Figure 1.1: The waterfall model of blood coagulation. The point of integration between the intrinsic and extrinsic pathways in this model occurs with factor IX activation.
1.2.2
Regulation
Mechanisms of coagulation are conveniently regulated to limit the extent of activation once it has been triggered, Fig. 1.2.
Figure 1.2: Blood coagulation cells based model. Upstream coagulation factors are acti-vated by TF exposed following vessel injury. FXa and FIXa amplify the triggering signal together in order to massively generate thrombin. Thrombin (FIIa) also activates upstream coagulation factors, forming a strong positive feedback ensuring rapid activation. Throm-bin itself plays a role in its own inhibition by Throm-binding the surface protein thrombomodulin (TM), catalyzing the conversion of protein C (PC) to activated protein C (APC). Other rel-evant inhibitory complexes are represented by the Tissue Factor Pathway Inhibitor (TFPI) and th Antithrombin (AT).
Since the active cofactors of the extrinsic pathway (TF, FVa and FVIIIa) promote throm-bin production by massively enhancing the catalytic efficiency of their respective enzyme, these cofactors play important role in both the positive and negative regulation of throm-bin generation.
Tissue Factor Inhibitor Pathway
The tissue-factor pathway inhibitor (TFPI) regulates the initiation phase of blood co-agulation [12]. TFPI has a modest inhibitory capacity towards FXa, but it becomes a potent inhibitor of the TF-FVIIa complex.
Recently, it has been shown that Protein S lower the ki of FXa/TFPI complex
forma-tion by ∼10 fold, thereby significantly accelerating FXa inhibition [13]. The stimulation produced by protein S explaines how full-lenght TFPI can effectively inhibits the extrinsic FXa generation at its low physiological plasma concentration.
As the TF-FVIIa complex is turned off by the TFPI-FXa complex, further generation of FXa is strictly dependent on the intrinsic tenase complex (FIXa-FVIIIa). The importance of this mechanism is underscored by the lethal phenotype of TFPI knock-out mice[14].
Protein C anticoagulant system
The activated protein C (APC) system inhibits the propagation phase of the coagula-tion by down-regulacoagula-tion the activity of the prothrombinase and intrinsic tenase complexes [15]. The severe thrombotic diseases affecting patients with homozygous protein C (PC) deficiency, show the physiological importance of the PC system.
Similar to the procoagulant serine proteases, the PC circulates in plasma as a zymogen and needs to be activate to gain its activity. Its activation is given by thrombin in com-plex with thrombomodulin (TM), expressed on the membrane of intact endothelial cells. The endothelial PC receptor (EPCR) is also necessary in the thrombin-TM dependent PC
activation Fig. 1.2 [15].
APC down regulates the blood coagulation by limited proteolytic cleavage of FVIIIa and FVa on the membrane surface, in the presence of cofactors. To fully inactivate FVa, APC requires the presence of the protein S. Otherwise the inhibition of FVIIIa requires the synergistic contribution of both PS and FV ( see chapter 4) [16]. The inactivated forms of FVa and FVIIIa have no cofactor activity and are subsequently rapidly removed from circulation.
Serine proteases inhibitors
Blood contains a number of circulating serine proteases inhibitors, known as Serpins [17]. They are substrate analogues, able to form equimolar irreversible complexes with the target protease. The binding with the serpin in fact, induces a distorsion of the enzyme structure and the loss of its function. This inactive complex is then removed from circulation. Thrombin is inhibited by the serpin Antithrombin (AT), heparin cofactor II (HCII), Pro-tein C inhibitor (PCI), whereas FXa can be inhibited by AT and PCI only. The activated protein C (APC) is mainly inhibited by PCI and α1-antitrypsin.
1.3
Modulation of Coagulation Factor Levels
Although the hemostatic system contains numerous controls to ensure function within the normal range, hemostasis is nevertheless sensitive to perturbation.
In the majority of the healthy population the concentrations of and anticoagulant pro-teins vary significantly. Generally clinical coagulation laboratory values for the reference of the healthy population range from 50% to 150%.
Genetic and environmental factors contribute to this heterogeneity, influencing the biosyn-thesis, the utilization and the clearance of all hemostatic proteins Fig.1.3 [18].
The coagulation molecules are in fact extremely complicated proteins that required a variety of processing steps, including post-translational modifications and proteolytic cleav-ages. In addition, extracellular modifications by both biologically directed processes and environmental accidents may further alter the circulating product. As a consequence of these modifications, the number of variable forms of clotting proteins increases , partially explaining the variability of the so called hemostatic proteome.
Even among the well defined, single gene disorders of hemostasis and thrombosis, con-siderable variability remains to be explained. For many genetic diseases, not everyone inheriting the disease-causing mutation manifests clinical symptoms, a phenomenon re-ferred to by geneticists as incomplete penetrance. For example, in families with typical autosomal dominant type 1 von Willebrand disease (VWD), penetrance is generally in-complete (50% or lower) [19]. In addition, among those individuals in the VWD family who do express bleeding symptoms, the severity of this bleeding can also be highly vari-able, a phenomenon referred to as variable expressivity.This suggests that multiple genetic, acquired and environmental factors influence the possibility of an individual to undergo a clinically significant hemorrhagic or thrombotic event [20]. Moreover the concomitant presence of genetic defects in an individual, the so called gene-gene interaction, also in-fluence the normal or predicted levels of clotting factors. The best defined examples of a human modifier gene is the ABO blood group, that concerning the hemostasis is known to be a major genetic modifier of plasma VWF level, accounting for approximately 30% of its genetic variation [21].
Disease states, drug consumption, and behavior (smoking, diet, sedentariness,...), can in-fluence the levels clotting factors, thus conditioning the hemostatic balance.
Taken together these considerations indicate that only few informations, regarding the het-erogeneity of the plasma vitamin K-dependent proteins and the influence on their biological performance, are available.
1.4
Present Investigation
During the last decades there has been an increasing attention to the genetic or environ-mental factors that can modulate the plasma levels of blood coagulation factors.
The general objective of my work has been to shed a light on the relationships between determined acquired or genetic components and the blood coagulation phenotype. This could be instrumental to discover new parameters in the evaluation of risk for thrombotic or hemorrhagic events.
The first part of my doctoral work has been spent in evaluating the variation of several blood coagulation parameters by well defined diet or a controlled physical training, in populations with moderate to severe cardiovascular risk. The results of this research are reported on chapter 2 and 3, respectively.
In the last part, I was involved in a methodologically different project, aimed at investi-gating the impact of naturally occurring mutation (R1698W) of FV in its structure and function.
The FV R1698W mutation results in FV deficiency, due to a severe reduction in FV cir-culating levels. The clinical symptoms of FV deficiency may vary from severe bleeding
Figure 1.3: The hemostatic balance, figure from [22]. With minor fluctuation, the system is designed to operate in a wide range (grey). Genetic and environmental modifiers can cause systemic malfunction, inducing an elevated susceptibility to either bledding or thrombosis.
symptoms, to no symptoms at all.
Identifying the molecular basis underlying this disease will help explaining this variable clinical phenotype. The results of this research as well as future investigations are re-ported on chapter 5. Moreover a brief introduction regarding the biology and the role of FV is provided in chapter 4.
Bibliography
[1] Furie B and Furie BC The molecular basis of blood coagulation. Cell, 1988, 53: 505-518 [2] Riddel J P, et al., Theories of blood coagulation. Journal of Pediatric Oncology Nursing, 2007,
24(3): 123-131.
[3] Hoffman M and Monroe DM. Coagulation 2006: a modern view of hemostasis. Hematol Oncol Clin North Am 2007; 21(1):1-11
[4] Mackman N et al., Role of the extrinsic pathway of blood coagulation in hemostasis and thrombosis. Arterioscler Thromb Vasc Biol 2007; 27(8):1687-93.
[5] Mann KG, et al. The dynamics of thrombin formation. Arterioscler Thromb Vasc Biol. 2003; 1;23(1):17-25.
[6] Lorand L., Factor XIII: structure, activation, and interactions with fibrinogen and fibrin. Annals of the New York Academy of Sciences, 2001, 936: 291-311.
[7] Ofosu FA., Protease activated receptors 1 and 4 govern the responses of human platelets to thrombin. Transfusion and Apheresis Science, 2003, 28(3): 265-8.
[8] Bajzar L, et al. Purification and Characterization of TAFI, a Thrombin-activable Fibrinolysis Inhibitor. Journal of Biological Chemistry, 1995, 270: 14477-84.
[9] Nesheim M. Current Opinion in Hemathology, 1998, 5: 309-313.
[10] Krishnaswamy S. Exosite-driven substrate specificity and function in coagulation. J Thromb Haemost. 2005 Jan;3(1):54-67.
[11] KG Mann, et al. Surface-dependent reactions of the vitamin K-dependent enzyme complexes Blood, 1990; 76: 1 - 16.
[12] Crawley JTB and Lane DA, The Haemostatic Role of Tissue Factor Pathway Inhibitor Arteriosclerosis, Thrombosis, and Vascular Biology. 2008; 28:233-242
[13] Hackeng TM, et al., Protein S stimulates inhibition of the tissue factor pathway by tissue factor pathway inhibitor. Proc Natl Acad Sci U S A. 2006; 28;103(9):3106-11
[14] Huang Zh et al., Tissue Factor Pathway Inhibitor Gene Disruption Produces Intrauterine Lethality in Mice Blood 1997;90(3):944-951
[15] Dahlback B, Villoutreix BO., The anticoagulant protein C pathway. FEBS Lett 2005; 579: 3310-6.
[16] Thorelli E et al., Cleavage of factor V at Arg 506 by activated protein C and the expression of anticoagulant activity of factor V. Blood 1999; 93(8):2552-8.
[17] Gettins PG. Serpin structure, mechanism, and function. Chem Rev. 2002;102(12):4751-804. [18] Mann GK, et al.Does the genotype predict the phenotype? Evaluations of the hemostatic
proteome. Journal of Thrombosis and Haemostasis, 2004, 2: 1727-34.
[19] Nichols WC, et al. von Willebrand disease. Thrombosis and Hemorrhage, 3th edn. Lippincott Williams Wilkins, 2003: 53959.
[20] Ginsburg D., Identifying novel genetic determinants of hemostatic balance. J Thromb Haemost. 2005 Aug;3(8):1561-8.
[21] McGrath RT et al. Platelet von Willebrand factor - structure, function and biological impor-tance. Br J Haematol. 2010 Jan 11. [Epub ahead of print]
[22] Westrick RJ et al., Modifier genes for disorders of thrombosis and hemostasis. J Thromb Haemost. 2009 Jul;7 Suppl 1:132-5.
Chapter 2
The effects on a healthy diet in the coagulation
factors levels and thrombin generation in middle-aged
women with moderate CVD risk.
Based on:
Reduced FVII and FVIII levels and shortened thrombin-generation times during a healthy diet in middle-aged women with mild to moderate CVD risk.
Passaro A*, Calzavarini S*, Volpato S, Caruso P, Poli A, Fellin R, Bernardi F.
Journal of Thrombosis & Haemostasis. 2008; 6(12): 2088-94.
2.1
Introduction
Diet affects the hemostatic system [1] [2], a suitable target for interventions aimed at re-ducing the risk for cardiovascular disease (CVD) [3] [4].
Increased levels of hemostatic factors, including fibrinogen, factor VIII (FVIII), factor VII (FVII), tissue factor (TF) and von Willebrand factor (vWF) have been related to increased CVD risk [5]-[9], in line with the key role of coagulation factors in thrombus formation. Furthermore, the causal contribution of coagulation factor levels to CVD is supported, although indirectly, by the clinical benefit of anticoagulant therapy in patients with acute coronary syndrome [10] [11].
During the past decades the overall CVD mortality has declined but only a modest reduc-tion has been observed among women [12], which might suggest that primary prevenreduc-tion programs are less effective in women than in men. Although changes of life-style in pre-menopausal women might represent an effective prevention strategy aimed at enduring risk factor modifications, little is known about haemostatic variations induced by diet in this population.
The aim of this work was to provide a detailed evaluation of the impact of a well defined intervention strategy on the hemostatic system in pre-menopausal middle-aged women with mild to moderate risk for CVD. In particular, we investigated the effects of an inte-grated healthy diet on a wide panel of hemostatic variables and on an overall coagulation functional test. Noticeably, the rapid turnover of most coagulation factors would enable to efficiently monitor the response to the intervention. Coagulation variations were also inves-tigated in relation to specific metabolic and inflammatory parameters previously associated with thrombotic cardiovascular events [12] [13].
2.2
Material and Methods
2.2.1
Study Population
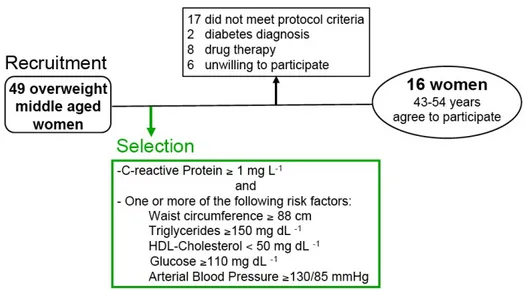
A group of middle-aged overweight (BMI ≥ 25 kg/m2) women was invited to participate in this study, Fig. 2.1. Forty-nine volunteers were screened for eligibility in accordance with the following inclusion criteria: C-reactive protein (CRP) ≥1 mg/l in two different assessments; and one or more of the following CVD risk factors (waist circumference ≥ 88 cm; triglycerides≥150 mg/dL; HDL-cholesterol <50 mg/dL; arterial blood pressure ≥ 130/85 mmHg; plasma glucose ≥ 110 mg/dL). Exclusion criteria were: average daily ethanol intake > 30 g over the last 5 years; clinical diagnosis of diabetes mellitus according to the American Diabetes Association Criteria [14]; diagnosis of menopause according to the American Association of Clinical Endocrinologists [15]; history of cardiovascular disease; current therapy with hormonal drugs, anti-thrombotic and/or anticoagulant, ACE-inhibitors, Angiotensin II Receptor Blockers, and vitamin supplementation. Fifteen women had CRP levels <1 mg/l; 8 were using ACE inhibitors or hormonal replacement therapy, one was on menopause state, two had diabetes, one did not have the above stated CVD risk factors, and six declined to participate. Sixteen women agreed to participate and completed an independently validated dietary questionnaire on alcoholic intake and eating habits.
2.2.2
Intervention
The protocol of this open-label, non-randomized intervention includes four phases (84 days) and are summarized in Fig. 2.2. We integrated the National Cholesterol Education Program-Adult Treatment Panel-III (NCEP-ATPIII) dietary recommendations with the guidelines of the scientific advisory committee of the American Heart Association, based on the effects induced by a Mediterranean-style diet on the risk of cardiovascular disease [16]. During the first 21 days (T0-T21) all subjects received an isocaloric diet (carbo-hydrates 57%, proteins 13% and lipids 30%) according to Therapeutic Lifestyle Changes
ATPIII [4]. The energy intake was calculated for every subject based on basal metabolic rate and physical activity levels. Participants were not allowed to consume any alcoholic beverage, extra virgin olive oil, fish and green and black tea, rich in omega-3, polyphenols and antioxidants. 180 mL/day of monovarietal dry white wine (11% alcoholic strength) was added at T21. This alcoholic beverage provided 20 g of alcohol/day intake. Based on the postulated anti-inflammatory effects the diet was integrated during the third phase (T42 -T63) with extra virgin olive oil, low index carbohydrates, 2 portions of salmon and 4 portions per week of nuts. In the last phase (T63-T84) participants were treated as in T0-T21.
A daily food intake diary monitored the compliance with the protocol during the study, and after each phase a clinician assessed any adverse effects. The Human Research Ethics Committee of the Azienda Ospedaliera-Universitaria of Ferrara approved the study proto-col.
2.2.3
Anthropometric Parameters
Anthropometric measurements were taken according to standardized procedure. Fat mass was also determined by tetrapolar bioelectric impedance analysis (Dietosystem Ltd, Mi-lano).
2.2.4
Lipids and Inflammation Markers
Blood samples were collected at the beginning of each study phase, after overnight fast-ing. Serum and plasma samples aliquots were stored at 80C. Serum total cholesterol and triglycerides levels were determined using standard enzymatic techniques (Roche Di-agnostics, GmbH, Basel, Switzerland). To measure HDL-Cholesterol, apo B-containing lipoproteins were precipitated from plasma by use of phosphotungstic acid and Mg2+. LDL cholesterol was calculated according to Friedewald’s formula. High sensitivity CRP (hsCRP) levels were measured (inter-assay coefficient of variation 5%) by particle-enhanced immunonephelometry (Roche Diagnostics, GmbH, Basel, Switzerland). Serum Interleukin-6 (IL-Interleukin-6) and and Tumor Necrosis Factor-alpha (TNF-α) were quantified using commercial ELISA (BioSource International Inc., California, USA). Intra- and inter-assay variation coefficients for, IL-6 and TNF-α ranged from 1.8to5.4% and from 0.9 to 9.9%, respectively.
2.2.5
Plasma Coagulation Factors
Antigen levels of TF, FVII and FVIII were determined by commercial ELISA (TF Amer-ican Diagnostica, Greenwich, CT; FVII and FVIII Affinity Biologicals Inc., Ancaster, Canada). The intra-assay coefficients of variation for TF, FVII and FVIII assays were 12.8%, 7% and 8.7%, respectively, while the inter assay coefficient were 14.7%, 7.3% and 7, 4% respectively. To evaluate the vWF antigen levels we used the ELISA protocol pre-viously described [17]. The intra-assay and inter-assay coefficients of variation for vWF ELISA assay were 6.5% and 15%, respectively. Antigen levels of FVII, FVIII and vWF were expressed as percentage of healthy plasma in-house pool. Fibrinogen levels were mea-sured by a prothrombin time derived method with a turbidimeter kit (Diagen, Thame, UK).
2.2.6
Thrombin Generation Measurements
Calibrated automated thrombin activity measurement was performed as described else-where [18]. Platelet poor plasma (PPP) samples were centrifuged at 23000 g at 4C for 1 hour before testing. Coagulation was triggered in recalcified PPP by addition of 1 pM re-combinant human TF and 4 µM phospholipids (PC:PS 80:20) at 37C. All experiments were carried out in duplicate. The assay variability was lower than 3%. The slope of thrombin generation curves was calculated using the following formula: [Peak (nM)/(ttpeak (min)-lag time (min))].
2.2.7
DNA Isolation and Analysis of Genetic Polymorphisms
DNA was extracted from peripheral blood leukocytes by salting-out method. The ABO blood group of patients was determined by genotyping as previously described [19]. FVII gene polymorphisms were analyzed as described [20].
2.2.8
Statistical Analysis
Data are presented as mean standard deviation for parameters with normal distribu-tion and as median with interquartile range for parameters with skewed distribudistribu-tion (TG, hsCRP, IL-6, TNF-α). In order to approximate a normal distribution, these variables were analyzed after log-transformation. Pairwise correlations were estimated using Pear-son correlation coefficient. Differences in mean values across study phases were analyzed using analysis of variance (ANOVA) for repeated measures and analysis of covariance (ANCOVA). After multiple comparisons, p values were adjusted with Bonferronis method. Statistical and graphical data analyses were performed using Stata 9 (StataCorp. 2005. Stata Statistical Software: Release 9. College Station, TX: StataCorp LP) and R language (R Foundation, version 2.6.1).
2.3
Results
2.3.1
Variation in Body Composition, Lipid and Inflammatory
Parameters
Variation of anthropometric, lipid, and inflammatory parameters of the 16 women who completed the study protocol are summarized in table 1. The subjects showed a clear and progressive reduction in BMI (P=0.001) throughout the study period. The BMI decline was paralleled by reduction of waist circumference (P=0.005) and, although as trend, of fat mass (P=0.096). Total and LDL cholesterol levels were significantly reduced over time with the most important changes observed after the first study phase (T21 vs T0; P<0.05). The degree of change of anthropometric and lipid parameters was in good agreement with previous reports [21]. HDL-cholesterol and triglyceride levels did not show appreciable variation over time, even after moderate alcohol intake, reported to affect their levels. At baseline median CRP was 2.2, nine women had values higher than 2 mg/L and five higher than 3 mg/L. The inflammatory profile did not significantly change throughout the
Parameters T0 T21 T42 T63 T84 P BMI (kg/m2) 29.2 ± 2.7 28.4 ± 2.7 28.0 ± 2.4 27.8 ± 2.4 27.4 ± 2.6 0.001 WC (cm) 86.7 ± 6.3 85.6 ± 6.4 83.9 ± 6.4 83.1 ± 5.2 83.9 ± 5.6 0.005 TC (mg/dL) 238 ± 40 213 ± 35 209 ± 38 215 ± 45 222 ± 43 0.011 HDL-C (mg/dL) 58 ± 14 55 ± 15 53 ± 12 57 ± 13 57 ± 10 0.375 TG (mg/dL) 98 (71-118) 77 (52-112) 96 (77-106) 90 (68-114) 90 (73-109) 0.127* hsCRP (mg/L) 2.2 (1.4-3.5) 1.9 (1.3-3.2) 1.9 (1.1-3.6) 1.8 (1.2-3.8) 1.5 (1.3-3.3) 0.517* IL-6 (pg/mL) 0.82 (0.6-1.2) 0.67 (0.6-0.8) 0.78 (0.6-1.1) 0.68 (0.4-0.9) 0.62 (0.5-0.8) 0.121* TNF-α (pg/mL) 4.6 (2.6-6.1) 4.3 (3.6-6.3) 4.1 (2.9-9.3) 4.6 (2.9-5.6) 4.1 (3.0-5.2) 0.626*
Table 2.1: Data expressed as mean±SD. P values refer to analyses of variance for repeated measures. Triglycerides, hsCRP, IL-6 and TNF-α are expressed as median and interquartile range (25th and 75th quartile). The asterisk on P values refers to analyses of variance for repeated measures after log-transformation of the dependent variable
study although all inflammatory markers, and particularly IL-6, tended to decrease over time.
2.3.2
Variation in Coagulation Factors Levels
In order to evaluate the effects on hemostatic components, we determined the antigen levels of clotting factors mainly synthesized in the liver (FVII, FVIII and fibrinogen) or in other tissues (vWF and TF) 2.3. FVII levels showed an appreciable variation (P=0.003) and the lowest value was observed at T63 (15.2% lower than T0; P<0.05), in the presence of both alcohol and anti-inflammatory components. However, the decrease was already present at T42 after alcohol introduction (9.5% lower comparing T42 vs T0; P<0.01). The variation pattern did not differ upon exclusion of subjects heterozygous for the -402 A and -323 10 bp insertion FVII alleles, known to be associated with increased and decreased FVII levels, respectively [20] [22] .
val-ues, a well-known determinant of circulating FVII levels [23]. However, the FVII level variation was influenced neither by parallel variations in plasma triglyceride nor by fat mass modification, as indicated by multiple linear regression analysis (ANCOVA adjusted for triglycerides and fat mass).
FVIII antigen levels significantly decreased during dietary treatment (P=0.005). The re-duction was borderline significant at T21, when all subjects had the same isoenergetic non anti-inflammatory diet, was maximal at T63 (15.1% compared to T0, P<0.05), and persisted even in the last phase when alcohol and anti-inflammatory food intake was in-terrupted.
We found that overall FVIII values were positively correlated with CRP (r=0.24, P=0.034), an important cytokine of the acute phase response, and TNF-α (r=0.24, P=0.043), a pro-inflammatory cytokine associated to obesity [24]. The positive relation between FVIII and TNF-α levels was also detected before the intervention (r=0.55, P=0.033). FVIII level variation was not significant after adjustment for TNF-α values (ANCOVA). Differently adjustment for other inflammation markers, CRP and IL-6, did not produce a similar ef-fect on FVIII pattern. The FVIII variations over time were not influenced by body fat modifications. Adjustment for blood groups [25] did not affect FVIII level variation. Fibrinogen levels, an independent cardiovascular risk factor [26], did not show appreciable variations over the study phases and were similar to those measured in Italian healthy women [27]. Among inflammatory markers, only CRP showed a strong positive relation (r=0.54, P<0.001) with fibrinogen levels at each diet phase.
Although the statistical analysis of TF levels in plasma is complicated by the pronounced inter-individual and intra-individual changes, TF levels appeared to decrease in a stepwise manner during the alcohol and anti-inflammatory food intake. White blood cells count and pro-inflammatory protein (IL-6, CRP, TNF-α) distributions during treatment did not explain the TF level variations.
vWF antigen, a potential marker of endothelial dysfunction or activation, did not show significant variations over time. A positive relation between FVIII and vWF levels was clearly detectable, with the highest values at the beginning of the study ( r=0.58, P=0.018)
and in the presence of both alcohol and anti-inflammatory components (r=0.68, P=0.004). The variation of the ratio between FVIII and vWF levels showed a pattern similar to that of FVIII levels (data not shown).
2.3.3
Functional Variations of the Hemostatic System
We measured thrombin generation in plasma samples using low concentration of TF sup-plied with a non-limiting concentration of phospholipids, as a sensitive way to monitor the interplay of procoagulant and anticoagulant components.
The lag time and time to peak (ttPeak) were significantly modified during diet treatment 2.4. We observed markedly prolonged times, and particularly the median lag time increased from 6.3 (T0) to 8.5 minutes (T42). Adding of anti-inflammatory components (T63) did not further prolong these times, which overlapped at the beginning and end of the study. The endogenous thrombin potential (ETP) and peak parameters did not show appreciable variation during the study and were clearly correlated with FVIII antigen levels (ETP vs FVIII r=0.48, P<0.001; Peak vs FVIII r=0.49, P<0.001), as previously observed [28]. The reference plasma showed ETP and peak values (1285.2±197.4 nmol/L and 159.1±42.4 nmol respectively) similar to those observed in the study population. The modification of body composition did not influence any thrombin generation parameters considered. In order to further evaluate the relationship between the thrombin generation rate and the dietary treatments, the slope of thrombin generation curves was calculated. As indi-cated by multivariate regression analysis, this parameter was determined by FVII (β=0.39, P=0.01) and FVIII (β= 0.35, P<0.01) levels but did not show appreciable variation over time (data not shown).
2.4
Discussion
Although several studies have been conducted on the effects of whole-diet therapies on car-diovascular risk factors [29] [30], none experimental study investigated the effect on a wide
Figure 2.3: Over study variation of hemostatic factors levels. The black line inside the boxes represents the median value and distribution outliers are indicated with blank circles (o). The asterisks indicate significant variation (P<0.01) respect to T0 after Bonferronis
panel of haemostatic parameters, and their relationship with metabolic and inflammatory markers. The present study reports original observations about the beneficial effects of an integrated healthy diet in a selected middle-aged women population, characterized by high CRP levels and at least one additional risk factor for cardiovascular disease.
Biologically and clinically relevant modifications of body composition, lipids, coagulation factor levels, and thrombin generation parameters were observed. The reduction in an-thropometric and lipid parameters, and particularly BMI, waist circumference, total and
Figure 2.4: Over study variation of thrombin generation parameters. The black line in-side the boxes represents the median value and distribution outliers are indicated with blank circles (o). The asterisks indicate significant variation (P<0.01) respect to T0 after Bonferronis adjustment for multiple comparisons.
LDL cholesterol levels, would translate into a remarkable decrease in risk for CVD. The antigenic determination of the hemostatic factors, increased levels of which are rec-ognized or candidate risk factors for CVD, favoured the quantitative evaluation of diet-induced biosynthetic changes, and avoided potential drawbacks of clotting assays.
FVII and FVIII levels were remarkably reduced, whereas fibrinogen concentration did not show appreciable changes throughout the study. These observations indicate differential effects of diet on blood coagulation factors mainly produced by the liver, a key organ involved in the metabolic changes observed. Further differences were observed between the stepwise decrease of FVII and FVIII levels, which for FVIII was not counteracted by removing alcohol and anti-inflammatory components, and persisted at the end of the study. vWF levels were strongly correlated with those of FVIII, but poorly modified by dietary treatments. This observation, and the similar pattern observed for FVIII levels and FVIII/vWF ratio, further support a role of diet on modification of FVIII expression. Diet-responsive anthropometric and metabolic parameters were found associated with co-agulation factor levels but did not appreciably influence any hemostatic factor variations, pointing toward still undiscovered regulation of coagulation factor expression by interven-tion.
We observed a clear association between coagulation factor levels and the inflammatory profile. Levels of TNF-α, a cytokine over-produced by adipocytes and macrophages of adi-pose tissue in the obese state [31], were correlated with those of FVIII and affected their variation over time, which points toward a previously unknown relationship. As compari-son CRP, produced by hepatocytes, was strongly related both to fibrinogen [32] and FVIII but did not affect the FVIII variation over time. These observations suggest the presence of inflammation-driven crosstalk between hepatic and extra-hepatic sites for specific reg-ulation of coagreg-ulation factor genes. The functional effects of the dietary treatments were clearly demonstrated by a comprehensive functional evaluation of the coagulation pathway in plasma, integrating changes in hemostatic components and potentially of clinical value to monitor the degree of blood hypercoagulability. We observed significantly prolonged initiation and propagation phases of thrombin generation, which exploit the enzymatic
and cofactor activity of FVII and FVIII respectively. In spite of the reduction of FVII and FVIII levels over time and of the estimated influence of these factors on thrombin generation rate, we did not observe significant relations between the variations thrombin generation times and of FVII and FVIII levels. The exceeding numbers of components, potentially modified by the intervention and integrated in the thrombin generation assay, could mask these relations. Some limitations have to be taken into account when interpret-ing our findinterpret-ings. The sample size, limited by restrictive inclusion criteria and particularly by alcohol assumption and the need of persistently increased CRP levels, precludes find-ing of small effects of the intervention (i.e IL-6 and TF levels). On the other hand, the changes observed even in a small sample are likely to be biologically and clinically sig-nificant. Finally, the study design, without a formal control group, might be prone to outcomes modification due to secular changes even in the absence of a true intervention effect. However, the finding of specific and biologically plausible relationships does not suggest the presence of this type of bias.
In conclusion, the integrated healthy diet produced a differential effect on coagulation factors, and composite effect on metabolic and coagulation parameters. The observed vari-ations suggest novel relvari-ationships between coagulation and inflammatory components. The intervention, a feasible approach, sensibly reduced risk factors for cardiovascular disease in middle-aged pre menopausal women, an ideal target for non-pharmacologic primary pre-vention.
Bibliography
[1] Vanschoonbeek K, et al. Variablehypocoagulant effect of fish oil intake in humans: modulation of fibrinogen level and thrombin generation. Arterioscler Thromb VascBiol 2004; 24: 1734-40.
[2] Mukamal KJ, et al. Alcohol consumption and hemostatic factors: analysis of the Framingham Offspring cohort. Circulation 2001; 104: 1367-73.
[3] Hu FB and Willett WC. Optimal diets for prevention of coronary heart disease. JAMA 2002; 288: 2569-78.
[4] Expert Panel on Detection, Evaluation, and Treatment of High Blood Cholesterol in Adults. Executive Summary of the Third Report of the National Cholesterol Edu-cation Program (NCEP) Expert Panel on Detection, Evaluation, and Treatment of High Blood Cholesterol in Adults (Adult Treatment Panel III). JAMA. 2001; 285:2486-97.
[5] Fibrinogen Studies Collaboration. Plasma fibrinogen level and the risk of major cardio-vascular diseases and noncardio-vascular mortality: an individual participant meta-analysis. JAMA 2005; 294: 1799-809.
[6] Kamphuisen PW,et al. Elevated factor VIII levels and the risk of thrombosis. Arte-rioscler Thromb Vasc Biol 2001; 2: 731-8.
[7] Girelli D, et al. Polymorphisms in the factor VII gene and the risk of myocardial infarction in patients with coronary artery disease. N Engl J Med 2000; 343: 774-80.
[8] Morange PE, et al. Atherogene Investigators. Prognostic value of plasma tissue factor and tissue factor pathway inhibitor for cardiovascular death in patients with coronary artery disease: the AtheroGene study. J Thromb Haemost 2007; 5: 475-82.
[9] Spiel AO, et al. vonWillebrand factor in cardiovascular disease: focus on acute coronary syndromes. Circulation 2008; 117: 1449-59.
[10] Eikelboom JW and Hirsh J. Combined antiplatelet and anticoagulant therapy: clinical benefits and risks. J Thromb Haemost 2007; 5(Suppl.1): 255-63.
[11] Kaul S and Shah PK. Low molecular weight heparin in acute coronary syndrome: evidence for superior or equivalent efficacy compared with unfractionated heparin? J Am Coll Cardiol 2000; 35: 1699-712.
[12] Gerber Y, et al. Secular trends in deaths from cardiovascular diseases: a 25-year community study. Circulation 2006; 113: 2285-92.
[13] Bermudez EA, Rifai N, Buring J, Manson JE, Ridker PM. Interrelationships among circulating interleukin-6, C-reactive protein, and traditional cardiovascular risk factors
in women. Arterioscler Thromb Vasc Biol 2002; 22: 1668.
[14] Zhang C, et al. Abdominal obesity and the risk of all-cause, cardiovascular, and cancer mortality: sixteen years of follow-up in US women. Circulation 2008; 117: 1658-67.
[15] American Diabetes Association. Diagnosis and classification of diabetes mellitus. Diabetes Care 2008; 31(Suppl. 1): S55-60.
[16] AACE Menopause Guidelines Revision Task Force. American Association of Clinical Endocrinologists medical guidelines for clinical practice for the diagnosis and treatment of menopause. Endocr Pract 2006; 12: 315-37.
[17] Ingelsson E, et al. Multimarker approach to evaluate the incidence of the metabolic syndrome and longitudinal changes in metabolic risk factors: the Framingham Offspring Study. Circulation 2007; 116: 984-92.
[18] Federici AB, et al. . A sensitive ristocetin co-factor activity assay with recombinant glycoprotein Ibalpha for the diagnosis of patients with low von Willebrand factor levels. Haematologica 2004; 89: 77-85.
[19] Marchetti G, et al. VitaminK-induced modification in coagulation phenotype in VKORC1 homozygous deficiency. J Thromb Haemost 2008; 6: 797-803.
[20] Morange PE, et al. Biological and genetic factors influencing plasma factor VIII levels in a healthy family population: results from the Stanislas cohort. Br J Haematol
2005; 128: 91-9.
[21] Bernardi F, et al. Factor VII gene polymorphisms contribute about one third of the factor VII level variation in plasma. Arterioscler Thromb Vasc Biol 1996; 16: 72-6.
[22] Deibert P, et al. Effect of a weight loss intervention on anthropometric measures and metabolic risk factors in pre- versus postmenopausal women. Nutr J 2007; 6: 31.
[23] Silveira A, et al. In vivo demonstration in humans that large postprandial triglyceride-rich lipoproteins activate coagulation factor VII through the intrinsiccoagulation pathway. Arterioscler Thromb Vasc Biol 1996; 16: 1333-9.
[24] Eriksson-Berg M, et al. Influence of factor VII gene polymorphisms and environmental factors on plasma coagulation factor VII concentrations in middle-aged women with and without manifest coronary heart disease. Thromb Haemost 2005; 93: 351-8.
[25] Kern PA, et al. Adipose tissue tumor necrosis factor and interleukin-6 expression in human obesity and insulin resistance. Am J Physiol Endocrinol Metab 2001;280: E745-51.
[26] Souto JC, et al. Functional effects of the ABO locus polymorphism on plasma levels of von Willebrand factor, factor VIII, and activated partial thromboplastintime. Arterioscler Thromb Vasc Biol 2000; 20: 2024-8.
[27] Morange PE, et al. Haemostatic Factors and the Risk of Cardiovascular Death in Patients With Coronary Artery Disease:The AtheroGene Study. Arterioscler
Thromb-Vasc Biol 2006; 26: 2793-9.
[28] Marchetti G, et al. Asymptomatic carriership of factor V Leiden and genotypes of the fibrinogen gene cluster. Br J Haematol 2003; 121: 632-8.
[29] Hemker HC, et al. The thrombogram: monitoring thrombin generation in platelet rich plasma. Thromb Haemost 2000; 83: 589-91.
[30] Zarraga IG and Schwarz ER. Impact of dietary patterns and interventionson cardio-vascular health. Circulation 2006; 114: 961-73.
[31] Giugliano D and Esposito K. Mediterranean diet and metabolic diseases.Curr Opin Lipidol 2008; 19: 63-8.
[32] Hotamisligil GS, et al. Adipose expression of tumor necrosis factor-alpha: direct role in obesity-linked insulin resistance.Science 1993; 259: 87-91.
Chapter 3
The effects of physical training on the coagulation
and inflammatory factors levels in uremic patients: a
pilot study
3.1
Introduction
End-stage renal disease (ESRD) is a term that broadly defines an irreversible decline in kidney function resulting in fatal outcome in the absence of hemodialysis (HD) or trans-plantation. The deterioration in renal function develops in parallel with a clinical syndrome (uremia) characterized by fluid electrolyte and hormonal imbalances as well as metabolic abnormalities [1].
Endothelial dysfunction and hemostatic alterations have been described in ESRD patients on maintenance HD. In fact morbidity and mortality from atherosclerotic cardiovascular disease (CVD) is greatly increased in patients with ESRD undergoing continuous HD treat-ment [4]. Major causes for this excess risk include higher prevalence of several traditional and uremia-related risk factors for atherogenesis such as hypertension, hyperlipidaemia, diabetes mellitus, anaemia, increased oxidative stress and thrombotic complications [10]. The annual mortality rate due to CVD in these patients is about 9%, thus 10 to 20 times higher than that of the general population [5].
Physical function is often seriously impaired in patients with ESRD and particularly in those on HD maintenance in which exercise capacity has been reported to average only about 50% compared to normal [2].
Increased physical activity and fitness are associated with a reductions in the risk of CVD in different populations.Despite a significant progress in technological aspects of renal re-placement therapy and medical advances, ESRD patients remain physically limited, with a negative impact on overall health and quality of life [3] . Life expectancy in hemodialysis patients is reduced fourfold on average versus healthy age-matched individuals [8].
Albeit different studies have shown the positive effects of exercise on different morbid con-ditions [8], few dialysis clinics or nephrologists provide encouragement or programs as a part of their routine care of patients.
Exercise training in HD patients have been shown to improve cardiovascular risk pro-file as reflected by an improvement in endothelial function [9]. Besides a reduction in the atheroprotective effect of the endothelium in ESRD patients that accounts for an increased
mortality and morbidity from CVD, it is conceivable that enhanced thrombogenesis alike plays a pivotal role in such complications.
We wanted to study whether potential relationship exists between coagulation markers and physical training.
3.2
Material and Methods
3.2.1
Patients
Thirty one ESRD patients who have undergone HD three times a week for at least one year were recruited. All enrolled patients had been treated with erythropoietin and statins for at least one year. Active smokers and patients with acute illnesses or infections, recent surgery or vascular intervention, recent myocardial infarction or unstable angina were ex-cluded from study. Informed consent was obtained from each subject prior to screening.
3.2.2
Study protocol
This non randomized intervention took in consideration 6 month of dialysis, whose phases are briefly summarized in Fig. 3.1. After reading the study protocol 17 patients gave con-sent to participate in the rehabilitation program study (exercise [E] group). The remaining patients (n=14) declined but agreed to undergo the clinical investigations at the baseline and at 6 months (control [C] group). Patients in group E performed a treadmill exercise based on level walking at 1.5 km/h and with speed increments (0.1 km/h every 10 m) up to the maximum treadmill speed sustainable (i.e. within the limits imposed by claudication or fatigue). Two daily indoor/outdoor walking sessions (10 min each, at 50% of the pa-tients maximum treadmill speed) were prescribed and performed at home. A metronome was used to convert walking speed into cadence (steps/min). Patients were asked to keep a daily record of exercise and symptoms for the duration of the study. Medical controls were performed monthly for the E group, in that occasion the maximum treadmill speed
was evaluated from the patient-supplied records. The intensity of the exercise program was updated at each visit according to the changes in exercise performance so to maintain training intensity corresponding to 50% of the maximum treadmill speed. The duration of each session remained constant throughout the study period.
No exercise was prescribed for group C.
Laboratory and functional parameters were reassessed after 6 months. Members of each working group of investigators were blinded to the results of the other investigators. The Human Research Ethics Committee of the Azienda Ospedaliero-Universitaria of Ferrara approved the study protocol.
Figure 3.1: Flow chart of the study.
3.2.3
Assessment of physical capacity
Two tests validated for patients with functional limitations and a questionnaire for quality-of-life assessment were used to measure patients performance. Testing was performed in
the morning on a non-dialysis day in a temperature-controlled environment. One hour of rest between tests was fixed.
6-minute walking test
Patients were instructed to walk back and forth along a 22 m corridor alone at their own pace, without encouragement, with the aim of covering as much ground as possible in six minutes. Patients were allowed to rest in case of fatigue or pain and to continue when possible. At the conclusion the 6 minute walking distance (6 MWD) was determined.
Incremental treadmill test
The test, based on level walking, was preceded by a one-minute warm-up at a speed of 1.5 km/h. The test began at treadmill speed 1.5 km/h and it was progressively increased by 0.1 km/h every 10 meters. The test ended when the patient was unable to maintain the speed imposed for any reason (fatigue, dyspnea, claudication) thus reaching the maximal treadmill speed.
3.2.4
Laboratory examinations
Blood samples were collected pre-dialysis after overnight fasting. Plasma samples were obtained by centrifugation and stored at −80◦C until tested.
Blood chemistry panel included hemoglobin concentration, high-sensitivity C-reactive pro-tein (hsCRP), total cholesterol (TC), high density lipopropro-tein cholesterol (HDL-C) and triglycerides (TG) levels.
3.2.5
Plasma coagulation factors
Antigen levels of TF, FVII and FVIII were determined by commercial ELISA (TF Ameri-can Diagnostica, Greenwich, CT; FVII and FVIII Affinity Biologicals Inc., Ancaster, CA).
The intra-assay coefficients of variation for TF, FVII and FVIII assays were 12.8%, 7% and 8.7% respectively, while the inter-assay coefficient were 14.7%, 7.3% and 7.4% respectively. In order to evaluate vWF antigen levels we used the protocol previously described [7]. The intra-assay and inter-assay coefficients of variation for vWF ELISA assay were 6.5% and 15% respectively. Antigen levels of FVII, FVIII and vWF were expressed as percentage of healthy plasma pool.
Fibrinogen levels were measured by a prothrombin time derived method with a turbidime-ter kit (Diagen, Thame, UK).
3.2.6
Thrombin generation measurement
Platelet poor plasma (PPP) samples were centrifuged at 23000 g at 4◦C for 1 hour before testing. Coagulation was triggered in calcified PPP by addition of 1 pM recombinant human TF and 4 µM phospholipids (PC:PS 80:20) at 37C. All experiments were carried out in duplicate. Assay variability was lower than 3%.
3.3
Results
Twenty patients (13 from E group, 7 from C group) completed the study Fig. 3.1. Their baseline clinical characteristics are presented in Table 3.1.
The values of serum urea and serum creatinine are comparable to those of ESRD patients on HD. No significant differences were observed in blood values at the beginning of the study (Tab.3.1), and during the 6 months of investigation (data not shown).
The two groups did not differ significantly for the hemoglobin content and for dialysis duration. A slight but not statistical difference in age in the control group was observed. The characteristic of patients before and after the intervention, are summarized in Tab. 3.2 and Tab. 3.3. No change in BMI neither in lipid profile were observed in both groups during the training period. The small increase in HDL-C levels in the control group was not considered clinically relevant since all patients were under statin treatment.
3.3.1
Modification of physical performance during the
interven-tion
For an objective evaluation of functional exercise capacity we chose the 6 minute walking distance (6MWD) test [12]. This test measures the distance that a patient can quickly walk on a flat hard surface in 6 minutes. It evaluates the global and integrated responses of all systems involved in exercise particularly the pulmonary and cardiovascular system and muscle metabolism.
At the beginning of the exercise program, subjects walked an average of 297± 102.4 me-ters, which increased significantly (p < 0.0001) to 334.8± 107.9 meters at the end of the 6 months periods. This translated into an approximate 14% individual improvement in functional performance at the end of the study, corresponding to a variation from 56% to 64% of the predicted 6MWD for healthy adults [6]. Moreover, the exercise group reported the execution of a different training duration (59±37 hours) and volume (251.136±167403 total steps) at the end of the study.
No difference in 6MWD test was observed in overall control group.
3.3.2
Modification of the coagulation proteome
In the exercise group we observed a significant decrease in FVIII antigen levels (p< 0.05) that is neither correlated to any performance parameters considered nor to inflammatory and anthropometric parameters. No variations were observed for vWF, a marker of en-dothelial disfunction, although the reported levels were higher compared to those of a healthy population used as control (data not shown). As an indication of the specificity of the observed variations in FVIII levels, a highly significant correlation between FVIII and vWF levels before (r=0.707, p<0.01) and after (r=0.718, p<0.009) the treatment was observed.
Although as a trend, FVII and FX antigen levels decreased during time too. Variations in different coagulation factor levels were also observed in the control group during the period of the study. In particular, we observed a significant decrease in FVIII levels (p< 0.007), parallel to FVII (p<0.012) and Tissue Factor (p<0.024). By contrast, the higher fibrinogen levels remains unchanged throughout the study in both groups.
In order to monitor the overall functional of the coagulation system, a recently developed assay that measures the thrombin generation (THG) potential in plasma samples was cho-sen [11]. Since many factors can perturb the hemostatic balance in ESRD, the potential of an individuals plasma to generate thrombin might represents an informative tool in highlighting the effects of exercise.
A typical THG curve is characterized by a lag phase which correlates with the plasma clotting time, a thrombin peak which reflects the propagation and subsequent termination of the coagulation cascade, and the endogenous thrombin potential (ETP), a measure of the total enzymatic work performed by thrombin during its generation.
We observed at the beginning of the study a complete different thrombin generation poten-tial between the two groups. In particular we observed very low levels of ETP and Peak in the exercise group and higher lag time and time to peak. After the exercise period a signif-icant increase in ETP and Peak levels and a decrease in times as a trend are observed. An increase in THG times parameters were also observed in the control group. The thrombin potential between the two groups became comparable after 6 months.
Since data about plasma coagulation inhibitors are not available the interpretation of the variation in thrombin generation parameters observed (i.e. lag time and ETP) it is even more difficult.
3.4
Study limitations and discussion
The purpose of this study was to evaluate in a pilot study the influence of a controlled physical training on a wide range of blood coagulation parameters in a population high risk of CVD. Although only twenty patients had completed the study, the sample size is
Parameter Exercise Control
Subjects 12 7
Age (years) 59.8±11.2 69.9±8.2
Dialysis duration (month) 69.5(47-104) 96(25.5-143) Creatinine (mg/dL) 9.1±2.6 10.3±1.2
Urea (mg/dL) 143.6±36.8 145.4±39.6
Hb (g/dL) 12.5±1.1 12.0±1.3
Table 3.1: Clinical and serum laboratory characteristics of the exercise and the control group studied at the beginning of the study. Data are all expressed as mean±SD with the exception of the dialysis duration express as median and interquartile range.
comparable to the majority of clinical studies that have evaluated the impact of exercise on HD patients. We are aware that ESRD patients are affected by different comorbidity that can act as confounding factors in the evaluation of the above mentioned parameters, which deal together with the small sample size of the study, represents a limitation of this work.
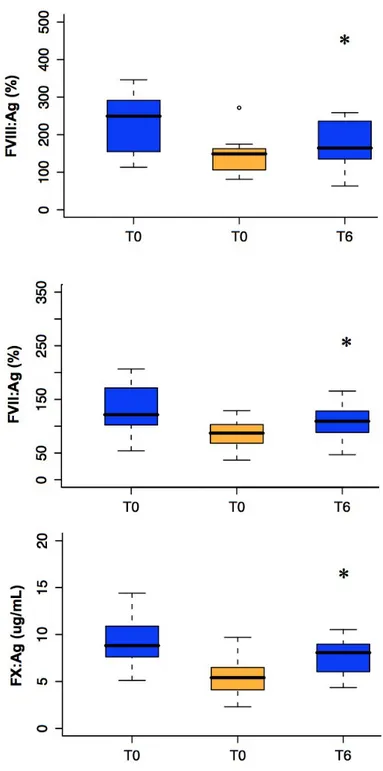
The results suggest the presence of some common factors independent from physical exer-cise in the two groups that modulate the coagulation phenotype. The lack of association between physical exercise and coagulation phenotype observed in our study, cannot exclude that exercise is not able to modulate blood coagulation in the ESRD population per se. Albeit independent from physical exercise, the extremely significant variations in FVIII (p=0.002) and to a lesser extent of FVII (p=0.006) and FX (p=0.036) levels in the whole ESRD population, prompted us to reconsider the study results by collapsing the two groups (group E and C) together Fig. 3.2. In order to have reference values for these variations, we investigated these antigen levels in pre-uremic patients (i.e. patients with uremic symp-toms but not on HD treatment; group P; n=22). It is worth noticing that FVIII antigen levels in group E+C were significantly higher compared to group P at the beginning of the study (p<0.006) and reached levels comparable to those of group P after 6 months.
Parameter T0 T6 P BMI (kg/m2) 25.7±4.0 25.5±3.6 – hsCRP (mg/dL) 1.2 (0.4 - 1.4) 1.1 (0.4 - 1.18) – TC (mg/dL) 168.9±56.1 168.9±51.9 – TG (mg/dL) 175 (122 - 189) 175 (117 - 244) – HDL-C (mg/dL) 46.8±14.9 42.8±15.5 – Fibrinogen (mg/dL) 504.5±94.2 502.3±92.8 – FVIII (%) 244.9±85.2 206.2±46.4 0.05 vWF (%) 229±65.1 232.7±60.8 – Tissue Factor (pM) 5.7±2.1 5.6±1.5 – FVII (%) 129.8±36.4 118.7±28.5 – FX (nM) 8.6±2.4 7.8±2.0 –
Lag Time (min) 12.1±6 10.1±2.2 –
ttPeak (min) 16.5±7 13.8±2.2 – ETP (nmol*min) 766.5±284.2 1135.6±317.9 0.006 Peak (nmol) 101.2±62 171.0±66.2 0.013 6MWD (m) 297±102.4 334.8±107.9 0.001 MT speed (km/h) – 66.9±7.7 – Training duration (h) – 59.0±37 –
Training volume (steps) – 251136±167403 –
Table 3.2: Antropometric, inflammatory, hemostatic and training parameters measure in the exercise group during the study. Data expressed as mean±SD or as median and interquartile range (25th and 75th quartile). P values refer to paired T test.
Parameter T0 T6 P BMI (kg/m2) 26.9±4.0 27.1±8.1 – hsCRP (mg/dL) 0.5 (0.4 - 1.0) 0.9 (0.5 - 1.2) – TC (mg/dL) 189.6±51.1 202.1±45.2 – TG (mg/dL) 283 (155 - 337) 206(149 - 295) – HDL-C (mg/dL) 45.4±13.5 50.6±12.6 0.01 Fibrinogen (mg/dL) 504.5±94.2 502.3±92.8 – FVIII (%) 209.2±63.2 117.3±38.6 0.07 vWF (%) 257.9±76.2 221.0±49.6 – Tissue Factor (pM) 7.4±2.8 6.0±2.4 0.024 FVII (%) 129.8±36.4 118.7±28.5 0.012 FX (nM) 10±3.3 7.4±1.6 –
Lag Time (min) 6.5±1.9 10.1±1.6 0.002
ttPeak (min) 9.8±2.7 13.7±1.9 0.002
ETP (nmol*min) 1423.9±393.3 1137.6±372.3 –
Peak (nmol) 239.4±88.2 173.7±73 –
6MWD (m) 274.7±69.5 271.3±75.8 –
Training duration (h) – – –
Training volume (steps) – – –
Table 3.3: Antropometric, inflammatory, hemostatic and training parameters measure in the control group during the study. Data expressed as mean±SD or as median and interquartile range (25th and 75th quartile). P values refer to paired T test.
Increased levels of FVIII, FVII and FX have been associated with a hyper coagulability, and have been correlated to an enhanced risk for thrombotic events. These observations underlying the potential importance of FVIII, FVII and FX r reduction particularly in the CVD-prone ESRD population.
Even though the study does not provide us with elements useful for interpretation of data, and particularly the highly significant FVIII decrease, the following experimental consid-erations support that our observation is not spurious:
i) Antigen levels indicate differences in protein biosynthesis/half life
ii) All the tests are done at least in duplicate using plasma sample never thaw before iii) Fibrinogen and vWF antigen values, that are known to be affected by pre-analytical variables remain constant overtime
Within all the possible explanations for the observed reductions, we do think that changes in the dialytic procedure are the most likely. Although we did not observe any difference in serum urea and creatinine, crude markers of renal function, we cannot exclude that other factors can act most specifically on clearance of coagulation factors without any difference in these parameters. An extensive evaluation of the dialysis parameters as changes in the dialytic membrane or the associated pharmacological therapies, in team with nephrologist specialists help are still necessary in order to interpret the observed results.
Figure 3.2: Coagulation factors levels variations overtime in a uremic (blue) and pre-uremic (orange) populations. The black line inside the boxes represents the median value
Bibliography
[1] Chikotas N. Uremic syndrome and end-stage renal disease: Physical manifestations and beyond Journal of the American Academy of Nurse Practitioners 2006; 18:195202
[2] Meyer TW and Hostetter TH, Uremia, New Engl J Med 2007, 357;1316-25
[3] Johansen KL, Exercise in the end stage renal disease population J. Am.Soc. Nephrol. 2007; 18:1845-1854
[4] Go AS, et al., Chronic kidney disease and the risks of death, cardiovascular events, and hospitalization. N Engl J Med 2004;351: 12961305.
[5] Foley RN, et al. Clinical ep idemiology of cardiovascular disease in chronic renal disease. Am J Kidney Dis 1998; 32:S112S119.
[6] Enright PL et al., Reference equation for 6MWD in healthy adults Am Journ Respir Crit Care Med 1998;158:1384-87
[7] Federici AB, et al. . A sensitive ristocetin co-factor activity assay with recombinant glycoprotein Ibalpha for the diagnosis of patients with low von Willebrand factor levels. Haematologica 2004; 89: 77-85.
[8] Cheema BS and Singh MA. Exercise training in patients receiving maintenance hemodialysis: a systematic review of clinical trials.Am J Nephrol. 2005; 25:352-64.
[9] Painter P. Physical functioning in end-stage renal disease patients: update 2005 Hemodial Int. 2005; 9:218-35.
[10] Baig SZ, et al. Assessing cardiovascular disease in the dialysis patient. Adv Perit Dial. 2009;25:147-54.
[11] Hemker HC,et al. Thrombin generation, a function test of the haemostatic-thrombotic system. Thromb Haemost. 2006; 96:553-61.
[12] Enright PL,et al. The 6-min walk test: a quick measure of functional status in elderly adults. Chest. 2003;123:387-98.
Chapter 4
The Blood Coagulation Factor V
The coagulation Factor V (FV) was discovered by Paul Owren, the first in describing a case of FV deficency in 1947 [1].
At that time the dominant theory of blood coagulation reaction involved only four factors: fibrinogen, prothrombin (PT), thromboplastin (TF and phospholipids) and calcium. Using a relatively primitive technology, Owren deduced that the bleeding disorder affecting his patient was not explainable by deficiency of any of the four classical factors. Therefore, he postulated the existence of a new factor, called Proacellerin (Factor V), in order to explain the cause of the deficiency. In the following years lots of efforts were put on understanding the role of FV. However, due to the extreme sensitivity of FV to proteolytic enzymes, all the attempts to purify the protein kept failing. In addition, the cloning of the human FV cDNA was reported only in 1987. Therefore, the purification and characterization of both bovine and human FV are recent accomplishments.
4.1
Gene and Biosynthesis
FV is synthesized by hepatocytes, the main responsible cell type for protein secretion in plasma [2].
The coagulation FV is encoded by a gene, approximately 80 kb in size, composed by 25 exons and 24 introns and mapped on the long arm of chromosome 1 (1q23) [3].
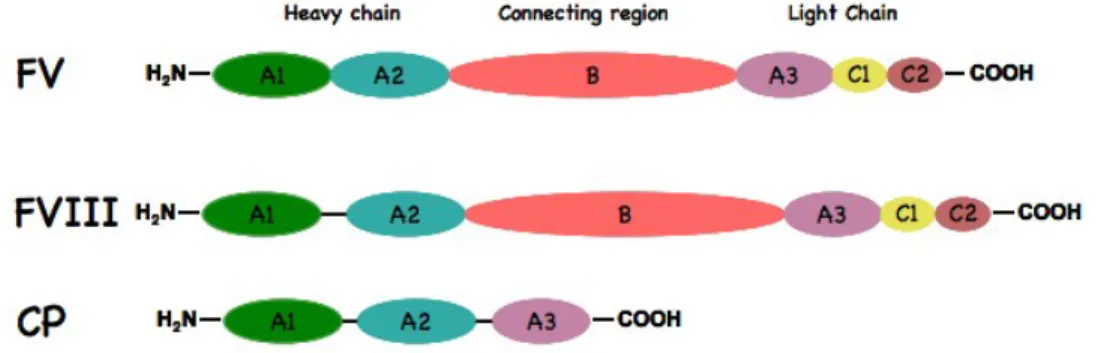
After transcription a mature mRNA (6.8 kb), is encoded in a protein of 2224 amino acids (aa), called pre-procofactor. The pre-procofactor includes a 28 aa signal peptide that is cleaved off after translocation to the endoplasmic reticulum (ER) where it undergoes multi-ple post-translational modifications, Figure 4.1. The bovine, murine FV cDNA and amino acid sequences were found to have similar characteristics [4] [5].
The FV molecule has 37 potential sites for N-linked glycosilation, known to influence FV cofactor function. Different glycosilation of the C2 domain results in the formation of two functionally different forms of FV, called FV1 and FV2 [6]. Both these iso-forms circulates in plasma and in platelets at a 33 : 67 molar ratio [7].
Like different secreted proteins FV undergoes tyrosine sulphation, a post-translational modification shown to influence FV activation by thrombin. Its inhibition results in a FV molecule with one fifth of the activity compare to the native molecule [8].
Correctly folded FV leave the ER for the ER Golgi intermediate compartment (ERGIC). Trafficking of FV (and FVIII) from ER to ERGIC is dependent on a heterodimeric protein consisting of mannose binding lectin 1 (LMAN1) and multiple coagulation factor deficiency 2 (MCFD2) [9]. The heterodimer LMAN1-MCFD2 interacting with B domain, specifically captures correctly folded FV in the ER lumen. This cargo-containing complex is then packaged into COPII-coated vesicles for budding. Deficiency of either LMAN1 or MCFD2 causes combined FV and FVIII deficiency.
In the Golgi apparatus FV is additionally modified by the formation of disulfide bridges. FV has 19 cysteine residues. Five of them present as free SH and the remaining 14 in-volved in disulfide bridges by the formation of several loops. These seven disulfide bridges are conserved in human CP and FVIII as well as in bovine and murine FV. The C1085 has been shown to be involved in the interaction with Multimerin-1, in the platelet α-granules. Once FV leave the Golgi, it is secreted by the cell.
Following secretion, plasma FV is then phosphorylated. In particular, FV is phospho-rylated at the S692 residue by a membrane-associated platelet casein kinase II (CKII) enzyme. This covalent modification increases the rate of inactivation of the FV by acti-vated protein C (APC) [10]. FV is also phosphorylated by an intra-platelet protein kinase


![Figure 4.1: FV gene and post translational modifications occuring inside the cell, figure from [7].](https://thumb-eu.123doks.com/thumbv2/123dokorg/4725846.45863/53.918.227.706.439.686/figure-gene-post-translational-modifications-occuring-inside-figure.webp)