UNIVERSITY OF MESSINA
DOCTORAL SCHOOL
IN SCIENZE ECONOMICHE
C
OORDINATOR OF THE COURSEP
ROF.
EDOARDO
OTRANTO
THE
IMPACT
OF
LEADERSHIP
AND
TEST
ANXIETY
ON
STUDENT
OUTCOME
TUTORS:
CANDIDATE
PROF. MICHELE TRIMARCHI
ALESSIA VARANO
INTRODUCTION
This thesis is presented as a collection of essays on the theme of the students' performances.
This research focuses on the potential factors that could affect the results of the students. In particular, it analyses the impact of the dean and anxiety on the performance of students.
In the first paper, the aim is to see if they were reported in the scientific literature publications relating to the impact of the principal about the student achievement. It starts with a review of the literature on the role of the leader in a general context. Afterwards it analyses specifically the impact of the principal on school performance and student outcomes.
The second paper shows the results of an empirical analysis on the impact of the principal about the student achievement. The analysis is conducted on British data from 1992 to 2006. Specifically, it analyses the indirect impact of the dean on student performance. In fact, before it checks the impact of principal on the teacher and, secondly, is analyse the effects of the teacher on student achievement. Objective of the third paper is to assess the impact of anxiety on student test performance. This study is carried out through an experiment at the University of Catanzaro. In particular, it analyses the impact of music on anxiety and finally the effect of the anxiety on student outcomes.
THE IMPACT OF LEADERSHIP ON STUDENT OUTCOMES:
LITERATURE REVIEW
STRUCTURED ABSTRACT
In literature there are few studies on the impact of leadership on school performance. Most researchers, in fact, focus on other issues such as efficiency of the school, and growth capacity of the school.
This paper aiming at describing the findings of a literature reviews that assessing the interest in the topic, the employed research approaches, methods and results.
The review of literature has been made on the bulk of publications reached on Scopus, the electronic search platform of journals databases. With reference to the period between the years 2006 and 2016 were identified 69 papers with heterogeneous approaches, this result it has been refined with the search of key-words coherent with aim and topic of this paper. At the end the analysis focuses on the contribution given by 22 scientific papers that were examined with regard to methodology approach and driver of research.
This paper through the literature review provides an updated overview of the research regarding the impact of the principal about the student achievement. In particular, it contributes to the debate by providing an overview of the methods and approaches used in research articles and classification scientific contributions on this issue by highlighting two research pilots: concept of leadership and impact of leadership on student outcomes.
This paper should help clarify the conceptual boundaries of leadership and to provide a theoretical framework on relationship between leadership and academic achievement. This could be helpful to public policies in order to understand how to invest about leadership.
INTRODUCTION
The first purpose of this paper is to offer some clarity to the concept of leadership and provide a thoughtful discussion on the prospects for leadership and models that can be identified within the organization of the school.
The second part examines the impact of school leadership on school performance and student achievement.
Leadership is a concept used in many different contexts with a series of meanings.
James MacGregor Burns, a pioneer in leadership studies, introduced the concept of transforming leadership style. Transforming leadership it is based on the leader's impact on the figures, on self-esteem, confidence and the impact of followers motivating to have a performance above and beyond the call of duty. Transforming leadership style is contrasted with transactional leadership style.
Transactional leadership it is based on his ability to inspire and raise the consciousness of followers by appealing to their ideals and highest values.
This line of research is important in identifying what leadership should do to enhance the outcomes of student.
METHODOLOGY
The aim of this work is to describing the findings of a literature review that assessing the interest in the topic, in particular on the concept, on the employed research approaches and methods methodology. For this reason this work is based on a literature review. The main reference for the data collection is Scopus, the largest abstract and citation databases of research literature (Surulinathi, et al., 2009). This database is chosen because is multidisciplinary and is supported by different publishers, giving access by this way to a broad variety of academic journals and publications.
Articles taken into consideration are those published in the last 10 years. In order to capture the current knowledge in the area of leadership.
By the consultation of the database appeared n. 66 papers in all subject area, which contained in title, in abstract, keywords or in text of our search terms.
Graph. 1 – Distribution of papers through time – own elaboration
From the graph above it is possible to understand the distribution of documents over time. The data analysis shows that the interest for scholars has increased over time. Above all, between 2011 and 2012 there was a peak of 13 papers, then dropped dramatically in 2013 with only 5 papers.
Graph. 2 – Document Type – own elaboration
The second graph represents the type of analysed document. This composition it is visible that the main element is scientific article (8%). The second element (6%) is the review; following the book chapter (5%), conference (3%). 0 2 4 6 8 10 12 14 2006 2007 2008 2009 2010 2011 2012 2013 2014 2015 2016 86% 6% 5% 3% Articles Review Book Chapter Conference
In second phase, we have collected the articles deemed relevant to the investigation, and they are analysed in detail the content.
In order to select the paper more coherent with the objective of research, have imposed some parameters. The first parameter imposed was to identify the "Subject Area" reference: it was decided to select the subject area "Economic of education", as the area looks more consistent with the purposes of research. Then, it has been created special database on an Excel worksheet that has allowed selecting and incorporating the various titles of the articles examined, methodology that was used and theories contained in them.
From the analysis of the 66 abstracts, 22 papers were selected, focused on concept of leadership and their impact of student outcomes.
Analysing the selected papers has been possible to highlight the results described in the following section.
DEFINITION OF LEADERSHIP AND LEADERSHIP STYLE
In literature there are various definitions of leadership.
According Northouse (2010) the leadership can be defined as a process whereby an individual influences a group of individuals to achieve a common goal.
Kelloway & Barling (2010) define leadership as a process of social influence emanating from individuals in formal positions of power. They argue that leaders can have a broad mandate of influence within an organization.
Role of leadership is to establish a direction (e.g., the creation of a vision and strategy definition), aligning people with organizational goals (e.g. to communicate the goals and seeking commitment) and motivating and inspiring people to achieve objectives organizational (e.g. subordinates empowering) (Kotter, 1990; cited in Northouse, 2010).
A transformational leadership style requires managers to take an active security role. A transformational leader must show concern for the welfare of employees, responding and acting on their security concerns (Yukl, 2010).
A transactional leadership style requires the leader to define the objectives, to recognize and reward the positive safety behaviours and practices. Training interventions can be an effective way to help managers develop these leadership skills. For example, the formation specific transformational leadership for
security has proven to be an effective approach for improving safety at work (Mullen & Kelloway, 2009).
Most of the studies on leadership styles focuses on the relationship between the style of leadership and the results in terms of safety.
Looking at safety outcomes and transformational leadership there are studies that examined the impact of transformational leadership on safety outcomes (Kelloway et al., 2006; Clarke & Flitcroft, 2008; Conchie & Donald, 2009; McFadden et al., 2009; Mullen & Kelloway, 2009; Innes et al., 2010).
These researches found direct and indirect effect of transformational leadership on safety outcomes. Mullen & Kelloway and Innes et al found a direct effect of transformational leadership on safety outcomes
Innes et al. (2010) examined the impact of supervisor transformational leadership on employee safety performance and further explored whether the effects of transformational leadership were confined to one organisational context or whether they carried over across different contexts.
They conducted a study of 159 people who had two jobs in different organizations. The results showed a positive relationship between transformational leadership and participation in safety. Also, the effects of transformational leadership have emerged only in the event that the transformational leadership in the primary work did not predict safety performance (for example, respect for security and participation) in the secondary job.
Mullen and Kelloway (2009) conducted an experiment to eventually analyse the impact of transformational leadership training interventions on safety results on both the leader that employee. Their sample included 54 nurse managers and 115 employees across 21 Canadian health organizations. Managers were randomly assigned to the group subjected to the treatment (training interventions) and the control group (no training).
The results were analysed in two periods: one week before the training and three months later the same. The results showed that those who took part in the formation of transformational leadership has had the best safety attitudes and higher levels of self-efficacy in promoting security compared to the control group.
Kelloway et al. (2006) and McFadden et al. (2009) found an indirect effect on transformational leadership on safety outcomes.
McFadden et al. (2009) examined the impact of the transformation leadership style hospital CEO of initiatives for patient safety and outcomes at 212 hospitals.
For each hospital, were made evaluations on the transformational leadership style in terms of patient safety culture, initiatives for patient safety and patient safety outcomes.
The results indicate that the leadership style transformational CEO has had an indirect impact on patient safety results through a positive culture of patient safety.
The authors argued that a style of transformational leadership triggers a chain of events that affect patient safety. From this analysis it is clear that leaders can improve patient safety by creating a culture of safety patient and investing resources to maximize patient safety outcomes.
Kelloway et al. (2006) analysed a sample consisting from 158 employees working in various organizations. They found that active and passive leadership has had distinct effects on security-related results, respectively positive and negative. In particular, the passive leadership has been associated with a decrease in the relevant results for the safety in terms of consciousness of security and safety climate; it was also associated with an increase in events and security-related injuries. On the other hand, transformational leadership had a positive impact on safety consciousness and perception of the climate of security and has been indirectly associated with a decrease in safety-related events and injuries.
Two studies were identified the simultaneous impact of transformational and transactional leadership on safety outcomes (Clarke & Ward, 2006; Lu & Yang, 2010).
Lu & Yang (2010) conducted a study of 336 employees in five major companies. Employees were asked to rate leaders on two aspects of transformational leadership: encourage the participation of workers in security decisions and the extent to which the leaders emphasize the importance of safety. Employees have had to vote, even, on one aspect of transactional leadership: the extent to which the leaders set targets and standards for security. The authors found that when executives were perceived as being motivated and interested in safety, employees were more likely to comply with the rules and procedures of compliance.
Clarke and Ward (2006) conducted a cross-sectional study to examine the impact of leader behaviours associated with transformational and transactional leadership styles, the levels of participation of workers' safety. The authors conducted a survey of 105 workers in glass-manufacturing organization in the UK. The employees reported on the climate of security in your organization, tactics chief influence and the extent to which they participate in safety activities. Results showed that the leaders are more
influential when: stress the importance of a given task and arouse the enthusiasm, involving workers in decision-making and, finally, when they communicate and justify the reasons for a request.
LEADERSHIP AND SCHOOL PERFORMANCE
Akmaliah et al (2014) conducted a study that analyses the relationship between entrepreneurial leadership practices principals' and innovativeness school through teachers' viewpoints.
For entrepreneurial leadership means a leader capable of facing the challenges and organizational school crisis entrepreneurial leadership. Roomi and Harrison (2011) have recently defined entrepreneurial leadership as “having and communicating the vision to engage teams to identify, develop and take advantage of opportunity in order to gain competitive advantage.
The research was conducted in Malaysia. The sample consists of 294 teachers of six public secondary schools that were randomly selected from 35 public secondary schools in Selangor, Malaysia.. Data were collected through a questionnaire.
Data analysis pointed out that teachers perceive entrepreneurial leadership as very important for school leaders. In addition, this study found a significant and positive correlation between teachers' perceptions of entrepreneurial leadership practices school leaders and the innovative capacity of the school.
Hussain et al (2014), conducted a study in order to identify leadership strategies for school improvement, as perceived by teachers, school leaders and high school mangers.
Using the stratified random sampling technique, the sample is made up of three Deos (District Education Officers), 12 school principals and 24 teachers. In first stage, 36 districts of Punjab were divided in to three geographical and socio-cultural zones. After that one district from each zone was selected randomly from which four secondary schools.
The data was collected through an interview.
The results of this study showed that most of the participants suggested as a strategy for improvement of the school the following methods: distribution of powers and responsibilities of leadership; involvement of staff in the process of decision and in the activities of the school; parental involvement in school activities.
In literature, the relationship between the main leadership and student has been analysed from the various studios (Hallinger & Heck (1998); Leithwood et al (2004); Bosker & Witziers (1995); Brown & Posner (2001); Robinson et al. (2008); Waters et al (2003); Witziers et al. (2003).
In general we can say that the main effects of the dean often are indirect rather than direct.
Hallinger and Heck (1998) in their review of 40 studies published between 1980 and 1995 showed that only a few studies have shown the direct effects of leadership on the students’ academic performance. Similarly, Witziers et al. (2003), in their meta-analysis found only small direct effects of the main leadership of the studies at the elementary level and no direct effect at the secondary level.
Krueger (1994, 1996, 1999) showed that even gender of the principal is a significant variable in determining the effectiveness of a principal. In fact, he has shown that women principal achieve greater results in terms of students outcomes, because they put more effort on educational activities, while men principal tend to devote their time to administrative matters. Even the decision to become a principal is determined for women in the first place by their desire to be an instructional leader, while for men the decision is a financial decision (Newton,Giese, Freeman, Bishop, & Zeitoun, 2003; Young & McLeod, 2001).
Baker (2006) reconstructed the path of transformation of the School of Felix Holt. The school is observed for a period of ten years, from 1994 to 2004 and during these period they had three principals who adopted different management strategies. He conducted his study using interviews at teachers, students and at same leader and archive data.
Baker identified three phases of drastic change of GCSE score, he believes that this is due to the change of leadership. Between 1993 and 1998 the percentage of student with five or more A * -C GCSE score was very low 13%. From 1999 to 2001, the score improved rapidly by growing to 40% . The last years analysed (2002-2004) showed a percentage of 57% percentage of student with five or more A * -C GCSE
In conclusion, Baker observed an increase of enrolment, from 560 to 1109, and the percentage of pupils reaching 5 or more GCSE increased from 13% in 1994to 57% in 2004.
For a long time, the mediators through which the main direction affects student realization have been studied in reference to the leadership models (educational and transformational).
Educational leadership focuses on teaching practices and student learning, while transformational leadership assumes that a school improvement can be achieved through a sense of collective identity as a teaching organization.
A secondary analysis was conducted on previous empirical research into gender differences in school leadership (Krueger 1994, 1996, 1999).
Researchers analysed data by path analysis and they used LISREL programs. This programs considers the models as a system of equation and estimates all the structural coefficients directly. The analysis had to be carried out on aggregated data. However, the nature of the dataset (three levels: organization, teacher and student) did not allow to carry out such an analysis. This could mean that results are biased in some way.
The results showed that the influence of the headmaster is limited. In fact, the variables with the greatest impact were the variables of the school location (70.48) and the number of female teachers (0.45). Other important exogenous variables concerning the number of students from low income (70.34) and the size of the school (70.31).
However, it has been demonstrated a strong relationship (00.20) between the leader and the perception of school organization of teachers. The relationship between leadership and school culture is less strong (0.13).
The study revealed that the principal of the vision has a substantial impact on student achievement as well as the effectiveness and school improvement.
Gu et al (2008) conducted a quantitative study that analyses the impact of school leadership on pupil performance. They examine the changes in the percentage of pupils achieving five or more A*_/C GCSE) over a period of three years.
The study used the analyses of national datasets on pupil-intake characteristics, attainment and value-added outcome measures to identify a potential sample of schools for a survey of leadership practices in improving and effective schools in England. These included national datasets from Fischer Family Trust (FFT), the DCSF and Ofsted.
They found that 839 secondary schools that did not change the principal the percentage of students who reach five or more grades A*_/C at GCSE increased in these schools, in the years of observation, the principal has not changed.
A similar analysis was conducted in primary schools. The analyses examined changes in the percentage of students who reach the level 4 or above in English and also in mathematics.
1909 schools (38% of 5003) had shown significant and sustained improvement in both English and mathematics, which comprises 13% of the total of primary schools in England.
The researchers identified three subgroups of schools. The groups were: low start improving from low to moderate or low too high in attainment and highly effective in value added; moderate start/ improving from moderate to higher moderate or high in attainment and highly effective in value added and high start stable high in attainment and highly effective in value added.
These groups differ in terms of years of principals' total experience and in their current schools, the number of principals in sends in the last 10 years, the field of school and socio-economic context.
The authors showed that schools in the first group, low starting, had made great improvements change in the school culture, climate and addressing teaching and learning and the use of performance data over the last three years. These results are in agree with those reviews of school effectiveness and improvement research (Teddlie and Reynolds, 2000, Wendell, 2000, Harris et al., 2006, Sammons, 2007).
Principals of low-start group were more likely to give priority to strategies to improve teaching and learning and the use of data compared to those in high boot group. This was strongly detected in secondary schools.
Gu et al conclude that the time in which the principals remain in the school is the variable that links leadership and school performance
In this regard, Robinson et al. (2008) analysed 27 studies published between 1978 and 2006 to compare the effects of these models. They found that the transformational leadership has little impact on student learning as opposed to educational leadership.
Other studies suggest, however, the importance of transformational leadership and how this improves the school through: the definition and communication of the learning objectives (Goldring and Pasternak (1994); Supovitz et al (2010) ;. Witziers et al, (2003) ; supervision, coordination and monitoring of Education (Marks & Print (2003); Supovitz et al (2010); the promotion, the cooperation of teachers and for learning and development efforts (Bamburg & Andrews (1991); Robinson et al. (2008).
Baker (2007), in his qualitative study analyse the effect of transformational leadership on student outcomes. Few study suggest that transformational leadership have small and indirect effect on student performance (Bell, Bolam, & Cubillo, 2003; Leithwood & Jantzi, 2000). This study was conducted through interviews with teachers, students and school staff. However, result of this study were not clear. Dumay et al (2013), like other authors, (for example, Leithwood, Louis, Anderson, and Wahlstrom, 2004; Robinson, Lloyd, and Rowe, 2008; Witziers, Bosker, & Krüger, 2003) in their study they seek to further clarify the indirect influence of capital on student learning.
In their study evaluating the effects of leadership on growth in student achievement mathematics for a period of 6 years.
Sample consisted of 1,915 students from 85 elementary schools. In the sample only included students who have never been rejected and who have never changed schools from first to sixth grade. These selection criteria were applied to assess the long term impact of the main leadership on the students who attend the same school environment for a long period.
The results show a latent growth impact of leadership on student achievement growth. In fact, achieving growth of student achievement is mediated by the collaboration of teachers and collective effectiveness. Direct effects of principal and teacher collaboration on the growth of learning in mathematics students over the long term are very small and statistically not significant.
A paper close in spirit to my second paper is Rosenthal (2004) who investigated the direct effects of Ofsted inspections on gcse score. She uses a sample of 2,387 schools and the GCSE score as dependent variable. And found a small negative effect on student performance of Inspections for the year of inspection. She is only using ols, thus she only estimated correlation without taking into account of any endogeneity issue. Whereas in our work we are trying to address this problem.
DISCUSSION AND CONCLUSION
Objective of our literature review is to investigate the results of the current literature regarding the impact of leadership on student achievement.
Before proceeding to the discussion of the research on leadership and student outcomes, we decided to provide an overview of the definition of leadership in general.
We found that leadership means different things in different concepts and that the most adopted styles of leadership are: transformational and transactional leadership. Transformational leadership places emphasis on the emotional aspects and charismatic leader, while Transactional leadership seeks to increase performance through a reward / punishment system.
After this analysis of the leadership in general we have taken actions to identify the effects of leadership on school performance and student outcomes.
It was shown a positive relationship between the perception of teacher of the figure of principal and the innovative capacity of the school. From studies we could summarize some features that the principal
should possess for school improvement: the distribution of powers and responsibilities; involvement of the entire staff in the decision-making process and, finally, parental involvement in school activities. ultimately, we found more indirect effects of leadership on achievement rather than direct.
It was shown that the change of the principal produces negative effects on educational attainment. This can be justified by the different types of leadership that every dean adopts. In fact, those who adopt one educational style than transformational get greater results in terms of student outcomes.
We conclude that the principal has indirect effects on student achievement and that these effects are mediated by teachers.
REFERENCES
Barker, B. (2006). Rethinking leadership and change: a case study in leadership succession and its impact on school transformation. Cambridge Journal of Education, 36(2), 277-293.
Barker, B. (2007). The leadership paradox: Can school leaders transform student outcomes?. School
effectiveness and school improvement, 18(1), 21-43.
Bamburg, J. D., & Andrews, R. L. (1991). School goals, principals, and achievement. School
Effectiveness and School Improvement, 2(3), 175-191.
Bell, L., Bolam, R., & Cubillo, L. (2003). A systematic review of the impact of school headteachers and
principals on student outcomes. London: University of London Institute of Education.
Brown, L. M., & Posner, B. Z. (2001). Exploring the relationship between learning and leadership. Leadership & Organization Development Journal, 22(6), 274-280.
Clarke, S., & Flitcroft, C. (2008). Effects of transformational leadership on perceived safety climate: a longitudinal study. Journal of Occupational Health and Safety, Australia and New Zealand, 24(3), 237. Clarke, S., & Ward, K. (2006). The role of leader influence tactics and safety climate in engaging
employees' safety participation. Risk Analysis, 26(5), 1175-1185.
Conchie, S. M., & Donald, I. J. (2009). The moderating role of safety-specific trust on the relation between safety-specific leadership and safety citizenship behaviors. Journal of Occupational Health
Psychology, 14(2), 137.
Dumay, X., Boonen, T., & Van Damme, J. (2013). Principal leadership long-term indirect effects on learning growth in mathematics. The Elementary School Journal, 114(2), 225-251.
Goldring, E. B., & Pasternack, R. (1994). Principals’ Coordinating Strategies and School Effectiveness 1. School effectiveness and school improvement, 5(3), 239-253.
Hallinger, P., & Heck, R. H. (1998). Exploring the principal's contribution to school effectiveness: 1980‐ 1995∗. School effectiveness and school improvement, 9(2), 157-191.
Gu, Q., Sammons, P., & Mehta, P. (2008). Leadership characteristics and practices in schools with different effectiveness and improvement profiles. School Leadership and Management, 28(1), 43-63. Hussain, A., Salfi, N. A., & Virk, N. (2014). Qualities of a Good Leader: Perceptions of Teachers, Head Teachers and District School Managers. Public Policy and Administration, 2(2), 171-188.
Inness, M., Turner, N., Barling, J., & Stride, C. B. (2010). Transformational leadership and employee safety performance: A within-person, between-jobs design. Journal of Occupational Health
Psychology, 15(3), 279.
Kelloway, E. K., & Barling, J. (2010). Leadership development as an intervention in occupational health psychology. Work & Stress, 24(3), 260-279.
Kelloway, E. K., Mullen, J., & Francis, L. (2006). Divergent effects of transformational and passive leadership on employee safety. Journal of occupational health psychology, 11(1), 76.
Krüger, M. L. (1994). Sekseverschillen in schoolleiderschap. Samsom HD Tjeenk Willink bv.
Krüger, M. L. (1996). Gender issues in school headship: quality versus power?. European Journal of
Education, 31(4), 447-461.
Kriiger, M. (1999). Gender differences in school principal ship: prejudices and facts. Research on
educational management in Europe, 157.
Krüger, M. L., Witziers, B., & Sleegers, P. (2007). The impact of school leadership on school level factors: Validation of a causal model. School Effectiveness and School Improvement, 18(1), 1-20.
Leithwood, K., & Jantzi, D. (2000). Principal and teacher leadership effects: A replication. School
Leithwood, K., Seashore Louis, K., Anderson, S., & Wahlstrom, K. (2004). Review of research: How leadership influences student learning.
Lu, C. S., & Yang, C. S. (2010). Safety leadership and safety behavior in container terminal
operations. Safety science, 48(2), 123-134..
Marks, H. M., & Printy, S. M. (2003). Principal leadership and school performance: An integration of transformational and instructional leadership. Educational administration quarterly, 39(3), 370-397.
McFadden, K. L., Henagan, S. C., & Gowen, C. R. (2009). The patient safety chain: Transformational leadership's effect on patient safety culture, initiatives, and outcomes. Journal of Operations
Management, 27(5), 390-404..
Mullen, J. E., & Kelloway, E. K. (2009). Safety leadership: A longitudinal study of the effects of transformational leadership on safety outcomes. Journal of Occupational and Organizational
Psychology, 82(2), 253-272.
Newton, R. M., Giesen, J., Freeman, J., Bishop, H., & Zeitoun, P. (2003). Assessing the reactions of males and females to attributes of the principalship. Educational Administration Quarterly, 39(4), 504-532.
Northouse, P. G. (2010). Leadership: Theory and practice (5
th
edition). Thousand Oaks, CA: Sage.
Robinson, V. M., Lloyd, C. A., & Rowe, K. J. (2008). The impact of leadership on student outcomes: An analysis of the differential effects of leadership types. Educational administration quarterly.
Roomi, M. A., & Harrison, P. (2011). Entrepreneurial leadership: What is it and how should it be
taught?. International Review of Entrepreneurship..
Rosenthal, L. (2004). Do school inspections improve school quality? Ofsted inspections and school examination results in the UK. Economics of education review, 23(2), 143-151.
Supovitz, J., Sirinides, P., & May, H. (2009). How principals and peers influence teaching and learning. Educational Administration Quarterly.
Surulinathi, M., Amsaveni, N., Maheswaran, K., & Srinivasaraghavan, S. (2009). Scientometric Dimensions of Knowledge Management Research in India: A Study based on Scopus database. Sri
Lankan Journal of Librarianship and Information Management, 2(2).
Waters, T., Marzano, R. J., & McNulty, B. (2003). Balanced Leadership: What 30 Years of Research
Tells Us about the Effect of Leadership on Student Achievement. A Working Paper. Mid-continent
Research for Education and Learning.
Witziers, B., Bosker, R. J., & Krüger, M. L. (2003). Educational leadership and student achievement: The elusive search for an association. Educational administration quarterly, 39(3), 398-425.
Young, M. D., & McLeod, S. (2001). Flukes, opportunities, and planned interventions: Factors affecting women’s decisions to become school administrators. Educational Administration Quarterly, 37(4), 462-502.
Yukl, G. (2010). Leadership in organizations (7th edition). Upper Saddle River, New Jersey: Prentice Hall.
THE EFFECT OF SCHOOL LEADERSHIP ON CHANGE IN SCHOOL
PERFORMANCE
ABSTRACT
This paper investigates the indirect effect of Leadership on school performance The school leadership in the UK is now regulated is through the system of inspections carried out by the Office of Standards in Education (Ofsted), set up in 1992. Using several data sets, we apply cross-sectional and Instrumental
Variable models. We find a positive indirect effect of leadership on students outcomes in year follow
the inspection and in two and three years after the inspection.
INTRODUCTION
The aim of this paper is to analyse the effect of school leadership on the change of school performance. The policies to raise pupil attainment often focus on teacher, resourcing or family background.
There is a wider literature on the effects of school systems on school efficiency, pupil outcomes, growth of school, but there are very little works on the effect of leadership on students outcomes.
The objective of this project is twofold. In the first place, to assess the causal effect of a change in school leadership on the change in the average pupil test scores, school size and school capacity, market share and teacher quality
In the second place, to investigate the effect of changes in school leadership on test score gain by: gender ethnic and socio-economic groups.
We use school level data the provided by the Office for Standards in Education (OFSTED) (Department of education).
Our identification strategy exploits the OFSTED inspection introduced by the Educational Act in 1992. Each inspection evaluates leadership, teacher quality and pupils’ results. We adopt an instrumental variable approach which controls for the endogeneity of teaching scores using leader score obtained after the inspections.
LITERATURE REVIEW
In the literature there are few studies on the impact of leadership on school performance (Brandsma e Knuver, 1989; Brookover et al, 1978;. Doolaard, 1996; Mortimore, Sammons, Ecob, e Stoll, 1988; Stokking & Eberg ,1991; Van de Grift, 1987; Van de Grift & Houtveen, 1991; Wellisch, MacQueen, Carriere, & Duck, 1978).
Most of the researchers, in fact, focus on other issues such as efficiency of the school, and growth capacity of the school.
Hallinger and Heck (1996) in their review have analysed more than 40 studies published on the role of the principal between 1980 and 1995. In 21 original studies we have explored the relationship between educational leadership and student achievement. In nine studies they found no relationship; six studies showed a mixed effect while in the other six studies, they found a positive relationship.
Leithwood et al, (2006) investigate the means by which the principal can influence student learning. They identified a number of variables that could impact indirectly on student learning: school climate, school culture, the academic mission, teacher effectiveness, employee motivation, organizational structure, training of staff , strategic planning and resource allocation, staff participation in decision-making and academic.
Baker (2006) reconstructed the path of transformation of the School of Felix Holt. The school is observed for a period of ten years, from 1994 to 2004 and during these period they had three principals who adopted different management strategies. He conducted his study using interviews at teachers, students and at same leader and archive data.
Baker identified three phases of drastic change of GCSE score, he believes that this is due to the change of leadership. Between 1993 and 1998 the percentage of student with five or more A * -C GCSE score
was very low 13%). From 1999 to 2001, the score improved rapidly by growing to 40% . The last years analysed (2002-2004) showed a percentage of 57% percentage of student with five or more A * -C GCSE
In conclusion, Baker observed an increase of enrolment, from 560 to 1109, and the percentage of pupils reaching 5 or more GCSE increased from 13% in 1994to 57% in 2004.
Gu et al (2008) conducted a quantitative study that analyses the impact of school leadership on pupil performance. They examine the changes in the percentage of pupils achieving five or more A*_/C GCSE) over a period of three years.
They found that 839 secondary schools that did not change the principal the percentage of students who reach five or more grades A*_/C at GCSE increased In these schools, in the years of observation, the principal has not changed.
Gu et al conclude that the time in which the principals remain in the school is the variable that links leadership and school performance.
A paper close in spirit to ours is Rosenthal (2004) who investigated the direct effects of Ofsted inspections on gcse score. She uses a sample of 2,387 schools and the GCSE score as dependent variable. And found a small negative effect on student performance of Inspections for the year of inspection. She is only using ols, thus she only estimated correlation without taking into account of any endogeneity issue. Whereas in our work we are trying to address this problem.
Finally, Krueger (1994, 1996, 1999) showed that even gender of the principal is a significant variable in determining the effectiveness of a principal. In fact, he has shown that women principal achieve greater results in terms of students outcomes, because they put more effort on educational activities, while men principal tend to devote their time to administrative matters. Even the decision to become a principal is determined for women in the first place by their desire to be an instructional leader, while for men the decision is a financial decision (Newton,Giese, Freeman, Bishop, & Zeitoun, 2003; Young & McLeod, 2001).
INSTITUTIONAL FRAMEWORK
Ofsted school Inspection
In England, in 1992, the Government education reform changed the system of inspection in the schools. This reform implemented a process of privatization. Before, the inspectors were employed by government agencies or educational institutions. Now, instead, they are external organs and are accountable only to Parliament through the annual report.
The inspection system has undergone changes that can be summarized in three temporal phases. In first phase (1992-1996) each school was inspected every 4 years for a period of one week and two months' notice. In second phase (1997) the cycle of inspections was extended only once over every six years. In third and last phase duration of inspection was reduced, from one week to 2 days; also notice period was reduced, from 2 month to 2 days.
The schools that receive low score at the inspection can be inspected more frequently.
Before the inspection, schools receive a document explaining the procedure of inspection. These inspections last on average two days and each school is visited by a group of inspectors. Before the visit the inspectors are examined student test and the self-assessment test provided by the school. The inspection program is discussed with the head-teacher. The inspections are focused on the analysis of the SEF (Self Evaluation Form), a self-assessment document compiled by the head teacher or the manager of the school.
During the inspection the inspectors visit the classes, examine the notebooks of the students and talk with them and with the teachers. Moreover, study the results of the school and read documents of the school administration. At the end, the inspectors draw up a document in which they make recommendations to improve the quality of the school.
Each inspector stays in a class for 25-30 minutes. The inspections in each class is short so they can observe the largest number of teachers.
Once awarded the score, inspectors notify their conclusions.to the principal and teachers.
At the end the head of inspection prepare a report to be sent to the school within 15 and the school within 5 days must submit this document to the students families.
General certificate of Secondary Education
The General Certificate of Secondary Education (GCSE) is a test that English students must do at 16 years old. The number and choice of subjects depends on the individual students. There is an exam for each ones. If a student passes it he can access certain jobs and professional courses, but this is not enough examination to enter university.
At the end of the GCSE course lasting two years, students receive a score for each subject choice. The scores, from highest to lowest, are: A *, A, B, C, D, E, F and G. Grade U (unclassified) ..
GCSEs are part of the National Qualifications Framework. A GCSE grade DG is a level 1 qualification, while a GCSE grade A * -C is a qualification level 2 GCSE A * -C (Level 2) are much required for both employers to educational institutions.
DATA
The data for this analysis is obtain from three different datasets:
School performance data: contains the characteristics of the school and the results of exams taken by students in England. There is a different table for each key stage: key stage 1 children up to 7 years; Key stage2 students from 7 to 11 years; Key stage3 students from 11 to 14 years in key stage4 14 to 16 years (pre CGSE)
School Census contains numerous information concerning the characteristics of the students, for example, gender, age, ethnicity, special educational needs (SEN), eligibility for school meals (FSM),. Inspection data from OFSTED: contains information about the scores that were awarded during inspections to individual schools.
These three data sets were merged using the unique school number which identifies each school.
We restricted our analysis to schools available in all three datasets. I kept only school that was present in all datasets.
Through this union it was possible to establish a panel data.
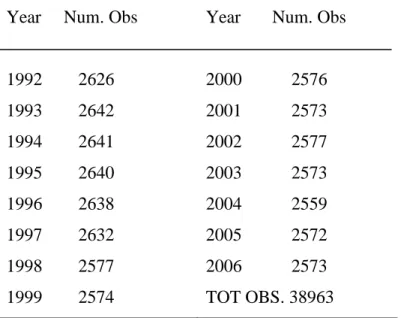
Our initial dataset is a panel for year from 1992 to 2006 with 38963 numbers of observations. The panel is unbalanced because some observations were dropped if the dependent variable was missing. As shown in table 1, for each year the number of schools taken into consideration is different. It is switching from a minimum of 2559 in 2004, to a maximum to 2640 in 1995.
The dependent variable is constructed from national test scores (GCSE) obtained by pupils at Key Stage 4.
The score which may be assigned to teachers ranges from a minimum of 1 to a maximum of 3, while for leadership the Inspector use a seven point scale: 1 (very poor); 2 (poor), 3 (unsatisfactory), 4 (satisfactory), 5 (good), 6 (very good) and 7(excellent).
Table1: Numbers of observation for year
Year Num. Obs Year Num. Obs
1992 2626 1993 2642 1994 2641 1995 2640 1996 2638 1997 2632 1998 2577 1999 2574 2000 2576 2001 2573 2002 2577 2003 2573 2004 2559 2005 2572 2006 2573 TOT OBS. 38963
Table 2 presents summary statistics for the main variables of interest that could influence our dependent variable. Five or more GCSE with A*-C score is obtained by around 47% of students while the average of Ofsted score for teacher is 2.12.
Only Female schools are 7%, only male school are 6%, mixed school are 87%. The class size is 960. Finally, looking at the characteristics of students, the average of pupils eligible for free school meal is 17 %. The mean of students with special education needs is 20 % and the average of pupils that live in metropolitan area are 36.3%. The average of students by ethnicity is as follows: African 3.5 %, Indian 2.7 %, Bangladesh 1%, Pakistan 2.6% and other ethnicity 1.9%.
In the analyses present in this work we constructed a cross sectional dataset, for this We keeping only the students outcomes in the year following of the inspection. Same procedure is followed to assess the impact of leadership two years and three years after inspection The same school if inspected more than once is considered as a different school.
Table2: Summary statistics
ECONOMETRIC APPROACH
Starting from the education production function we will try to estimate the effects of leadership on school performance.
The production function, in general, has as the objective to identify the relationship between the use of a series of inputs and the achievement of a certain outcome.
The application of the production function to the education sector, has taken place following the publication of the Coleman Report Congressional, whose original title is “ The equality of educational opportunity”, which was published in 1966 (Todd & Wolpin, 2003).
Mean S.D GCSE 0.47 0.21 Teaching score 2.12 0.44 Grammar schools 0.55 0.23 Comprehensive schools 0.89 0.31 Male schools 0.60 0.24 Female schools 0.71 0.26 Mixed schools 0.87 0.33 Free School Meals 0.16 0.14 Special Education Needs 0.20 0.16 African 0.35 0.84 Indian 0.27 0.72 Bangladesh 0.10 0.55 Pakistan 0.26 0.81 Chinese 0.04 0.06 Other ethnicity 0.19 0.39 Metropolitan area 0.36 0.48 Size 960 3.27
The education production function is a function that measure school output, like the test scores of students from the school, through school and student characteristics.
𝑌 = 𝑓(𝑋, 𝑆) (1)
In the Education Production Function, inputs are attributable to the various resources that may determine the performance of individuals. The four macro-categories that can be identified are family background, student and school characteristics and student ability.
Innate ability represents the last input of the education production function and also the most difficult to define the measure. Innate ability can be defined as the set of skills and competences that an individual has from birth, are intrinsic to a person and can be hereditary or not.
Controlling for ability is important because unobserved ability is strongly correlated with schooling and bias all the estimate effect.
The output of the production function represent the individual achievement and it is measured using various methods. The methods commonly used to measure the output are Test score, Final Grade, College/University continuation or dropout rates and Employability.
In our analysis it is possible to rewrite the production function as follows
𝐴𝑡 = 𝑓(𝐹𝑡, 𝑃𝑡, 𝑁𝑔, 𝑇𝑡, 𝑆𝑡, 𝐿𝑡, 𝑎 ) (2)
Where, A is a dependent variable and the outcomes of test score (GCSE) at t; F is a % pupil eligible for free school meal (FSM); P are others characteristics of student: gender, special needs (SEN) ethnicity, N is a district, T is teaching quality S are school characteristics: class and school size, type of the school L is leadership quality α refers to innate ability.
For empirical purposes one might assume this function is linear and generate the linear regression:
𝑌 = 𝑋′𝑏 + 𝑆′𝑐 + 𝑒 (3)
where Y is a measure of school outputs like a vector of student test scores, X is a set of measures of student attributes (collectively or individually), S is vector of measures of schools those students attend, b and c are coefficients, and e is a disturbance term.
To assess the impact of leadership on school performance we use standard Ordinary Least Square (OLS) model
𝑦𝑡= 𝑎 + 𝛽𝑡𝑠 + 𝛽𝑡𝑦𝑠 + 𝛽𝑔𝑒𝑛 + 𝛽𝑓𝑠𝑚 + 𝛽𝑠𝑒𝑛 + 𝛽𝑒𝑡𝑛 + 𝛽𝑠𝑖𝑧𝑒 + 𝛽𝑠𝑖𝑧𝑒2+ 𝛽𝑦𝑖𝑛𝑠𝑝 + 𝛽𝑞𝑢𝑎 + 𝜀 (4)
where: y is a proportion of students with 5 or more A*- C GCSE score; ts is a categorical variable and it indicate a teaching score; tys is an admission policy that include two dummy variable: grammar and comprehensive schools; gen is a gender of entry in school that include three dummy variable: only boy school, only girl school and mixed school; fsm is a percentage of student eligible for free school meal (poor); sen is a percentage of student with special education needs; etn is an ethnicity of student; yinsp is a year of inspection; qual is a qualification of teacher and є is an error term.
The problem is that Teaching score is endogenous to Gcse score. The correlation between teaching score and GCSE score might reflect omitted variables.
Teacher quality, in fact, can be influenced by other omitted variables such as for example the satisfaction of their work, the environment in which is located the school where he/she teaches ... In effort to isolate the casual effect of Teaching score, I use an instrumental variable strategy (IV).
With IV It is a necessary to find a variable z that is correlated with endogenous variable, but uncorrelated with the outcome.
The instrumental variable that I use in this model is the score of leadership that is given in the inspection. The leader and other variables of inspection can affect the quality of the teacher but not student performance
Using the score of leadership as instrumental variable can be observed an indirect effect of the principal on student performance.
In the literature there have been studies that have investigated both direct and indirect effects of leadership on student performance. Studies that have focused on the direct effects did not find any significant effect (Bossert, Dwyer, Rowan, & Lee, 1982). while others studies found indirect effects of leadership on school performance (Kleine-Kracht, 1993; Leithwood et al., 2006; Pitner, 1988, Bossert et al., 1982; Bridges, 1967, 1977).
The First stage model takes the form
𝑇𝑆 = 𝑏𝐿 + 𝑏𝑌𝐼𝑁𝑆𝑃 + 𝑏𝑆𝐼𝑍𝐸 + 𝑏𝑆𝐼𝑍𝐸2+ 𝑏𝑄𝑈𝐴𝐿 + 𝜇 (5)
Where L is leadership score and it denote the instrumental variable; and 𝜇 is error term. From this equation we predict a teaching score using only information about leadership and teaching.
In the second stage we regress Gcse score variable on the predicted Teaching score from equation 2 and others covariates:
𝑌𝑡= 𝑎 + 𝛽𝑃𝑇𝑆 + 𝛽𝑡𝑦𝑠 + 𝛽𝑔𝑒𝑛 + 𝛽𝑓𝑠𝑚 + 𝛽𝑠𝑖𝑧𝑒 + 𝛽𝑠𝑖𝑧𝑒2+ 𝛽𝑦𝑖𝑛𝑠𝑝 + 𝛽𝑞𝑢𝑎𝑙 + 𝜀 (6)
To evaluate the persistency of the teaching score effect we estimate the second stage two and three years after first inspection.
Every school in our sample is been inspected only once. All schools for initial inspection are on the same level, because the inspectors do not know the value of school
RESULT
First stage
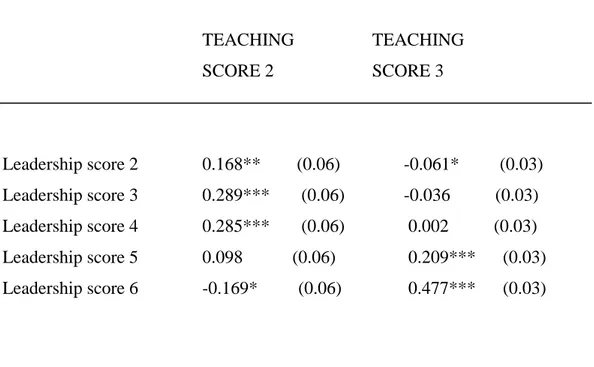
Table 3 shows the results of the first-stage equation. This equation investigates the extent to which the score of leadership affects the teacher score. We use multiple instruments corresponding to each leadership score. The reference category of leadership score (instrumental variable) is leader that have score 1
In the first column of tabl3 we report the effects on teaching score 2 versus 1. while, the estimate for teaching score 3 this is in second column
Looking at dependent variable - teacher score, the reference category is teaching that have score 1 (low). We find that a leadership score 2, 3, 4, 5 the increase the probability for teacher to have score 2 by 0.17, 0.29, 0.29 and 0.1 respectively. Surprisingly, the results shows a negative effect of leadership with score 6 on achieving score 2 for teacher This result may be due to the small number, 185 of 4050, of leaders with score 6.
Similarly, a leadership with score 2 and 3 compared to a reference category reduce respectively by 0.062 and 0.037 percentage points the probability for teacher to have score 3 respect a reference category. Very positive significant effect is found with leadership score 5 and 6 where the probability of teacher to reach score 3 respect a score 1 are 0.21 and 0.48 point percent.
In order to assess the validity of instrumental variable we look at a significance of each leader score When we have more instruments Hansen test identify if the additional instruments are valid, in the sense that they are uncorrelated with error term. Under H0 = E(z u)=0, the over identification test statistic is
about 8.11. The p-value is 0.044, so the over identifying restrictions are rejected at 1%. We are aware that we need to further investigate this issue.
Breusch-Pagan test verifies the homoscedasticity. Under Ho: Disturbance is homoscedastic,
White/Koenker nR2 test statistic is 103.495 Chi-sq(27) P-value = 0.0000. We rejected homoscedasticity
However, correcting for heteroskedasticity the results are the same.
table 3: the effect of leadership on teaching score
TEACHING SCORE 2 TEACHING SCORE 3 Leadership score 2 Leadership score 3 Leadership score 4 Leadership score 5 Leadership score 6 0.168** (0.06) 0.289*** (0.06) 0.285*** (0.06) 0.098 (0.06) -0.169* (0.06) -0.061* (0.03) -0.036 (0.03) 0.002 (0.03) 0.209*** (0.03) 0.477*** (0.03)
Standard errors are in parentheses and are clustered.
Ols and 2tls
In table 4 we report the results of OLS and IV
The effects of the OLS estimate are shown in the first column of table 4. The parameter of interest is teacher score whose Looking at the teacher score, the reference category is teaching that have score 1 (low). These estimate suggest that a teacher with score 2 (medium) increases by 0.07 percentage points the proportion of students with five or more A*-C GCSE score. This corresponds to 15.13 percentage variation. Whereas, a teacher with score 3 (high) generates an increase of 0.167 (35.58%) percentage point on the average A*- C GCSE score. It Is clear, that teaching quality has a strong impact on student outcome.
Table 4 also shows the results of other covariates.
Attending grammar or female increase of proportion of student with five A*-C GCSE score 0.35 (73.73%) and 0.062 (13.21) percentage point respectively.
Table 4:The impact of teaching score on gcse score in the year follow the inspection
OLS IV Teaching score 2 0.071*** (0.009) 0.163*** (0.035) Teaching score 3 0.167*** (0.011) 0.382*** (0.033) Metropolitan area 0.015** (0.005) 0.013* (0.006) Grammar schools 0.346*** (0.013) 0.314*** (0.019) Comprehensive schools 0.088*** (0.009) 0.085*** (0.010) Female schools 0.062*** (0.012) 0.037* (0.015) Mixed schools -0.004 (0.010) 0.002 (0.011) FSM -0.852*** (0.024) -0.776*** (0.027) SEN -1.562*** (0.164) -1.413*** (0.178) African 0.148*** (0.034) 0.164*** (0.035) Indian 0.007 (0.031) 0.163*** (0.035) Bangladesh 0.470*** (0.044) 0.425*** (0.045) Pakistan 0.139*** (0.027) 0.011* (0.032) Chinese 0.911** (0.396) 0.289 (0.440) Other Ethnicity 0.114* (0.056) 0.102 (0.057) Size 0.009** (0.003) 0.008 (0.008) Size2 -0.000* (0.000) - 0.000* (0.000) Teaching ratio -0.005*** (0.001) -0.004 (0.004) Teaching qualification 0.014 (0.000) 0.013*** (0.001) Year=1997 0.011 (0.013) 0.010 (0.014) Year=1998 0.018 (0.013) 0.021 (0.014) Year=1999 -0.020 (0.013) 0.024 (0.014) Year=2000 -0.019 (0.016) -0.006 (0.017) Year=2001 0.040** (0.012) 0.041* (0.014) Year=2002 0.051*** (0.013) 0.058*** (0.014) Year=2003 0.053*** (0.013) 0.054*** (0.014) Year=2004 0.090*** (0.013) 0.103** (0.014) Year=2005
Standard errors are in parentheses
The results of this estimate shows that there are negative effects on the proportion of student with five A*-C GCSE grade in the presence of poor students measured by free school meals and students with special education needs. These students reduce the our outcome of 0.85 and 1.56 percentage point respectively .
Looking at ethnicity, the reference category is white English students. In all ethnic groups we have an increase of proportion of student with five or more A*-C GCSE grade. For example, African induce an increase of 0.15 percentage point; Bangladesh of 0.47 ; Pakistan of 0.14 ; Chinese of 0.91 and other ethnicity of 0.11.
Instrumental variables estimates are reported in the second column of table 4 for. All IV estimates have the same sign as the OLS estimates and are statistically different from zero.
The IV estimates are higher in magnitude than the OLS estimates for all score. This means that IV are estimate a local average treatment effect whereas OLS are estimate average treatment effect.
Concerning the others covariates we do not notice big difference between IV and OLS estimate
Persistency
Table 5:The impact of teaching score on gcse score in the year follow the first inspection and in two and three year after the first inspection
OLS IV
one year after 1st inspection Teaching score 2 0.071*** (0.009) 0.163*** (0.035) Teaching score 3 0.167*** (0.011) 0.382*** (0.033)
two years after 1st inspection
Teaching score 2 0.061*** (0.009) 0.225*** (0.049) Teaching score 3 0.151*** (0.011) 0.414*** (0.046)
three years after 1st inspection
Teaching score 2 0.294*** (0.081) 0.060*** (0.001) Teaching score 3 0.462*** (0.074) 0.152*** (0.012)
We always found a positive effect on the impact of teaching score on proportion of student that have five or more A*-C Gcse grade. The best result is in the three years after the inspection and teaching with score three. In this case we have an increase on proportion of student with five or more A*- C GCSEe of 0.462 percentage point. This correspond to 94.4 percentage variation.
DISCUSSION AND CONCLUSION
In recent years the English school system was improved. The Ofsted, through its inspections contributed to this improvement.
Parents use Ofsted as a guide. The effect inspection of the affects, also, the number of students who enroll in a particular school. In fact, school inspection provides parents and families to relevant information about the schools their children attended. The schools are responsible for the services offered to students. The results of the inspections are relevant for the family to choose schools for their children on an informed basis.
The research reported in this paper has investigated the indirect effects of leadership (score Ofsted school inspections) on the examination performance of secondary schools in England.
We use three different datasets: School performance data, School Census and OFSTED data.
We use an instrumental variable because teaching score is endogenous to Gcse score. Using leadership score (Ofsted Data) as an instrument for teaching score.
We find a positive relationship between leadership score and teaching score, in fact, an increase of leadership score increases the score of the teacher.
Very positive significant effect is found with leadership score 5 and 6 where the probability of teacher to reach score 3 respect a score 1 are 0.21 and 0.48 percentage point.
The IV estimates are higher in magnitude than the OLS estimates for all score.
Teacher with score 2 respect a teacher with score 1 increases by 0.07 percentage points the proportion of students with five or more A*-C GCSE score. This corresponds to 15.13 percentage variation. Whereas, a teacher with score 3 (high) generates an increase of 0.167 (35.58%) percentage point on the average A*- C GCSE score.
We can conclude that teaching score have an positive effect on students outcomes. We did request data until 2015 and we are waiting for a response.-
REFERENCES
Barker, B. (2006). Rethinking leadership and change: a case study in leadership succession and its impact on school transformation. Cambridge Journal of Education, 36(2), 277-293.
Bell, L., Bolam, R., & Cubillo, L. (2003). A systematic review of the impact of school headteachers and principals on student outcomes. London: University of London Institute of Education.
Bossert, S., Dwyer, D., Rowan, B. and Lee, G. (1982) The instructional management role of the principal, Educational Administration Quarterly, 18(3): 34–64. Bridges, E. (1967) Instructional leadership: a concept re-examined, Journal of Educational Administration, 5(2): 136–47.
Brandsma, H.P., & Knuver, J.W.M. (1989). Basisschoolkenmerken als determinanten van het functioneren van leerlingen. [Characteristics of elementary schools as determinants for the functioning of pupils]. Groningen: RION.
Bridges, E. (1977) The nature of leadership, in L. Cunningham, W. Hack and R. Nystrand (eds), Educational Administration: The Developing Decades. Berkeley, CA: McCutchan.
Brookover, W.B., Schweitzer, J.H., Scheider, J.M., Beady,C.H., Flood, P.K., & Doolaard, S. (1996). Onderwijsvernieuwingen krijgen meer kans: Schoolleiders begeleiden beter [Better chances for improvement: Principals become better supervisors]. Basisschoolmanagement, 9(4), 1–5.
Gu, Q., Sammons, P., & Mehta, P. (2008). Leadership characteristics and practices in schools with different effectiveness and improvement profiles. School Leadership and Management, 28(1), 43-63.
Hallinger, P., & Heck, R. (1996). The principal’s role in school effectiveness: An assessment of methodological progress, 1980-1995. In K. Leithwood et al. (Eds.), International handbook of educational leadership and administration (pp. 723–784). New York: Kluwer Academic Publishers.
Kleine-Kracht, P. (1993) Indirect instructional leadership: an administrator’s choice. Educational Administration Quarterly, 18(4): 1–29.
Krüger, M. L. (1994). Sekseverschillen in schoolleiderschap. Samsom HD Tjeenk Willink bv.
Krüger, M. L. (1996). Gender issues in school headship: quality versus power?. European Journal of
Education, 31(4), 447-461.
Kriiger, M. (1999). Gender differences in school principal ship: prejudices and facts. Research on
educational management in Europe, 157.
Leithwood, K., & Jantzi, D. (2000). Principal and teacher leadership effects: A replication. School Leadership and Management, 20(4), 415 – 434.
Leithwood, K., Day, C., Sammons, P., Harris, A. and Hopkins, D. (2006) Seven Strong Claims about Successful School Leadership. Nottingham: National College of School Leadership.
Mortimore, P., Sammons, P., Ecob, R., & Stoll, L. (1988). School matters. Somerset: Open Books.
Newton, R. S., Giese, J., Freeman, J., Bishop, H., & Zeitoun, P. (2003). Assessing the reactions of males and females attributes of the principalship. Educational Administration Quarterly, 39(4), 504 – 532.
Pitner, N. (1988) The study of administrator effects and effectiveness, in N. Boyan (ed.), Handbook of Research on Educational Administration: A Project of the American Educational Research Association. New York: Longman. pp. 99–122
Robinson, V., Lloyd, C. and Rowe, K. (2008) The impact of leadership on student outcomes: an analysis of the differential effects of leadership types, Educational Administration Quarterly, 44(5): 635–74.
Rosenthal, L. (2004). Do school inspections improve school quality? Ofsted inspections and school examination results in the UK. Economics of education review, 23(2), 143-151.
Stokking, K.M., & Eberg, J. (1991). Regionale verschillen in het basisonderwijs [Regional differences in elementary schools]. Utrecht: ISOR.
Van de Grift, W. (1987). De rol van de schoolleider bij onderwijsvernieuwingen. [The role of the principal in educational innovation]. ’s-Gravenhage: VUGA.
Van de Grift, W., & Houtveen, Th. (1991). Principals and educational improvement. School Effectiveness and School Improvement, 2, 26–40.
Wellisch, J.B., MacQueen, A.H., Carriere, R.A., & Duck, G.A. (1978). School management and organization in succesful schools. Sociology of Education, 51, 211-226.
Wisenbaker, J.M. (1978). Elementary school social climate and school achievement.American Educational Research Journal, 15, 301–318.
Young, M. D., & McLeod, S. (2001). Flukes, opportunities, and planned interventions: Factors affecting women’s decisions to become school administrators. Educational Administration Quarterly, 37(4), 462 – 502.
THE EFFECTS OF TEST ANXIETY ON
STUDENT PERFORMANCE IN AN ITALIAN UNIVERSITY.
RESULTS FROM A FIELD EXPERIMENT.
ABSTRACT
This paper investigates the effect of test anxiety on student performance. We carried out a field experiment with a students from an Italian University.
Test anxiety is measured by the variation the mean arterial pressure (MAP), computed twice shortly before sitting the exam. Ols model shows that there is no effect of map on test scores. However, test anxiety might be endogenous.
Therefore we use music as IV in an experimental setting to randomize test anxiety. In practice, we randomly divide students in 2 groups, and we only let one group (treated group) listen to some music, whereas the second group has been kept silent (control group). We record the map before and after the treatment, and we compute its variation, i.e. Map_after - Map_before.
We estimate in the first stage the effect of music on Map variation, and we find a statistically significant reduction. We use the fitted value of map, in the second stage and we estimate its effect on test score. Overall we find a weak effect of test anxiety on test scores, although using some specification which include a rich set of covariates, we may find some small and slightly significant effect.
Further research can more effectively focus upon the relationship between music listening and student / professional performance in order for many diffused (and untested) beliefs to be scientifically verified.
INTRODUCTION
The aim of this study is to understand and empirically verify whether or not student’s test anxiety can affect student’s test performance in an Italian University. Test anxiety is a negative emotional state that can induce cognitive and psychological changes before, during or after an examination period (King et al, 2000).