Proceedings of IMECE 2007 2007 ASME International Mechanical Engineering Congress and Exposition
November 11-15, 2007, Seattle, Washington, USA
IMECE2007-43448
THE EFFECTIVENESS OF THE QUALITY FUNCTION DEPLOYMENT IN MANAGING
MANUFACTURING AND TRANSACTIONAL PROCESSES
Enzo Gentili University of Brescia
Department of Mechanical and Industrial Engineering Via Branze, 38
25123, Brescia (Italy) [email protected]
Francesco Aggogeri University of Brescia
Department of Mechanical and Industrial Engineering Via Branze, 38
25123, Brescia (Italy) [email protected]
Marco Mazzola University of Brescia
Department of Mechanical and Industrial Engineering Via Branze, 38
25123, Brescia (Italy) [email protected]
ABSTRACT
The goal of Quality Engineering is to design quality into every product, service and manufacturing process. In particular a methodology is claimed to be very important for Quality design and management: Quality Function Deployment (QFD). QFD is a structured methodology and mathematical tool used to identify and quantify customer requirements and translate them into key critical parameters of systems and processes.
The aim of the paper is to show how a quality management approach can support the increase of the process capability in a global vision of every business. QFD represents one of the most successful tools used in industrial management. By using actual and real cases, the paper shows the effectiveness of the QFD in improving both the management of a process and its capability. Four examples are presented. They take into account different environments: pharmaceutical, mechanical, healthcare and transportation markets.
The first case study is deployed in a pharmaceutical company to satisfy the new customer requirements for the introduction of a nasal spray product on the Japanese market. The second example is applied to the automotive market for the production of air-cooling devices for deluxe vehicles. Finally, the other two cases show the implementation of the QFD tool in transactional processes, such as Cargo Center activities and healthcare services.
Key words: QFD, VOC analysis, Continuous Improvement
INTRODUCTION TO QFD
The main goal of this paper is to show the effectiveness of the QFD through four industrial cases. Nevertheless a brief introduction to QFD is necessary in order to understand which are the main methodology guidelines.
The high quality standards of the output, the rapidly changing technology and the features of the actual market have imposed on companies the application of innovative methodologies and tools in order to increase customer satisfaction. One of these methods is the Quality Function Deployment (QFD), that links the voice to the customer directly to the internal processes of a company creating and suggesting prioritization for improvement [1]. This technique is a systematic method for motivating a business to focus on its customers. It can be applied by different functional teams in order to resolve problems in providing products, processes or services [2].
“QFD is a customer-driven process for planning products and services. It starts with the voice of the customer, which becomes the basis for setting requirements” [3]. It defines the relationships between “product and process what and how in a matrix form” [4]. The matrix form is called “House of Quality”, see Figure 1.
The QFD concept is based on four phases [5]:
- definition phase: management defines the product or service to be improved. In this step there is the selection
of the team that should share a common vision and mission in order to achieve the project goal;
- identification of the Customer Axis: the team must determine customer requirements using different tools, such as interviews, surveys or complaint sheets. The output of this step is a list of features that are critical to customer. For every feature the team must define a weighting of importance as shown in Figure 1;
- determination of the Technical Axis: by using voice of the customer, capability indexes and product or service parts, the team must identify those technical features that are critical to satisfy the customer targets. They should be shown under the “House of Quality” roof. It is possible to link the different technical features using the roof of the “House of Quality”. This step operates only on the critical parts of processes improving whole system;
- calculation of Critical to Quality features: by adopting the relationship matrix it is possible to calculate the most important CTQs features in order to obtain immediate customer satisfaction. This step is fundamental to create a prioritization to increase the performance level of the system. The relationships are shown at the intersection of the what and how, using different symbols. In this way the team should calculate “how much” for each “how” multiplying every symbol rank with the importance of weightings in each column [6].
Fig. 1:The House of Quality
It is possible to complete the “House of Quality” deploying a comparison with competitors in order to understand the position of the company in the market. An effective application of QFD could provide many benefits such as an improvement of customer satisfaction, shorter lead time, lower startup cost, marketing advantages or fewer startup problems [7]. As shown, the deployment of Quality Function Deployment focuses overall on two fundamental concepts:
- the voice of the customer (VOC); - the voice of the process (VOP).
The integration of VOC into VOP gives an understanding of the performance level of a company and, as a consequence, a first way to improvement (Critical to Quality features – CTQs) [8]. In a global evaluation of a company it is useless to focus on the customer if we don’t know the process that provides the service and in the same way it is restrictive to assess a process without considering the market requirements. Therefore the following sections define why and how to identify VOC, VOP and CTQs.
THE DEFINITION OF THE VOC
The need of QFD implementation should rise from a detailed study of market requirements. In order to obtain correct customer information an efficient marketing structure is necessary inside a company. The identification of the VOC can seem a simple step. Nevertheless it is a very hard and decisive step to reach the goals.
In general the customer knowledge is a complex process. To contact the customers and to understand their level of satisfaction requires a set of marketing tools that will be introduced briefly in this section.
The first step, often neglected, is to identify who is the client. The customer is not only the final user but represents the totality of entities that are down stream of a department or a process that we are analyzing. Therefore a customer can be a person, a company, a function, a process or an activity that can be in different positions of a supply chain. Along these lines it is possible to divide customers into internal and external. A further stratification is the distinction between [9]:
- actual clients, they are the users of the company product/service;
- potential clients, they can provide useful information to increase the business of a company;
- lost clients, they represent a severe loss for the company. However they can be also an opportunity to understand the encountered mistakes and thus they can be a source of improvement.
In order to complete the Customer axis in the “House of Quality” there are a number of tools to collect these typologies of information: there are surveys, (phone, email or direct) interviews, comment cards (they are used to know the quality level of a service) or filed reports providing information collected by sale managers. The importance of these tools has a significant impact on increased customer loyalty.
To understand and to satisfy the customer needs is a critical activity. However it can be very profitable for a company. In order to reach this goal a strong effort on the part of the whole organization is necessary. In particular it is possible only if the top management emphasizes this culture at every level of the company. In fact only a limited part of the organization knows the real customer needs. An important assignment of top management is to create an internal structure that can spread this knowledge into every company level, building a customer centered organization.
There are also other useful tools that help to identify graphically the role of customers or suppliers in a manufacturing/service stream. These tools are SIPOC (supplier – input – process – output – customer) or IPO (input – process – output) [10]. The simple exercise of dividing a flow into its main processes, inputs and outputs can help understand what the “user” is and as a consequence what the requirements are.
WHAT Voice of the Customer
Relationship
matrix Competitive evaluation HOW
Processes and components CORRELATION MATRIX Target values Im p o rt a n c e w e ig h ti n g Competitive evaluation
Every organization needs a clear mapping of its customers. In order to implement an efficient improvement plan it is fundamental to know what are the priority aspects and convenience for the interventions to avoid useless waste. Only when the customer is known it is possible to begin a study of requirement satisfaction. A must of an organization is to be aware that its existence is constrained by the possibility to satisfy (or create) customer needs. To meet the expectations offers a significant opportunity to overtop the competitors gaining market shares.
In order to define VOC the main milestones are:
- to clearly identify the customer, they can be internal or external. This step requires a market analysis and a detailed process mapping (for manufacturing or transactional activities);
- to define the customer needs, this goal can be reached using different tools, for example interviews, surveys or analysis of complaints. The business environment can suggest what are the best techniques to apply. All these methods can be classified into two main classes: proactive methods and reactive methods. Information of the first methods are directly collected by the customer whilst the second techniques are initiatives deployed by organizations to improve their knowledge of market needs;
- to carry out a dynamic analysis of the customer, the current speed of the market imposes a continuous assessment of customer needs. A company should always control the level of customer satisfaction.
- to create an ordinate and rigorous method to collect and
analyze VOC defining specification limits (to perform)
and target values to be reached on time;
- to use information and data, they are useful inputs to plan and define a winning strategy.
The goal of the VOC identification is to define the CTCs (critical to customer) features. They have an immediate impact on customer satisfaction [11]. If an organization discovers its weak points, it can plan the priorities of improvement and, as a consequence, create a significant increase in the level of satisfaction in short time. This aspect has also the function of maintaining customers that are thinking of moving to other companies. Therefore CTC features provide different advantages and they can be only identified by a detailed stratification of VOC. They are indicated with a high priority in the “House of Quality”. The identified CTCs define the improvement actions and focus also on other important aspects of process/product that impact significantly on output/service realization. In order to achieve all these goals it is also necessary to study the “process” through its voice.
THE DETERMINATION OF THE VOP
In a global evaluation of a company it is useless to focus on the customer if we don’t know the process that provides the product/service. In the same way it is restrictive to assess a process without considering the market requirements. Therefore it is important to know and measure all processes of a manufacturing stream. We can define a process as the totality of activities and procedures that are necessary to realize and deliver a product/service, transforming inputs into outputs and providing “value”. In order to correctly assess a process it is indispensable to identify the qualitative features that define its
behavior. In order to understand the voice of the process it is important to define the process into:
- start and end of the process; - time;
- involved activities;
- output (products, services and information);
- input (6M: man, machinery, method, material, measurement, mother nature) [12].
Often we believe to have a good knowledge of the industrial processes. Nevertheless if we try to ask the same question to different people, involved into a common process, we can obtain different answers. This fact is due to the different vision of the industrial activities in each employee. Thus the process mapping has the goal to create clarity between the different involved processes. When we have reliable data and information at the start and the end of a process it will be easier to understand the time, the outputs and inputs. In this context, an effective tool is the IPO (input – process – output).
Successively, the VOP should be defined by: scraps,
variation, speed and value.
Scraps are everything that do not give value to the
customer. It is important to remember that often the scraps are not obvious and they may take a long time to appear, as a consequence of market dynamism.
Variation exists in everything, in nature as in a common
industrial process. We can consider a box of apples. They can vary depending on different qualitative features, for example the weight, the color or the shape. In reality it is not possible to obtain the reproducibility of a phenomenon, not even using more accurate conditions. This is due to different causes as in the industrial environment, the variability of raw materials or the different ability of the operators.
The VOP must consider two other fundamental aspects, connected by a strong constraint: speed and value [13, 14]. By defining a process it is necessary to identify the activities that provide value for the customer. Eliminating no value added activities we can reduce the lead time and therefore we can increase the process speed. Only reliable data and information can identify where, how and when we must intervene in the process to obtain a significant improvement of the performances. Often in the industrial environment many parameters are measured for a long time without assessing if these data are really useful to describe the process behavior. It is important to underline that the customer satisfaction index measures the effectiveness of a company. Nevertheless an effective company could fail because in order to be profitable an organization must also be efficient. The efficiency can be measured by a lot of parameters, for example lead time, scraps, no value added activities or costs.
THE IDENTIFICATION OF THE CTQS
The identification of VOC (Voice of the Customer) and the knowledge of VOP (Voice of the Process) focuses on critical aspects (CTQs) of processes and products that immediately impact on customer satisfaction. In order to deploy an improvement plan the definition of critical to quality features is the first step.
These features enable us to import into the company the voice of the customer and they represent a significant benchmark to verify the progress of an improvement project.
In order to understand the CTQs it is necessary to introduce the concepts of defects, units and opportunities. Defects are all parts of a product or service that do not meet or satisfy the customer expectations. Units are something that we can measure and observe on a process and opportunities are the total number of possibilities to incur into a defect per unit of product. Therefore when we identify a feature for a customer it is possible to connect it to a possible defect and, as a consequence, to a opportunity per unit [15]. Example: in a call center we can define a CTQ as the speed of answer per call. The unit is the call, the opportunities are one per call and the defects can be the waiting time over a specific value. In this way it is possible to deploy a numeric and quantitative translation of CTQs.
By using the QFD technique the determination of CTQs features is easier. In fact the QFD methodology provides a structured and smart roadmap that identifies and quantifies customer requirements and translates them into key critical parameters using a mathematical tool (relationship matrix). When we know CTQs we can define a prioritization to improve the performance level of a system focusing only on those processes that are critical for customer satisfaction. This aspect can provide a competitive advantage.
INTRODUCTION TO CASE STUDIES
The aim of this study is to demonstrate the effectiveness and flexibility of the QFD. In order to achieve this goal four real applications are shown. The first two projects are completed and the results are given while the other two QFD implementations are ongoing. However the first results are already visible.
In every project the analysis of the customer needs and the manufacturing and transactional processes is fundamental. The contribution of an heterogeneous team, that involves all necessary departments, is essential in order to achieve ambitious goals. These projects want to show the applicability and flexibility of QFD in different contexts. In fact the first two cases focuses overall on manufacturing systems while the other two projects take into account transactional and service processes. It is possible to note a common guideline for each case study: an effective customer need analysis defines the best roadmap in order to improve the performance level of a manufacturing or transactional system.
CASE STUDY 1: QFD IN THE PHARMACEUTICAL ENVIRONMENT
The deployment of this project arose from the necessity of a pharmaceutical company to launch a product on a new market: the Japanese market.
This product was already commercialized in other countries. Therefore the real goal was not to increase the system productivity, but to eliminate those process features that the Japanese market considers as defects. The product was a common nasal spray indicated for head care treatment. It was characterized by five main components:
- the actuator, it delivers the grip of the device and enables the spray exit;
- the cup, it covers the glass vial; - the vial, it is closed by a stopper;
- the solution, it is held by a needle (internal to the actuator) when the JNS is used;
- the label: shows the expiry date, bar code and general information of the product;
In order to achieve the project goal and to define prioritization the implementation of QFD was necessary. For this reason an heterogeneous team was involved, consisting of different personnel figures: the project leader, the manager responsible for the Japanese marketing, the manager of marketing relationships, the production manager, the maintenance person and the internal consultant for improvement management. The first input was to identify the CTCs (Critical to Customer features) for the nasal spray and to assess the complaints from the other markets, where the product had already been commercialized. A further assessment was the study of the complaints about similar products, that had been sold on the Japanese market. The integration between the results obtained in this first step and the actual marketing experience suggested the publication of a document containing a more accurate definition of the terminology (TTS Technical Terms of Supply) and the different categories. In this phase the role of the Quality Assurance, Customer Service and Marketing Department was fundamental. The main defect categories (Critical to Customer for the Japanese market) were:
- blister contamination;
- black spots > 500 µm and scraps on device; - device dirt;
- black spots > 500 µm on blister; - label position.
The second step was to map the manufacturing system. In this way it was possible to identify the data already available in the company. The nasal spray value stream was divided into six macro-processes: the solution preparation, the filling, the autoclaving, the automatic inspection, the assembling and the blistering, as shown in Figure 2.
Fig. 2: Nasal spray manufacturing system mapping
For every process the team members, in particular the responsible for the production system, defined the main inputs, outputs and critical parameters. They could provide important
Raw material acceptance Autoclaving Delivery Vial Filling Blistering Scraps Packaging Actuators Cups Operator Solution Vials Stoppers Operator Vials Operator Drum Ass.Mach. Vial WashMach. Operator Vials Temp. Blister Raw material acceptance Assembling Actuators Cups Labels Operator Labeling Labels Operator Photocamera Device Devices Operator Machinery Speed Cycle Time Device Devices Operators Temp. Press Blisters Operators
information during the QFD deployment. Table 1 shows collected data to assess the performance levels of the main processes. The voice of the customer and process data led the QFD deployment. During a meeting the team members discussed and studied the different relationships between customer requirements and system features in order to define the CTQs.
Process yield Total yield Batch Scraps Preparation 0.998 0.998 162 Filling 0.980 0.978 1,617 Autoclaving 1.000 0.978 0 Inspection 0.990 0.968 792 Assembling 0.990 0.959 784 Total 0.959 3,355
Tab. 1: The JNS process performances
In Figure 3 the cause effect matrix is shown. It is possible to note the priorities of customer satisfaction, in particular the team did not take into account the functionality of the nasal spray because it had a significant yield and the Japanese market had shown satisfaction analyzing data from other countries in which the nasal spray has already been commercialized. The absence of blistering contaminations represented the most important critical to customer, defined by a high impact. Following the different parts of the system the team analyzed where and how this contamination could occur. Overall the failure modes were defined in the blistering process. However the nasal spray could be contaminated during the deployment of other process activities, such as assembling and labeling process. In order to understand the critical areas on which the team should focus for an immediate improvement, a stratification of the different kinds of contaminations was necessary. Strong relationship: Medium relationship: Weak relationship: P R IO R IT Y A c tu a to r L a b e l P E T V ia l F il li n g L a b e li n g A s s e m b li n g B li s te ri n g In s p e c ti o n Damaged blister 2
Contaminations absent in the
blister 5
Label position 2
Conformance product (# batch,
expiry date …) 5 Dirty device 3 Scraps on device 3 TOTAL 69 77 48 3 45 80 45 95 18 Strong relationship: Medium relationship: Weak relationship: P R IO R IT Y A c tu a to r L a b e l P E T V ia l F il li n g L a b e li n g A s s e m b li n g B li s te ri n g In s p e c ti o n Damaged blister 2
Contaminations absent in the
blister 5
Label position 2
Conformance product (# batch,
expiry date …) 5
Dirty device 3
Scraps on device 3
TOTAL 69 77 48 3 45 80 45 95 18
Fig. 3: Nasal spray “House of Quality”
The result of this study highlighted three types of defects: fibers due to blistering process and working lines, black parts, defined by the ink of the labeling process and hairs due to the operators. For this reason the main CTQs were, blistering, PET sheets and labeling process.
The same method was applied to the other CTCs identifying where and how the team should operate in order to obtain an increase in the performance level of the systems.
For example the absence of scraps on the device could be linked directly to assembling process. In this part of the system different activities and machines are necessary to assemble the cup with the actuators. In particular a drum fixes the actuators on the line. This process could be critical to create scraps on the device. An improvement action was to regulate the speed and the queue of the actuators in order to avoid the blows.
The team deployed whole matrix for each CTCs, often the roof of the “House of Quality” connected different CTQs working only on critical features. By using the QFD the team identified a significant number of improvement actions. For example the team imposed the cleaning of the line before the production of pieces for the Japanese market, reducing the blister contamination and the device dirt defects. The team changed the maintenance method working abating all sources of device defects (i.e. maintenance of clamps that move the device). The supplier process was reviewed imposing high standards of controls suggesting a severe control on PET to reduce the black spots on the blister. These actions increased the process yield and abated the defects, thus having a significant saving. The QFD methodology determined a defect reduction of 80% increasing the saving of 20%.
CASE STUDY 2: QFD IN THE AUTOMOTIVE ENVIRONMENT
The purpose of this case study is to show the power of the QFD methodology in satisfying the requirements of the automotive market. The company in this project produces air cooling pipes, namely KOMO devices, for deluxe vehicles.
This process review takes into account an increase of the quality standards due to the automotive market. Therefore it was fundamental to collect input information on customer needs and expectations, translate the VOC input into meaningful terms and define requirements for the processes and product. The project product is a common pipe used in the air-cooling system of deluxe vehicles. Starting from the voice of the customer, the main goal was to increase the performance level of the whole manufacturing system. In modern organizations processes are fragmented in many departments, therefore the team, characterized by different figures, had to map the primary processes and alternative paths, providing a context picture of the manufacturing system. To understand the complexity of the KOMO system, a process mapping was necessary. The production manager and operators were involved in this step. Figure 4 shows the production stream of the product: the extruded pipes arrive from supplier at the warehouse and then they are transported to the cutting process. In this position an operator cuts the pipes in lengths of 400 mm and eliminates the produced chips. The devices are worked by five machine tools producing on the piece all features required by the customer. Subsequently the pieces, having been washed in an industrial washing machine, are sent to a DC (distribution center), and then delivered to the vehicle constructors. In order
to verify customer requirements, a 100 % sampling was implemented in the distribution center, using a visual inspection. The process mapping allowed to complete the technical axis of the relationship matrix, see Figure 5 [16].
Fig 4: Komo manufacturing system mapping
At the same time the team deployed an analysis of the customers and their requirements. By involving the DC, Quality Assurance and the Marketing department it was possible to classify a list of critical features.
Strong relationship: Medium relationship: Weak relationship: P R IO R IT Y U n lo a d in g E x tr e m it y z o n e o f p ie c e C u tt in g W a s h in g M a c h in e t o o l S u p p li e r Blows on device 5 Extrusion bubbles 3
Off centering error 3
Internal roughness 2
Dirty pipe 1
Scraps on pipe 4
TOTAL 58 10 58 47 52 27 Fig 5: Komo “House of Quality”
This activity was divided into two steps:
- an assessment of the technical reports of the Distribution Center, classifying the main defect categories and
deploying an economic analysis on the Costs of Poor Quality and on the lost gains;
- an implementation of an internal visual inspection to check the capability of the system.
In particular the second step helped us to understand how the voice of the customer impacted on process performance capabilities.
The definition of customer axis was possible assessing the technical reports given by the DC inspection. The team identified the following CTCs: blows on device, off centering error, internal roughness, extrusion bubbles and scraps on device that represented the CTCs (Critical to Customer). Figure 6 shows a Pareto Diagram [17] that highlights the results of the first inspections.
Fig 6: Pareto Diagram of the main defect categories
The QFD team completed the relationship matrix to identify the CTQs. This operation was deployed during a meeting involving different organization figures. It was essential to make an effective use of the main human resources of the company.
It is possible to note that the main defect category was blows on device, followed by extrusion bubbles. The team took also into account this information during the “House of Quality” deployment.
The relationship matrix highlights the main Critical to Quality features on which the team should focus to obtain an improvement of the manufacturing system. For example the washing process could be a significant source of defects with an important impact on customer requirements. By using the matrix, the analysis phase followed two ways: manufacturing processes, considering the machines and all internal features of the system, and materials, involving the supplier processes and external resources. The manufacturing process analysis discovered that the basket of washing process could damage the device when the operator inserted the piece in the machine.
A common discussion between the team members highlighted that the scraps on the device could be caused by the cutting process and in particular by the maintenance of the cutter. The bad clamping of the piece in the machine tools could give rise to the off centering errors.
The analysis phase defined a number of improvement actions. In order to eliminate the blows on the device, the team studied a new method to wash pieces, by changing the basket cover. This choice protected the pieces during the washing, eliminating the blows on the device. The maintenance person Raw material acceptance Cutting Turning Washing Delivery Scraps Scraps Extruded pipe Extruded pipes Cutting Operator Device Device Machine tools Operator Rework Device Device Device Washing Operator Rework Device Air-cooling Pipe Extruded pipes Operator Pareto Chart 0 20 40 60 80 100 BLOWS ON DEVICE EXSTRUSION
BUBBLES OFF CENTERING ERROR
SCRAPS ON DEVICE INTERNAL ROUGHNESS 0 20 40 60 80 100 120
used rubber to cover the basket thus softening the blows due to water pressure during the washing.
The involvement of the extruded pipe supplier and a global review of its processes determined a significant reduction of the bubbles. In implementing QFD the company obtained an increased yield from 98.50% to 99.45%. Considering a production volume per year of 500,000 pieces it is possible to suppose a strong reduction of COPQs.
CASE STUDY 3: QFD IN THE A CARGO CENTER This project is ongoing. However the first results and benefits of the QFD implementation are already visible. It was deployed in an airport Cargo Center with a handling capability of 50,000 ton per year. In last years the Cargo Center had a significant growth of business. For this reason the top management wanted to study the market requirements and improve the customer satisfaction operating on internal services and processes. Therefore the goal of this project is an increase of the performance level indexes (KPI) of the Cargo Center focusing on customer needs and translating them into internal services and transactional processes. The most appropriate tool to achieve this goal was Quality Function Deployment. The QFD team is constituted by the Cargo Center manager, a Quality Assurance person, the person responsible for the warehouse and two members of Operational Excellence department. The first step was to identify the market requirements through a customer interview focused on the satisfaction of the deliveries (on time, documentations, integrity of handling shipments) and the services (completeness and clarity of invoices and other information).
It was possible to add further comments to the interview in order that new inquires could be included to customer axis.
In this way the main critical to customer were: - delivery on time;
- correct handling shipment;
- absence of damage on pallets or containers; - correct and exact information;
- correct and on time invoice.
For every need the team defined an importance of weighting in order to deploy the relationship matrix.
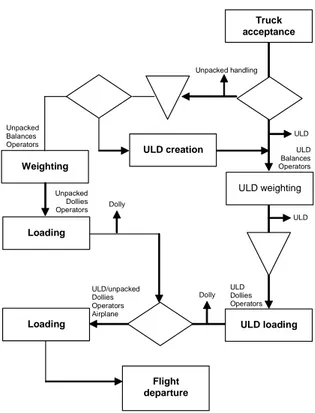
The completion of the technical axis was made by a process mapping. It is important to underline that the processes of a Cargo Center are divided into outbound and inbound cargo activities. For this reason Figures 7 and 8 show the two different situations. In order to clarify the product of this project we introduce the meaning of ULD (Unit Load Device). ULD is the correct terminology used by the air transport industry for containers and loading units that are used for the carriage of cargo by air. Technical specifications for unit load devices are set by the International Air Transport Association (IATA). These relate to the dimensions, material and other characteristics of the ULD. For more clarity the team deployed the relationship matrix for each flow, outbound and inbound stream as seen in Figures 9 and 10. We can note that the customer requirements are the same for every matrix. In fact the most important customer needs had the same impact on export or import processes. In particular the weighting column shows that “delivery on time” and “correct handling shipment” are the most important CTCs. They defined the “value” for the customer and therefore they represented the point to begin the improvement project.
Fig 7: Cargo Center outbound process mapping
The process mapping highlights the activities and processes that are necessary in order to delivery or accept freight.
Fig 8: Cargo Center inbound process mapping
For every activity the operator has an important role to define the capability of the processes or the whole system. The
Truck acceptance ULD creation ULD loading Loading Weighting ULD weighting Loading ULD Dolly ULD/unpacked Dollies Operators Airplane Unpacked handling Flight departure Unpacked Balances Operators ULD Balances Operators ULD ULD Dollies Operators Unpacked Dollies Operators Dolly Flight landing Error verification Stock Unloading Transporters Breakdown Trucks Operators Truck load Handling ULD Operators Dollies Thru unit Europallet Dollies Operators
team took into account this particular aspect during the deployment of the QFD. Figure 9 shows the relationship matrix for the outbound cargo system. The process mapping suggested that the critical area was “ULD creation”, followed by “truck acceptance”. These processes had a strong impact on the “delivery on time” CTC. At the same way the QFD analysis underlined that “unloading”, “breakdown” and “Europallet creation” were the most important processes on which the team should work in order to increase customer satisfaction. For every critical process a particular analysis was deployed by the team. For example a stratification of the “ULD creation” mapping was necessary to identify the main inputs. In particular the role of the operators was fundamental for the process capability. The clarity and effectiveness of their procedures determined the on time completion of the activities. For this reason the definition of KPI indexes could measure the cycle time. Strong relationship: Medium relationship: Weak relationship: PR IO R IT Y T ru c k a c c e p ta ti o n U L D w e ig h ti n g U n p a c k e d w e ig h ti n g U L D L o a d in g U n p a c k e d L o a d in g L o a d in g A d m in is tr a ti o n U L D c re a ti o n Delivery on time 4 Correct handling shipment 5 Absent of damages on pallets or containers 2 Correct information 3 On time registration 2 On time invoice 3 Correct invoice 3 TOTAL 57 26 26 24 18 18 27 117
Fig 9: Outbound process “House of Quality”
The “truck acceptance” process was studied by involving the suppliers. In fact the real problem for the delivery delays was a lot of mistakes on the truck documentation.
The publication of guidelines explaining what is necessary for the truck acceptance, could help the Cargo Center to speed up its activities.In the same way the team assessed the inbound processes (Figure 10), studying the variability and defect causes using KPI indexes to measure the performance level of the system and brainstorming techniques to involve the employees in the improvement processes.Table 2 shows the voice of the process defined by Cpk index. A global assessment highlighted a no satisfactory performance for the system.
This project is ongoing, but the first results have already been noted. By implementing a number of the improvement actions, such as:
- clear procedures for ULD and Europallet creation and breakdown processes;
- partnership with supplier for a more effective management of the documentation;
- sharing of data and information with administration employees to manage the invoices;
- a creation of a database to measure and analyze step by step the voice of the process;
it was possible to obtain an increase in the performance level of the whole system.
Strong relationship: Medium relationship: Weak relationship: PR IO R IT Y U n lo a d in g T ra n s p o rt e rs a n d d o lli e s S to c k B re a k d o w n E u ro p a lle t T ru c k l o a d A d m in is tr a ti o n Delivery on time 4 Correct handling shipment 5 Absent of damages on pallets or containers 2 Correct information 3 On time registration 2 On time invoice 3 Correct invoice 3 TOTAL 57 30 27 117 117 57 27
Fig 10: Inbound process “House of Quality” Cpk
Delivery on time 0.67
Correct handling shipment 1.02
Absence of damage on pallets
or containers 1.33
Correct information 0.85
On time invoice 0.90
Tab. 2: Cpk results before improvement action implementation
In particular the team reduced the lead time of processes by 20 %, with improved Cpk indexes [18] (these are average values considering the different handling shipments). Supplier training on documentation management is giving important benefits, for the acceleration of the truck acceptance.
CASE STUDY 4: QFD IN THE HEALTHCARE ENVIRONMENT
The final project is deployed in the healthcare environment and it focuses on the Radiology department of a hospital. In this context customer satisfaction has a double meaning. In fact it is important to provide an efficient service. Nevertheless it is fundamental to discover criticalities and priorities for the patient’s life. For this reason quality management tools and continuous improvement techniques are necessary to assure a high level of services. In order to achieve this goal a project has begun involving the main figures of the department that constitute the QFD team. In particular the project arose from a
number of customer interviews that the Radiology department deployed in order to measure the customer satisfaction in the last three years. The results of this analysis highlighted that:
- 48% - patients satisfied with the service; - 34% - patients completely satisfied; - 18% - patients unsatisfied.
The interviews involved a significant sample of patients. Therefore, the formal goal of the project was to move the patients from the “unsatisfied” class toward the “satisfied” class and increase the percentage of the “completely satisfied” category. For more clarity Figure 11 shows the mapping of the Radiology system. The first step is the exam booking where a prioritization of patients is defined. This phase can be deployed by phone or directly at the department desk. The critical situations are processed immediately while the normal cases are scheduled, assessed and planned for the exam execution following the standard procedures.
Fig. 11: Radiology system mapping
The core of the system is the exam execution in the Radiology laboratory and the analysis of the results. The
preparation of the reports and the delivery of the results to patients complete the system mapping. As defined, it is fundamental to determine prioritizations in order to safeguard the patient’s life. By involving the customer service department it was possible to select a list of critical to customer features. This step completed the customer axis in the relationship matrix of the “House of Quality”. Figure 12 shows a number of CTCs that include both simple booking activities and the critical procedures of the Radiology laboratory. In particular the time of radiation has a significant impact on patient healthcare and a continuous control must be deployed. As we can note the critical area on which the team should focus to increase customer satisfaction are “Radiology exam execution”, “Result analysis” and “Exam booking”.
Strong relationship: Medium relationship: Weak relationship: P R IO R IT Y E x a m b o o k in g R e q u ir e m e n t s c h e d u li n g A c c e p ta n c e R a d io lo g y e x a m e x e c u ti o n R e s u lt a n a ly s is R e p o rt p re p a ra ti o n R e s u lt d e li v e ry F il in g Booking on time 3
Low difficulty in booking 3
Information on desk 2 Employee kindness 2 Privacy 2 Waiting time 3 Delivery on time 3 Correct diagnosis 5
Minimum time of radiation 5
TOTAL 80 5 22 150 87 18 26 63
Fig. 12: Radiology system “House of Quality”
For each CTQs the team is studying possible improvement actions. For example the team has already defined the following actions:
- more information for the patients on booking process, focusing overall on the call center activities (guidelines, emergency management, kindness, etc…);
- more effective procedures and guidelines for operators in order to improve the result analysis and filing process (emergencies, filing database, privacy, order processing, etc…);
- a continuous control of the level of the radiation in order to preserve the healthcare of the patients and operators; - an improvement in the relationship between the Radiology
unit and other departments;
- a more efficient management of the urgent exams and emergencies. External exams Patient data Internal exams Further exams Urgent exams Planning Result exams Exam Booking Requirement Scheduling Result analysis Result delivery Customer satisfaction measurement Data and information Filing Report Preparation Other departments Other departments Assessment of emergency Acceptance Radiology Exam execution
Following these first steps the team will be able to assess the improvement status of the system. Surely a recursion approach is necessary to reach the project goal and maintain the results. The Quality Function Deployment provides all necessary tools in order to understand the sources of problems and the possible solutions. The hospital management hopes to complete the project at the end of 2007.
CONCLUSIONS
The main goal of this paper was to show the power and flexibility of the Quality Function Deployment. Every case study demonstrates that “QFD is an effective tool to provide the coupling between the customer satisfiers and the design process” [19].
The integration of the customer requirements with the features of a manufacturing or transactional system determines the CTQs (Critical to Quality), the most important parts of a process or a product on which the project team must focus for immediate improvement of customer satisfaction.
By involving an heterogeneous team, that includes all necessary work functions, it is possible to deploy an efficient project [20]. In fact QFD provides all necessary tools and techniques to achieve excellence and ambitious goals [21]. A structured and rigorous roadmap quantifies the results of its application in term of company savings or customer satisfaction: this aspect is often neglected in other improvement techniques. The first two cases focus on manufacturing systems underlining the importance of the effectiveness and efficiency of the processes. The last two projects explain the application of QFD in order to increase the performance level of a service.
In particular the project on the Radiology department shows that the voice of the customer can assume two different meanings: the satisfaction of a service (i.e. on time, fast, etc..) and the preservation of healthcare (i.e. a correct diagnostic, protection from excessive radiation, etc…). We can conclude that QFD is both a strategy and a tool which provides a mechanism for multi-functional team to capture the customer needs and to link these requirements into product/service systems.
ACKNOWLEDGMENTS
Acknowledgments are due to the ESF for support provided through INGENIO research grant. Special thanks to Mrs. Mary Flynn who checked the manuscript.
REFERENCES
[1] Schmidt, S.R., Kiemele, M.J., Berdine, R.J., 2005,
Knowledge Based Management, Air Academy Press,
Colorado Springs, CO, pp. 152.
[2] Quality Management Division ASQ, 1999, The
Certified Quality Management Handbook, Milwaukee, WI,
pp.207-209.
[3] Pyzdek, T. 2003., The Six Sigma Handbook, McGraw-Hill, New York, NY, pp. 121-122.
[4] Stamatis, D.H., 2002, Six Sigma and Beyond:
Foundations of Excellent Performance, St. Lucie Press,
New York, NY, vol.1, pp.71-72.
[5] Goetsch, D.L., Davis, S.B., 1994, Introduction to
Total Quality, McGraw-Hill, New York, NY, pp.487-488.
[6] Moen, R.D., Nolan, T.W., Provost, L.P., 1991,
Improving Quality Through Planned Experimentation,
McGraw-Hill, New York, NY, pp.299-301.
[7] Stamatis, D.H., 2002, Six Sigma and Beyond:
Foundations of Excellent Performance, St. Lucie Press,
New York, NY, vol.1, pp.73-74.
[8] Brue, G., 2003, Six Sigma for Manager, McGraw-Hill, New York, pp.23-28.
[9] Kano, N., Seraku, N., Takahashi, F., Tsuji, S.,
Attractive Quality and Must-Be Quality, Hinshitsu 14 no.2,
JSQC, Tokyo, JP, pp.39-48.
[10] Six Sigma Academy, 2002, The Black Belt Memory
Jogger, GOAL/QPC, Salem, NH, pp.50-51.
[11] Andersen, B, Petterson, P., 1996, The Benchmarking
Handbook, Chapman & Hall, London, UK, pp.13-15.
[12] Bicheno, J., 2000, The Lean Toolbox. PICSIE Books, Buckingham, UK.
[13] Womack, J.P., Jones, D.T., 2005, Lean Solutions. How
Companies and Customers can create Value and Wealth Together, Simon & Schuster, London, UK.
[14] Liker, J.K., 2004, The Toyota Way. 14 Management
Principles from the World’s Greatest Manufacturer,
McGraw-Hill, New York, NY.
[15] Pande, P.S., Neuman, R.P., Cavanagh, R.R., 2000, The
Six Sigma Way. How GE, Motorola, and Other Top Companies are honing their performance, McGraw-Hill,
New York, NY, pp. 28.
[16] Aggogeri, F., Gentili, E., 2006, Lean Six Sigma: la
nuova frontiera per la qualità, Franco Angeli, Milan, Italy
(in Italian), pp. 136-137.
[17] Bicheno, J., 2000, The Lean Toolbox. PICSIE Books, Buckingham, UK, pp.124-125.
[18] Oakland, O.S., 2005, Statistical Process Control, Butterworth Heinemann, London, UK, pp.263-274.
[19] Juran, J.M, Godfrey, B.A., 1999, Juran’s Quality
Handbook, McGraw-Hill, New York, NY, pp.73-74.
[20] Stebbing, L., 1993, Quality Assurance, Ellis Horwood Limited, UK, pp. 25.13-25.14.
[21] Re Velle, J.B., Moran, J.W., Cox, C.A., 1998, The
QFD Handbook, John Wiley and Sons Inc., New York, NY,