Università degli studi di Padova
Dipartimento di Scienze Statistiche
Corso di Laurea Magistrale
in Scienze Statistiche
Financial ownership in European countries:
a multilevel analysis
Relatore: Prof. Omar Paccagnella Dipartimento di Scienze Statistiche Università degli Studi di Padova
Co-relatore: Prof. Marcel A. Croon
Department of Methodology and Statistics Tilburg University (The Netherlands)
Laureanda: Barbara Guarda Matricola 1013768
Università degli Studi di Padova – Universiteit Van Tilburg | 3
Index
Introduction ...5
1.Why to focus on financial aspect? ...9
1.1 Financial and real assets ... 14
2.The SHARE project ... 19
3.A first analysis ... 23
3.1 Participation and investments in financial activities... 23
4.Analysis ... 39
4.1 Why using a multilevel structure? ... 39
4.2 Does group membership matter?... 41
4.3 Random Group Resampling ... 43
4.4 Within and Between Analysis ... 48
5.Modelling ... 55
5.1 Multilevel model ... 55
5.2 Estimate of multilevel model ... 58
4 | Financial ownership in European countries: a multilevel analysis
6.Different modeling for each financial asset ... 69
6.1 The multilevel logistic regression... 71
7.Heckman selection model ...97
7.1 Model estimation ... 99
Conclusions ... 105
Università degli Studi di Padova – Universiteit Van Tilburg | 5
Introduction
Money is better than poverty, if only for financial reasons.
Woody Allen
Planning of his/her personal finances, a person may want to consider for own future needs a wide range of banking, investment and insurance products. Future planning and investment decisions play an important role to achieve financial stability, especially after retirement. The topic of this thesis is about the holding of financial assets by European households in the years 2006/2007, whose head is at least 50 years old. It is to assess which might be the demographic or socio-economic factors that might push a households to decide to invest and how much. Much literature exists about this subject. The innovative aspect of this thesis is to consider all these factors regarding the European region of residence, offering consequently models with a structure at two levels.
Three research questions can be developed in this work. The first question is whether countries make a difference with regard to European households portfolio choices. Indeed, it could be argued that the current situation of economy and lifestyle in some countries may condition the behavior of their citizens on risky and not risky financial activities. The second research question will investigate which households’ factors and countries characteristics have an impact on ownership of financial assets. Could lower educated people or poor people have a weaker portfolio of financial products compared with other groups? The third question concerns the financial assets, separately considered. Which are the factors affecting
6 | Financial ownership in European countries: a multilevel analysis
the choice between a product or another one? All of these questions will be treated with the consideration of two level structured data: households and their countries of residence. Some empirical results are confirmed, such as the strong relationship between real assets and financial assets or the significant effects of some demographic variables and socio-economic conditions of households and countries. What is new is the analysis by considering two levels of statistical units: households and European regions of residence. The data are structured in such a way to observe N units (households) grouped into J groups (regions). Being families naturally assigned to the region, our aim is to define the existence or not of some group effects. To capture some of the economic characteristics and well-being at the country level will be used two well-known and widely used indexes: the Gross Domestic Product and the Human Development Index. The GDP, macroeconomic indicator of development that represents the monetary value of the goods and services produced annually in a given country is accompanied by the HDI, which takes into account factors such as education and life expectancy to assess the quality of life in countries considered. The two indices may be potentially related, but using them as separate items in the analysis trying to explain two different aspects of a country.
Analysis instead will see second-level variables represented by regions, primarily for their relative abundance greater than countries and secondly, to capture any differences in social and demographic characteristics that can vary within the same nation. First, statistical techniques aimed at confirming the validity of the use of a two-tier structure will be used. We try to determine whether the internal homogeneity of the groups and the lack of homogeneity between the groups in terms of outcome variability is such as to suggest that a multilevel structure is suited to explaining the data. The multilevel analysis will be conducted initially for the total of the financial investment, including the following financial assets: bank accounts, bonds, stocks, retirement accounts, contractual savings for housing, mutual funds. Then, the multilevel analysis will be conducted considering each asset individually, in such a way to identify possible determinants for each asset. This will be compared with a multilevel logistic model, whose purpose is to explain the decision to participate in the financial market and no more the amount of the investment. Finally, a further analysis, with the same purpose
Università degli Studi di Padova – Universiteit Van Tilburg | 7
of the previous one, will be implemented: it is a Heckman selection model, whose advantage is to jointly consider, for units having a particular asset, also the invested amount.
Our detailed analysis of microeconomic sample data documents relatively low financial market participation and persistent differences across countries: many more Swedish, Danish and Swiss households participate on in the stock market than in those from Italy and, especially from Greece, Czech Republic and Poland. One consideration to keep in mind during the analysis will be the coverage of the sample: respondents aged 50 years and older. Conclusions will be carried out by detecting the most relevant results.
Università degli Studi di Padova – Universiteit Van Tilburg | 9
1. Why focusing on financial aspect?
‘Finance’ is a very wide term and it can be used to identify the study of the science of managing funds. It includes public, personal and business finance. It includes also things related to lending, spending and saving money. We are going to focus on personal finance. Personal finance refers to the financial decisions done by households. The aim is to invest or save money. When planning personal finances, a person would consider suitability to their needs of a range of banking, investment and insurance products (stocks, bonds, mutual funds, life insurance, retirement accounts and so on). Saving planning is an important part of long-term plans to gain financial stability, especially after retirement. Probably the financial aspects are among of the most important issues to be considered for the future and, thinking to a long-term plan, managing savings becomes an important component of personal finance. Savings would help people to make investments in the future so that they might have a secure life. But, we also need to keep in mind that “A business that makes nothing but money is a poor business.” (Henry Ford)
As underlined in the introduction, the aim of this thesis is to investigate and understanding factors affecting the portfolio choices for European people aged 50 or more. Any evaluations on optimal allocation of financial portfolio will not be subject of this work. More precisely because of the characteristic of analyzed sample, attention will be given to the relationship between retirement and ownership of financial assets during the interpretation of the final results. Is it possible that, because of the ownership of more savings, financial investments
10 | Financial ownership in European countries: a multilevel analysis
are higher after retirement? In fact, because of the population ageing, the lifestyle of older people is central to the social studying. Furthermore, which are the demographic and economic factors leading an individual to invest in finance? Are there any significant differences between European investors? Might country economy influence the decision? Is the well-being level of the country affecting the choice?
Financial wealth is an important variable to keep in mind when we want to investigate the quality of life of people. How people plan and manage their savings and their portfolio choices could be important to understand welfare level of Europeans. Referring in particular to the age of households, the value of financial assets can be interpreted as an indicator of future lifestyle and it can determine the future amount of liquidity. Consequently, the focus on financial assets aspects were decided because of our interesting in understanding the factors influencing lifestyle of European citizens. Moreover, portfolio choices affect the rate of wealth accumulation, due to differential returns on asset types . The asset specific risk also affects the distribution of wealth (Wolff, 2006).
A large number of studies about households portfolio was done since the 1950s. Some theoretical predictions, collected by Gollier (2002), show how wealthier people should invest more in risky assets than less wealthier households and invest a larger share of their wealth in risky assets (under the assumption of a decreasing absolute risk aversion). Besides, households that are more likely to be liquidity constrained in the future will invest less in risky assets (Gollier, 2002). Owning risky assets is compensated by higher expected returns on one’s portfolio. An increase in risk aversion reduces the demand for risky assets. Our attempt is not to describe a dynamic scheme of portfolio choices during time, but the one of finding diversification factors in a static problem. Since of the general purpose of investing in financial assets to think the future after retirement, our interest is concentrated to households aged fifty or more. Some of them are already retired by their jobs, others are still working: is this variable affecting portfolio? Actually, the literature say us that households prefer to spread risk over their lifetime or before retirement: besides, people having pension funds over time will select riskier portfolio structures (Gollier, 2002).
Università degli Studi di Padova – Universiteit Van Tilburg | 11
Empirical findings about household finance cover three strongly correlated aspects: participation decision, households portfolio pattern and portfolio span, defined as the number of asset types held. Portfolio span is shown to be strongly associated with income, wealth and education variables (Wolff, 2006). The results of his another analysis indicate that life-cycle factors, such as income, wealth as well as race and education play determinant roles in determining portfolio pattern. Besides, a large number of households have no assets.
12 | Financial ownership in European countries: a multilevel analysis
Portfolio span
Age percentiles 0 1 2 3 4 5 6 7 Total
<=61 5,9% 6,5% 4,4% 3,2% 1,3% 0,6% 0,1% 0,0% 22% (61,66] 5,8% 5,2% 3,5% 2,1% 1,3% 0,5% 0,1% 0,0% 19% (66,73] 8,6% 5,9% 3,5% 2,1% 1,1% 0,3% 0,1% 0,0% 21% (73,81] 10,8% 5,1% 2,3% 1,0% 0,4% 0,1% 0,0% 0,0% 20% >81 12,1% 4,0% 1,5% 0,6% 0,2% 0,0% 0,0% 0,0% 18% Total 43,1% 26,7% 15,1% 9,0% 4,4% 1,4% 0,3% 0,0% 100% Female Not married 21,2% 10,8% 5,3% 2,9% 1,3% 0,4% 0,1% 0,0% 42% Married 4,6% 3,9% 2,2% 1,3% 0,6% 0,2% 0,0% 0,0% 13% Male 17,4% 12,0% 7,6% 4,8% 2,5% 0,8% 0,2% 0,0% 45% Not married 12,7% 8,0% 4,9% 3,1% 1,6% 0,5% 0,1% 0,0% 31% Married 4,8% 4,0% 2,6% 1,7% 0,8% 0,3% 0,1% 0,0% 14% Total 43,1% 26,7% 15,1% 9,0% 4,4% 1,4% 0,3% 0,0% 100% Country Austria 1,4% 1,4% 0,7% 0,2% 0,1% 0,0% 0,0% 0,0% 4% Belgium 3,7% 2,8% 1,6% 0,9% 0,5% 0,2% 0,0% 0,0% 10% Czech Republic 3,9% 2,3% 1,5% 0,8% 0,2% 0,1% 0,0% 0,0% 9% Denmark 1,7% 2,2% 1,7% 1,4% 0,7% 0,2% 0,0% 0,0% 8% France 3,0% 2,6% 1,9% 1,1% 0,5% 0,2% 0,1% 0,0% 9% Germany 2,6% 2,1% 1,3% 1,0% 0,4% 0,1% 0,0% 0,0% 8% Greece 6,2% 0,9% 0,1% 0,0% 0,0% 0,0% 0,0% 0,0% 7% Italy 5,7% 2,3% 0,6% 0,2% 0,1% 0,0% 0,0% 0,0% 9% Netherlands 3,8% 2,7% 1,3% 0,4% 0,1% 0,0% 0,0% 0,0% 8% Poland 4,2% 2,9% 0,9% 0,1% 0,0% 0,0% 0,0% 0,0% 8% Spain 4,5% 1,2% 0,4% 0,2% 0,1% 0,0% 0,0% 0,0% 6% Sweden 1,0% 1,7% 2,0% 2,1% 1,4% 0,5% 0,1% 0,0% 9% Switzerland 1,4% 1,5% 1,0% 0,6% 0,3% 0,1% 0,0% 0,0% 5% Total 43,1% 26,7% 15,1% 9,0% 4,4% 1,4% 0,3% 0,0% 100% Risk preferences
Not wi l ling to ta ke a ny fi nancial ri sks 38,9% 21,1% 9,4% 4,2% 1,6% 0,5% 0,1% 0,0% 76%
Above a verage fi nancial ri sks expecting to
ea rn a bove average returns 0,4% 0,8% 1,1% 1,4% 1,0% 0,4% 0,1% 0,0% 5% Avera ge financial risks expecting to earn
a vera ge returns 3,6% 4,6% 4,4% 3,2% 1,7% 0,5% 0,1% 0,0% 18% Hi gh financial risks expecting to earn
s ubstantial returns 0,2% 0,3% 0,3% 0,2% 0,1% 0,1% 0,0% 0,0% 1%
Total 43,1% 26,7% 15,1% 9,0% 4,4% 1,4% 0,3% 0,0% 100%
Employed 26,8% 14,2% 7,1% 3,3% 1,5% 0,3% 0,1% 0,0% 53%
Other 16,4% 12,5% 8,0% 5,7% 2,9% 1,1% 0,2% 0,0% 47%
Total 43,1% 26,7% 15,1% 9,0% 4,4% 1,4% 0,3% 0,0% 100%
Table 1.1 Portfolio span, by some characteristics. Source: SHARE data.
Università degli Studi di Padova – Universiteit Van Tilburg | 13
Overall household portfolio span in our sample varies among different demographics groups. Table 1.1 shows portfolio span values by other variables, such as gender, country, age, risk preferences and job situation. According to the age distribution of the whole sample, the 20°-percentiles are at 61, 66, 73 and 81 years old respectively: portfolio span decreases with the increasing of ageing. For each different class of positive span, the number of households is decreasing with age. Anyway, the “null-portfolio” is more characteristic for older people. Other factors, such as gender, marital status (or having a partner), country of residence and preferences about financial risk seem to affect portfolio span. Female heads of household, not married or with low risk preferences, households living in Poland, Czech Republic or Greece have a less diversified portfolio. If we look at gender influence, it is notable that female heads tend to have a smaller span than the male. Females tend to prefer a reduced span and most of them prefer to invest nothing. In particular, the most of females answering the questionnaire is not married and it seems that they prefer to not invest. Risk preferences are strongly affecting portfolio choices. Households choosing no risks see a decreasing distribution of portfolio span. The same for people preferring average financial risks. Instead, for people who decide to take substantial risks, this distribution is hump shaped, because it has the maximum around 1 or 2 assets. We see two households having 7 assets and preferring average financial risk.
14 | Financial ownership in European countries: a multilevel analysis
1.1 Financial and real assets
We are asking ‘how households use financial instruments to attain their objectives’. Households must plan over long but finite horizons; they have important non-traded assets, notably their human capital; they hold illiquid assets, notably housing; they face constraints on their ability to borrow; and they are subject to complex taxation (Campbell, 2006).
Households allocate their wealth into financial and real assets . Holding financial or real assets could help people to face retirement. Financial assets are economic resources. They are something that could be owned or controlled to produce a positive value. There are many kinds of financial assets for personal finance, such as bank accounts, bonds, stocks, mutual funds, individual retirement accounts, contractual savings and life insurance policies.
Household financial assets include cash, shares, funds, insurances and constitute an important part of the overall wealth and a source of revenue. In general, data on household participation in financial market play an important role in economic analyses. For instance they are used by governments in setting social protection policies, especially pension provisions, because they give an indication of how they are prepared for the future. Besides, considered with other factors like economic growth, they give an indication of how households would be able to face an economic downturn, if it happened.
There are different classifications for assets. We can discern risky financial assets, which may include indirect stockholdings such as mutual funds, retirement accounts and stocks, bonds or mortgages. However, there are also other kind of risky assets, including real estates and own businesses. Table 1.1 lists household assets considered in this thesis. We will include into the analysis also liabilities, such as mortgages and different types of loans (Haliassos at al, 2002).
Università degli Studi di Padova – Universiteit Van Tilburg | 15
Bank accounts
A bank account is a financial arrangement between a depositor or debt holder and a bank. It considers the financial transactions between the customer and the bank. They can be of various type. In fact, one where a credit is maintained is called a deposit account, while an account to which a customer has a debt with the bank is called loan account. The most familiar kind of deposit account is savings’ ones, while a loan account is best represented by a mortgage held by the bank.
Bonds
A bond is a tool of indebtedness of the bond issuer to the holders. It is a debt security, under which an individual has a debt with the holder and, depending on the terms of the bond, has to pay interest and/or to repay the principal at a later date.
Stocks
A stock is a portion of a corporation. It involves a claim on part of the corporation. Ownership is determined by the number of shares a person owns relative to the number of total shares. Stock prices are usually driven by expectations of corporate earnings. The stockholders have profit if the company pays a dividend. It is a way to reward stockholders, who are the actual owners of the company, for their investment.
Mutual funds
Mutual fund is a fund, managed by an investment company with the financial objective of generating high returns. It is a pool of funds collected from many investors with the aim to invest them in different stocks, bonds and similar assets. Collecting the money from investors, mutual funds invest in other assets constituting the patrimony of the undivided fund, of which each investor owns a certain number of shares. One of the main merits of mutual funds is that they give small investors access to professionally managed portfolios of stocks, bonds and other securities, which would be quite difficult to create with a small amount of capital. Each shareholder participates proportionally in the gain or loss of the fund.
16 | Financial ownership in European countries: a multilevel analysis
Individual retirement
accounts
An Individual Retirement Account is a form of retirement plan, provided by many financial institutions. It is an investing tool used by individuals to earn and earmark funds for retirement savings.
Contractual savings for
housing
Contractual savings are defined as "housing solutions for those families whose needs cannot be met at market conditions and for which there are allocation rules. "
From the perspective of households, Contractual Savings for Housing contracts facilitate the accumulation of equity and offer the prospect of a low-interest loan. The EU member states are characterized by the heterogeneity of housing situations and national of policies and the concept of social housing tends to vary from one country to another.
Life insurance
policies
Life insurance is a contract between an individual and an insurer, where the insurer promises to pay a designated sum of money after the death of the insurance policy holder. Most people hold life insurance just for the ultimate payment in order to provide for their dependents. Life insurance policies can typically be of two major types: term insurance and permanent insurance. Term insurance will pay a death benefit only if the insured dies during the term of the policy. No benefits are paid if the insured lives beyond the term of the policy. For this reason, term insurance policies will carry the lowest premiums in the earlier years of the policy. However, as an individual gets older, term insurance gets more expensive A permanent life insurance policy, often referred to as whole life insurance, is intended to provide insurance coverage throughout the life of the insured. It is a life insurance policy that remains in force for the insured's whole life. Because of the inevitable death of the insurance holder, the insurance payout is made to the contract’s beneficiaries. They also include a savings component, which accumulates a cash value in order to keep the premiums level regular (the cost of a whole life policy is somewhat more expensive than for a term policy in the earlier years because, as the insured gets older, their mortality rate increases).
Università degli Studi di Padova – Universiteit Van Tilburg | 17
Table 1.2 Financial assets.
Mortgage
The mortgage is a security interest on one thing others, set up to serve as security for a debt. However, it does not result in loss of possession by the debtor-owner of the asset subject of the asset. Mortgages are also known as "liens against property" or "claims on property."
Housing
The most important illiquid asset in household portfolios is housing. Houses are like long-term bonds and can be used to hedge changes in the relative price of housing and nonhousing consumption (Pelizzon and Weber (2005), Sinai and Souleles (2005)). Since houses are illiquid assets, homeowners find it costly to adjust their consumption of housing services in response to economic shocks. This illiquidity may discourage homeownership and financial risk taking by homeowners.
The SHARE project
Università degli Studi di Padova – Universiteit Van Tilburg | 19
2. The SHARE project
The question isn't at what age I want to retire, it's at what income.
George Foreman
In order to analyze financial participation of the people before or during retirement we choose to use data obtained from survey SHARE, the survey of Health, Ageing and Retirement in Europe (Borsch-Supan et al.).
Its aim is to collect multidisciplinary information about health, socio-economic status and social and family relationships of households aged 50 or more. It is coordinated centrally at the Munich Research Institute for the Economics of Aging. Three surveys took place until now. The first in 2004/2005, while the second one in 2006/2007. In our analysis we use data that relate only to second survey (Wave 2), available since 2006. Two new EU member states (the Czech Republic and Poland) have joined SHARE, in addition to Denmark, Sweden, Austria, France, Germany, Switzerland, Netherlands, Belgium, Italy, Spain and Greece.
The questionnaires in each wave have the following characteristics:
o Multidisciplinary o Cross-nationality o Lengthways
20 | Financial ownership in European countries: a multilevel analysis
The collected data include variables about health (mental health, cognitive ability, risk behaviours, use of medical facilities), social networks (assistance within the family, transfer of goods and money, social relationships, volunteering), economic and financial status (employment, job characteristics, job opportunities after retirement age, sources and composition of the income, wealth and consumption, real estate, education, financial asset holdings).
The population of households is defined as “the set of families with at least one person who was born before 1957, who speaks the official language of the country and who does not live during the survey period in another country or an institution like a prison”.
The main questionnaire consists of 20 modules, collecting information on almost all aspects of the life of European households. Since some applications relate to the individual and other the whole family, we can distinguish respondents as answering to him/herself, to the financial part and responding about housing and responding about the family.
Table 2.1 shows the sample composition by country.
Country Total M F Age
under 50 Age between 50 and 64 Age between 65 and 74 Age 75+ Austria 845 4% 4% 4% 2% 3% 5% 4% Belgium 2.096 9% 9% 9% 10% 9% 8% 10% Czech Republic 1.906 1% 8% 9% 9% 9% 7% 7% Denmark 1.704 8% 8% 1% 9% 8% 7% 7% France 2.008 9% 8% 9% 13% 9% 8% 9% Germany 1.642 7% 8% 7% 5% 7% 9% 7% Greece 1.557 9% 9% 10% 18% 9% 9% 9% Italy 1.894 9% 9% 9% 6% 8% 10% 9% Netherlands 1.773 8% 8% 8% 5% 9% 7% 7% Poland 1.739 7% 7% 7% 5% 8% 7% 7% Spain 1.360 6% 7% 6% 5% 6% 7% 8% Sweden 1.887 8% 8% 8% 4% 7% 9% 9% Switzerland 1.024 4% 4% 4% 4% 4% 4% 4% Total 21.435 100% 100% 100% 100% 100% 100% 100%
The SHARE project
Università degli Studi di Padova – Universiteit Van Tilburg | 21
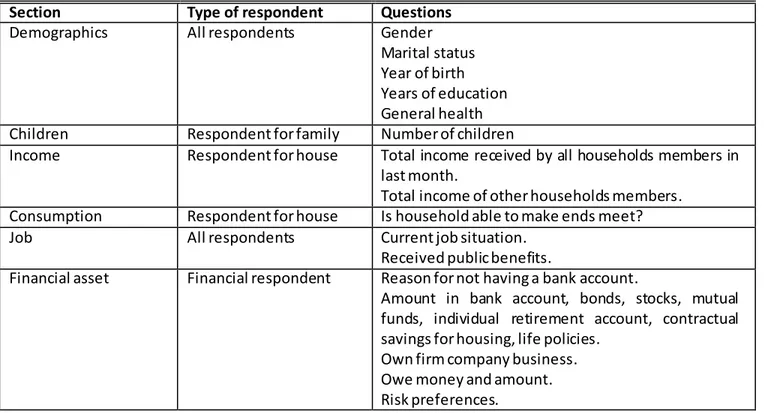
In table 2.2 we report the set of variables used in the analysis.
Section Type of respondent Questions
Demographics All respondents Gender
Marital status Year of birth Years of education General health Children Respondent for family Number of children
Income Respondent for house Total income received by all households members in last month.
Total income of other households members. Consumption Respondent for house Is household able to make ends meet?
Job All respondents Current job situation.
Received public benefits.
Financial asset Financial respondent Reason for not having a bank account.
Amount in bank account, bonds, stocks, mutual funds, individual retirement account, contractual savings for housing, life policies.
Own firm company business. Owe money and amount. Risk preferences.
Università degli Studi di Padova – Universiteit Van Tilburg | 23
3. A first analysis
3.1 Ownership and investment in financial activities
Table 3.1 shows the portfolio configuration in our sample. It regards “total wealth”. We use it because of the quantitative importance of assets such as real estate and value of own share of businesses. Besides these components of wealth represent important factors affecting the composition of asset holdings. Our total wealth is formed by real estate and financial wealth with the addition of all debts.
The first one includes the 77% of the total worth, financial investments includes the 21% and the 2% of the total is due to debts. Households invest a lot in their main residence: the 50% of portfolio value is dedicated to it. Still considering the real estate, 8% consists in own share of business, 6% is given by mortgage on main residence and the 2% is car value. Regarding financial properties, the most of the total worth in portfolio is given by cash amount in bank accounts and individual retirement accounts (5% each). Another large part is given by life insurances (4%). The remainder includes stocks (3%), mutual funds (2%) and bonds (1%). Debts are usually due to friends or relatives (48% of the total debts), loans (24%), student loans (9%), overdue credit cards (6%), debts for cars or other vehicles (4%), overdue bills (2%) and other kind of debts (6%).
Real estate cover the largest slice of portfolio worth. They cover the 77% of the total of which the 65% is due to the main residence. Investing in own main house is the most widespread
24 | Financial ownership in European countries: a multilevel analysis
real investment and it forms the great part of their future wealth, as we can observe from the value of loans (24%).
Portfolio
Percentage on total wealth
Household main residence 50%
Household other real estate 11%
Household value of own share of
businesses 8%
Household cars 2%
Household mortgage on main residence 6%
Estates 77% Bank accounts 5% Bonds 1% Stocks 3% Mutual funds 2%
Individual retirement accounts 5%
Life insurances 4%
Countractual savings for housing 0,4%
Financial assets 21%
All debts 2%
Table 3.1 Total wealth composition.
Ownership of financial assets differs a lot from country to country. Just the holding of a bank accounts is pretty homogenous across them. Almost every household has a bank account where to save own cash. Lower values of asset holding are concentrated on South and East European countries, like Greece, Spain, Italy, Czech Republic and Poland. It is immediately visible as observations belonging to these countries have, on average, less financial assets than the North and West European countries (plus Germany in Central Europe). In general,
Università degli Studi di Padova – Universiteit Van Tilburg | 25
within the EU, in the Member States such as Czech Republic and Poland, the stock of financial assets are smaller than in the other countries.
<20° 20°-40° 40°-60° 60°-80° >80° Total Austria 0,86% 0,79% 0,83% 0,83% 0,82% 4,14% Belgium 2,07% 2,04% 2,06% 2,05% 2,05% 10,27% Czech Republic 2,98% 0,75% 1,87% 1,87% 1,87% 9,34% Denmark 1,67% 1,67% 1,67% 1,67% 1,67% 8,35% France 1,97% 2,04% 1,89% 1,97% 1,96% 9,84% Germany 1,37% 1,32% 1,59% 1,61% 1,61% 7,49% Greece 0,00% 0,00% 0,11% 1,66% 1,39% 3,16% Italy 2,29% 1,44% 2,03% 1,67% 1,85% 9,28% Netherlands 1,74% 1,74% 1,74% 1,73% 1,73% 8,69% Poland 0,00% 4,69% 0,42% 1,83% 1,58% 8,52% Spain 1,44% 1,22% 1,36% 1,32% 1,33% 6,66% Sweden 1,85% 1,91% 1,80% 1,84% 1,84% 9,25% Switzerland 1,02% 0,98% 1,00% 1,00% 1,00% 5,02%
Table 3.2 Distribution of European households, by total investment amount percentile in financial activities.
In table 3.2 we have the percentage of investors grouped by country and total financial investment distribution. The 20° percentiles are calculated for each country to keep into account the differences among countries in terms of purchasing powers. We defined an investor as a person who has at least one financial asset in his/her portfolio (without take into account bank accounts). As denominator when calculating the percentage of portfolio composition, we employ a measure of “total financial wealth”. Greece and Austria have the smallest proportion of total European investors, but it could be due by the small number of respondents in these countries. It seems that distribution across countries and financial investment percentiles is quite regular. This means that, conditionally to the different purchasing power, financial wealth is uniformly distributed across countries. Highest number of investors is in Belgium and France, followed by Czech Republic, Italy, Sweden, Netherlands, Poland, Denmark, Germany, Spain and Switzerland.
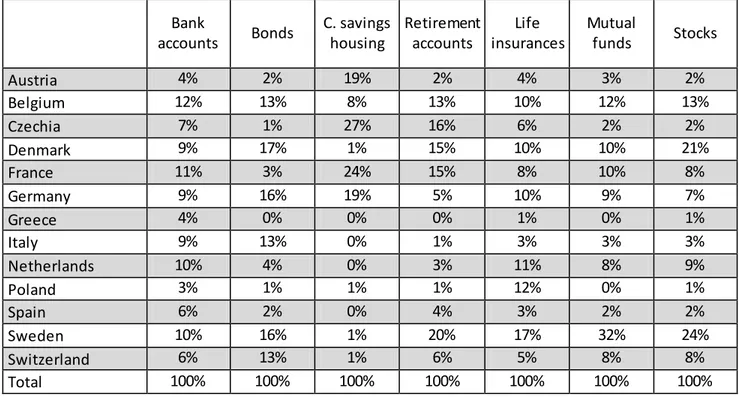
In table 3.3, the percentage of European citizens having the financial assets on the entire number of households of the same country is represented. Austria, Czech Republic and France tend to have a high percentage of own citizens having contractual savings for housing.
26 | Financial ownership in European countries: a multilevel analysis
Denmark has a majority of households having stocks, bonds and retirement accounts and Sweden has a 32% of households holding mutual funds and the 24% prefer to invest in stocks. In Germany, households prefer to invest in bonds and contractual savings for housing, while in Italy we have 13% of households choosing bonds. Netherlands has investments particularly in life insurances, stocks and mutual funds. Belgium has a percentage closed to 10% for every asset. Poland and Greece have usually low number of investors, but the 12% of Polish people tend to invest in life insurances. Switzerland has values around 6-8% with a 13% of investors in bonds. Bank accounts Bonds C. savings housing Retirement accounts Life insurances Mutual funds Stocks Austria 4% 2% 19% 2% 4% 3% 2% Belgium 12% 13% 8% 13% 10% 12% 13% Czechia 7% 1% 27% 16% 6% 2% 2% Denmark 9% 17% 1% 15% 10% 10% 21% France 11% 3% 24% 15% 8% 10% 8% Germany 9% 16% 19% 5% 10% 9% 7% Greece 4% 0% 0% 0% 1% 0% 1% Italy 9% 13% 0% 1% 3% 3% 3% Netherlands 10% 4% 0% 3% 11% 8% 9% Poland 3% 1% 1% 1% 12% 0% 1% Spain 6% 2% 0% 4% 3% 2% 2% Sweden 10% 16% 1% 20% 17% 32% 24% Switzerland 6% 13% 1% 6% 5% 8% 8% Total 100% 100% 100% 100% 100% 100% 100%
Table 3.3 Investors, by country and financial asset on the total of own citizens
Table 3.4 depicts percentage of investors on number of citizens of the same country. Just the 26% of Polish and the 45% of Greek individuals has a bank account and for Czech and Polish households this percentage is about 65%. From table 3.5 we can note that this 65% of Czech people has, on average, a quite high value of bank accounts, if compared with other
Università degli Studi di Padova – Universiteit Van Tilburg | 27
countries in central Europe. Therefore, there is a suspicion that a small portion of Czech people represents a big part of total amount.
Bank accounts Bonds C. savings housing Retirement accounts Life insurances Mutual funds Stocks Austria 90% 4% 49% 9% 23% 8% 8% Belgium 97% 12% 8% 27% 24% 16% 22% Czechia 65% 1% 31% 36% 16% 3% 4% Denmark 96% 19% 1% 38% 30% 16% 43% France 97% 3% 26% 32% 19% 13% 15% Germany 95% 19% 25% 14% 32% 15% 15% Greece 43% 0% 0% 0% 2% 0% 2% Italy 80% 14% 0% 2% 9% 5% 6% Netherlands 96% 4% 0% 9% 31% 12% 17% Poland 26% 1% 1% 2% 35% 1% 1% Spain 83% 2% 1% 12% 10% 4% 5% Sweden 95% 17% 1% 48% 44% 45% 44% Switzerland 95% 25% 1% 28% 23% 22% 28% Total 81% 9% 10% 21% 23% 13% 16%
Table 3.4 Average values of investment, by country and financial asset
Denmark, Sweden and Switzerland have very wide slice of citizens holding different kinds of financial assets. Almost half of Swedish people hold mutual funds, individual retirement accounts, whole life insurances and stocks; the percentage decreases for bonds (17%) and contractual savings for housing (1%). Particular attention has to be given to contractual savings for housing. European countries are characterized by the heterogeneity of housing situations and national of policies. The focus for financial asset is based on certain characteristics of social housing because they can lead to different interpretations from country to country:
- their specific role can be generally expressed as answering to the housing needs of families in terms of access and permanence in decent housing at affordable prices;
28 | Financial ownership in European countries: a multilevel analysis
- the definition of criteria for allocation and target groups;
- average rents differ from each other, reflecting the economic conditions in different countries;
- sector size, measured as a percentage of the stock of housing rented out of the total housing stock.
It can be seen that the countries of Northern and Western Europe tend to have an attention for social sector larger than the Mediterranean countries.
Denmark and Sweden have really low percentages of citizens who benefit these social housing. In these countries, social housing model defines the good of living a public responsibility towards total population. These low values could be explained because of the high average rent for social housing, reflecting economic situations of the countries. The same model is given for Netherlands. Austria has a great percentage of the social rented housing on total number of new constructions. Based on data available in 2005, this percentage is about 30% in Austria. Instead, in our sample, households living in a social house is about 50% of the total. In this way, we note as Austrian social policies are addressed in particular to older people. Same available data for Denmark show an interesting difference: they tell that the 20,7% of total number of constructions are social houses, but our sample underlines that just the 0.82% of population with more than 50 years old benefits. This may be explained again with the social model of the country: it does not focus on a narrower category of beneficiaries, typically the poorest families - elderly, disabled, unemployed, single parents, but the assignment is done through waiting lists or not priority criteria or a number of vacant apartments may be reserved for those families who have an urgent housing needs. Czech Republic and Poland are exceptions in the landscape of Eastern Europe. They were not reached by the mass privatization of 90s, so the public sector of social housing is still present, especially in the Czech Republic.
Investments in bonds vary greatly across European countries to another. The highest figure is Switzerland, with the 25% of its households participating in bonds market. In Germany, Italy
Università degli Studi di Padova – Universiteit Van Tilburg | 29
and Belgium, individuals prefer to invest directly in bonds, while in other European countries such investments are mainly through other kind of assets. Italian households participating in bonds market are 14%. Denmark, Sweden and Germany people are around 19%. In Belgium, the percentage for the same financial asset is 12% and other countries is usually less than 5%.
It is possible to distinguish two different ways to ensure the livelihood of retirees in Europe. The first one is based on creating a type of insurance that provides services related proportionally to income received during employment and financed with contributions made mandatory by the State. The second instead contemplates the adoption of a universal type providing a minimum pension equal for all, funded largely through general taxation. In the latter system, in order to maintain the same level of income had during working life, it is necessary to ensure individual supplementary retirement schemes. The universalistic system is adopted by Sweden and Denmark. In Denmark, in particular, there is a pure universalistic system, under which all citizens, regardless of the pursuit of employment, are entitled to receive a minimum pension (flat-rate) upon completion of a certain age. On the other hand, a pure employment-type system is adopted by France, Belgium, Germany and Austria. A mixed employment-type model is adopted by Italy, Netherlands and Switzerland (Soede et al.). Recovering a cluster analysis from the Social Cultural Planning office about positioning of European countries on the basis of some welfare characteristics, we find out Denmark and Sweden in the same cluster where the general social security scores really high and conversely, the pension system, scores very low. The variable representing pension system covers the main benefits to supplement their income - including pensions, maternity leave and custody arrangements - taxes and social security contributions, and the rules of the labor market. In another cluster we discover Germany, Belgium, France and Austria: for these countries, social security and pension policy are located at a medium level compared to others. Netherlands has almost the same scores, but its social security level is higher. The third cluster contains Italy and Spain: Italian pension system has high scoring, but the worst degree of social security, like for Spain. Anyway, Spain has the highest standard for pension
30 | Financial ownership in European countries: a multilevel analysis
system. The last one includes Poland and Czech Republic, where both variables are quite failing.
Supplementary pensions in our sample are really widespread in Denmark and Sweden (38% and 48% respectively) and also the investment is very high. Countries having a pure employment model observe a participation between 10% for Austria and 32% for France of households who address to additional investments to supplement their retirement. Around 10% of households hold an individual retirement account in Spain and Netherlands. Italy, Greece and Poland have lowest percentages, closed to 2. A particular case is Czech Republic, whose households holding retirement accounts are the 36%!
Wealth
Household wealth is defined as the total market value of dwellings, consumer durable goods and financial assets, net of debts (Wolff, 2006).
Generally, there is a positive correlation between financial investments and the others household resources, measured either by income or real estate.
Having higher incomes leads, generally, to bigger investments in finance.
Incomes <20° 20°-40° 40°-60° 60°-80° >80° Total <20° 5,43% 6,32% 2,66% 2,91% 1,89% 20% >80° 2,47% 2,09% 3,43% 4,88% 7,60% 20% 20°-40° 4,95% 4,96% 3,89% 3,80% 2,31% 20% 40°-60° 3,58% 4,11% 4,32% 4,46% 3,64% 20% 60°-80° 2,84% 3,14% 4,07% 5,00% 5,28% 20% Total 20% 20% 20% 20% 20% 100%
Table 3.5 Distribution of incomes by financial assets percentiles.
Università degli Studi di Padova – Universiteit Van Tilburg | 31
Table 3.5 shows the sum of all households incomes 20°-percentiles by financial assets amount 20°-percentiles. It presents real values, taking into account differences among countries in terms of purchasing power. We see that distribution is quite regular, saying that households tend to invest in financial market a portion quite stable conditionally to their incomes. People staying in the first income-classes tend to invest small amounts and people staying in the highest incomes-classes tend to invest more elevated amounts.
Education
“Wealth is not the only household characteristic that may predict its willingness to take financial risk. Income, age, race, education, and self-reported attitudes to risk may also be important” (J. Campbell, 2006).
The literature documents that a higher education involves some returns, such as a higher wage, and accordingly a higher expected return on savings through increased access to the financial market. Our variable represents the number of household years of education, that sometimes is not explanatory of the real level of education, because of the existence of people who employ a longer time than expected to complete a course of study.
We can confirm that participation in financial market is related with the years of education. Households having at least one financial asset, still without considering bank accounts, show, on average, higher levels of education (with a mean of more than ten years). Instead, households not participating in the financial market (having less than 8 years of education).
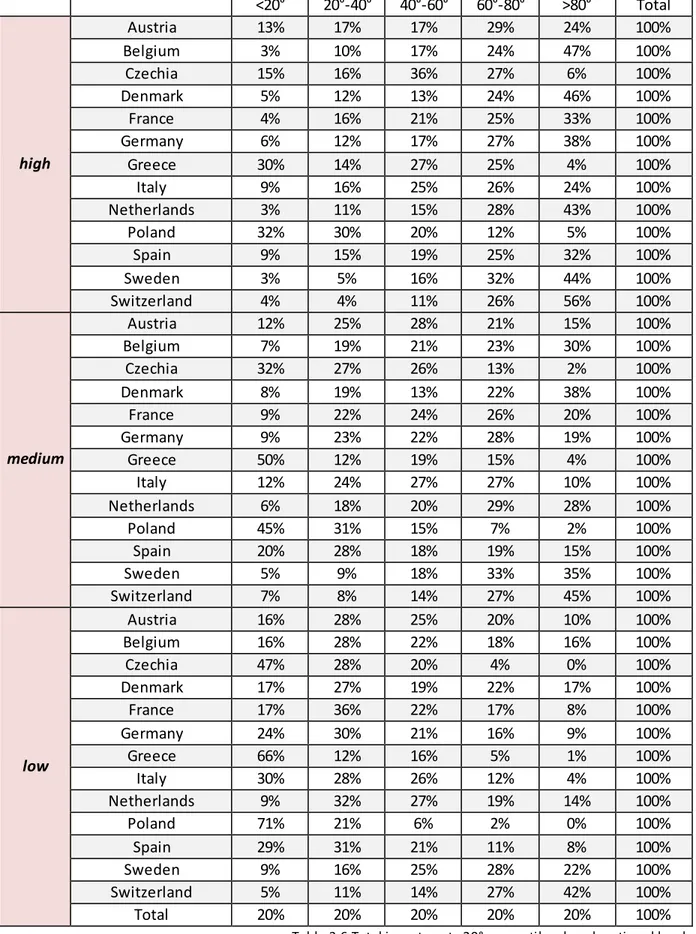
32 | Financial ownership in European countries: a multilevel analysis <20° 20°-40° 40°-60° 60°-80° >80° Total high Austria 13% 17% 17% 29% 24% 100% Belgium 3% 10% 17% 24% 47% 100% Czechia 15% 16% 36% 27% 6% 100% Denmark 5% 12% 13% 24% 46% 100% France 4% 16% 21% 25% 33% 100% Germany 6% 12% 17% 27% 38% 100% Greece 30% 14% 27% 25% 4% 100% Italy 9% 16% 25% 26% 24% 100% Netherlands 3% 11% 15% 28% 43% 100% Poland 32% 30% 20% 12% 5% 100% Spain 9% 15% 19% 25% 32% 100% Sweden 3% 5% 16% 32% 44% 100% Switzerland 4% 4% 11% 26% 56% 100% medium Austria 12% 25% 28% 21% 15% 100% Belgium 7% 19% 21% 23% 30% 100% Czechia 32% 27% 26% 13% 2% 100% Denmark 8% 19% 13% 22% 38% 100% France 9% 22% 24% 26% 20% 100% Germany 9% 23% 22% 28% 19% 100% Greece 50% 12% 19% 15% 4% 100% Italy 12% 24% 27% 27% 10% 100% Netherlands 6% 18% 20% 29% 28% 100% Poland 45% 31% 15% 7% 2% 100% Spain 20% 28% 18% 19% 15% 100% Sweden 5% 9% 18% 33% 35% 100% Switzerland 7% 8% 14% 27% 45% 100% low Austria 16% 28% 25% 20% 10% 100% Belgium 16% 28% 22% 18% 16% 100% Czechia 47% 28% 20% 4% 0% 100% Denmark 17% 27% 19% 22% 17% 100% France 17% 36% 22% 17% 8% 100% Germany 24% 30% 21% 16% 9% 100% Greece 66% 12% 16% 5% 1% 100% Italy 30% 28% 26% 12% 4% 100% Netherlands 9% 32% 27% 19% 14% 100% Poland 71% 21% 6% 2% 0% 100% Spain 29% 31% 21% 11% 8% 100% Sweden 9% 16% 25% 28% 22% 100% Switzerland 5% 11% 14% 27% 42% 100% Total 20% 20% 20% 20% 20% 100%
Università degli Studi di Padova – Universiteit Van Tilburg | 33
Education influence is confirmed again from table 3.6. Percentages in the highest percentile (>80°) increase everywhere with the increasing of education level. In general, in the first classes the opposite happens: number of households having low investments tend to have medium or low education.
Age
Graph 3.1 explores the age-participation relation. The profile has a hump shape. The investment tends to grow up till 65 years old, and then it starts decreasing. In correspondence of 97 years old, we find out a peak into the investments, probably due to an outlier. Period between 60 and 80 has the highest value in investment.
34 | Financial ownership in European countries: a multilevel analysis % investors/tot Europeans Percentile 20° (<=61) Percentile 40° (61,66] Percentile 60° (66,73] Percentile 80° (73,81] Tot (>81) Total Austria 1,0% 1,0% 1,0% 1,0% 2,0% 6,0% Belgium 2,0% 2,0% 2,0% 1,0% 2,0% 9,0% Czech Republic 2,0% 2,0% 2,0% 2,0% 1,0% 9,0% Denmark 3,0% 2,0% 2,0% 2,0% 1,0% 10,0% France 2,0% 2,0% 2,0% 2,0% 3,0% 11,0% Germany 2,0% 2,0% 2,0% 1,0% 1,0% 8,0% Greece 0,5% 1,0% 0,0% 0,0% 1,0% 2,5% Italy 1,0% 1,0% 1,0% 1,0% 0,0% 4,0% Netherlands 1,5% 2,0% 2,0% 2,0% 1,0% 8,5% Poland 1,0% 1,0% 1,0% 2,0% 2,0% 7,0% Spain 1,0% 1,0% 0,0% 0,0% 0,0% 2,0% Sweden 2,0% 2,0% 4,0% 4,0% 3,0% 15,0% Switzerland 1,0% 1,0% 1,0% 2,0% 3,0% 8,0% Total 20,0% 20,0% 20,0% 20,0% 20,0% 100,0%
Table 3.7_Proportion of households investing in risky assets, by age percentiles
% investors/total citizens Percentile 20° <=61 Percentile 40° (61,66] Percentile 60° (66,73] Percentile 80° (73,81] Tot >81 Total Austria 14% 35% 28% 20% 3% 100% Belgium 7% 22% 26% 28% 17% 100% Czech Republic 32% 1% 9% 27% 30% 100% Denmark 10% 4% 8% 14% 65% 100% France 12% 30% 26% 25% 7% 100% Germany 10% 24% 28% 30% 8% 100% Greece 59% 18% 18% 5% 0% 100% Italy 25% 28% 31% 13% 3% 100% Netherlands 7% 22% 28% 30% 13% 100% Poland 55% 20% 16% 7% 1% 100% Spain 22% 37% 23% 15% 3% 100% Sweden 16% 2% 4% 14% 63% 100% Switzerland 10% 5% 14% 30% 41% 100% Total 20% 20% 20% 20% 20% 100%
Table 3.8_Proportion of households investing in risky assets, by age percentiles
Tables 3.7 and 3.8 list the distribution of investors in European countries, by age percentiles. In the first one, we see that the majority of investors, defined as those with at least one financial asset (with the exception of bank account), lives in Sweden and France (15% and
Università degli Studi di Padova – Universiteit Van Tilburg | 35
11% respectively), followed by Belgium and the Czech Republic (9%). The countries with the lowest number of investors are Greece and Spain. In Czech Republic, Poland and Greece the majority of investors in risky assets is concentrated in the first age group (less than 61 years old), while in Austria, France and Spain the largest number is between 61 and 66 years. In Italy is between 66 and 73 years, in Belgium, the Netherlands and Germany the population of investors in risky assets is in the age group between 73 and 81 years. For Denmark, Sweden and Switzerland the most important class is that one of over 81 years old.
Graph 3.2 Average net investments amount (logarithm) by age and country
The investment level is rather stable. Greece and Poland present less elevated average investments (around 150 euro). Czech Republic has great investments at the beginning but
36 | Financial ownership in European countries: a multilevel analysis
decreasing during the period. Austria, Spain, Italy and France has a mean of 1000 invested euro: in correspondence of 95 years old, for Italians there is a flexion leading investment to 150 euro. French people instead see an increase of their investments g oing between 1000 to more than 2900 euro during their life. An interesting shape is found out for Austria at 90 years old, while Germany, Sweden, Netherlands, Denmark and Belgium have the highest values of total investments.
Risk preferences
The table shows financial ownership by risk attitude. The variable is coded as: 1- Take substantial financial risks expecting
2- Take above average financial risks expecting 3- Take average financial risks expecting
4- Not willing to take any financial risks
The most of the household is concentrated in the middle of the distribution. They are not totally risk averse and they do not take substantial risks. They prefer to invest with an average level of risk. Considering not risk-averse households, they are usually concentrated on high levels of financial participation, in particular for those ones who are not risk averse. Instead, investments considerably go down when households are average or totally risk averse. By looking at Germany, Denmark, Sweden, Netherlands and Belgium we can observe an high portion of investors preferring elevated risks.
Università degli Studi di Padova – Universiteit Van Tilburg | 37
<20° 20°-40° 40°-60° 60°-80° >80° Total
Not wi l ling to ta ke a ny fi nancial ri sks 18,42% 17,55% 16,14% 13,88% 9,63% 75,61% Ta ke above average financial risks expecting
to ea rn a bove average returns 0,21% 0,29% 0,59% 1,30% 2,75% 5,15% Ta ke average fi nancial ri sks expecting to
ea rn a verage returns 1,15% 2,09% 3,14% 4,65% 7,11% 18,15% Ta ke substantial financial risks expecting to
ea rn s ubstantial returns 0,17% 0,11% 0,13% 0,17% 0,51% 1,09% Tota l 20% 20% 20% 20% 20% 100%
Table 3.9_Proportion of households, by asset investment percentiles and risk preferences
As we can see from table 3.9, the great part of the people prefers not to take any financial risk (76%), but only the 17% of them has a negative or equal to zero investment. Just the 1% of the sample usually takes high average financial risks.
Citizens from Spain, Poland and Austria prefer to take no financial risks, while Denmark, Sweden, Switzerland and Belgium see own citizens investing in risky financial assets.
Not willing to take any financial risks Take above average financial risks expecting to earn above average returns Take average financial risks expecting to earn average returns Take substantial financial risks expecting to earn substantial returns Total Austria 82% 2% 16% 0% 100% Belgium 72% 3% 24% 1% 100% Czechia 70% 2% 27% 0% 100% Denmark 56% 10% 31% 2% 100% France 78% 2% 18% 1% 100% Germany 73% 3% 24% 1% 100% Greece 82% 3% 14% 1% 100% Italy 85% 2% 12% 1% 100% Netherlands 74% 2% 22% 2% 100% Poland 91% 0% 8% 1% 100% Spain 92% 1% 7% 0% 100% Sweden 64% 29% 5% 2% 100% Switzerland 67% 2% 29% 2% 100% Total 76% 5% 18% 1% 100%
38 | Financial ownership in European countries: a multilevel analysis
Gender and marital status
<20° 20°-40° 40°-60° 60°-80° >80° Total Female 23% 22% 21% 18% 16% 100% Not married 24% 23% 21% 18% 15% 100% Married 21% 21% 21% 20% 18% 100% Male 16% 17% 19% 22% 25% 100% Not married 16% 17% 19% 23% 26% 100% Married 17% 18% 19% 22% 24% 100% Total 20% 20% 20% 20% 20% 100%
Table 3.11 Households by sex and marital status
Table 3.11 presents investment amounts by sex and marital status. Married heads are more concentrated in classes of higher investments, especially for men who generally have the highest percentage just after the last percentile. The majority of women however is found to have lower capital investment.
Università degli Studi di Padova – Universiteit Van Tilburg | 39
4. Analysis
4.1 Why using a multilevel structure?
Grouped data arise in almost all areas of statistical application. Sometimes the grouping structure is simple, where each case belongs to single group and there is only one grouping factor. More complex dataset have a hierarchical or nested structure or include longitudinal or spatial elements. All such data share the common feature of correlation of observation within the same group and so analyses that assume independence of observations will inappropriate. The use of random effects is one common and convenient way to model such grouping structure.
Julian Faraway
When the data structure is hierarchical from cluster sampling, the assumption of independent observations is not tenable, and an analysis dealing with the correlations among observations (i.e., multilevel modeling) is required (Raudenbush & Bryk, 2002). A single-level approach ignoring the data dependency in nested data can lead to biased parameter estimates and degraded standard errors.
Our dataset includes 21435 households grouped in 130 European regions (13 countries), resulting from variable nuts2 from the original dataset. Since countries and regions vary with respect to measured private consumption, gross investments, government spending and import/export spending. Households are not isolated units in Europe, but they are socially,
40 | Financial ownership in European countries: a multilevel analysis
culturally and economically influenced by the country where they live. Regardless of the origin of the hierarchy, each group will tend to differentiate themselves from others because: - the behavior of each individual is influenced by the group of belonging;
- the characteristics and peculiarities of the group are influenced by the individuals who compose it. The hierarchical structure in our case is due to the individual's residence in one of the considered European countries.
One of the merits of the multilevel modelling is its ability to treat some variables, like Gross Domestic Product or Human Development Index (country-level indexes), as both characteristic of units and contextual variables in the same analysis.
Since we are interested in the effect of the macro-level variable on the micro-level variable , controlling for the micro-level variables , a multilevel structure is adequate.
We find households nested within countries. If we calculate the Intraclass Correlation, that is a measure of how strongly units in the same group resemble each other defined as the proportion of the total variance explained by the variability between groups , we see how the observations are not independent.
About estimates, one of the most widely used alternatives to OLS is ML (Kleinbaum, 1996) and another one, really closed to ML, is REML. The first one doesn’t take into account the number of parameters used in model estimation, so regression coefficients estimated with small samples may be biased. Instead, REML takes into consideration the number of parameters used in model estimation and, in this way, REML estimators for small samples are less biased. In general, as the number of parameters estimated increases, the difference between ML and REML estimates becomes larger.
Università degli Studi di Padova – Universiteit Van Tilburg | 41
4.2 Does group membership matter?
Significant relationships can exist among group means even if individuals are randomly assigned to groups (Bliese, 2000; Hammond, 1973). Hence, it is important to understand if group membership matters.
One of the most important aspects in group-level analysis is the necessity to determine how much of a variable total variance is due to the groups. This is so important because the variance due to the group-level properties has theoretical implications about underlying group processes. Demonstrating the existence of group agreement is necessary to justify the using of multilevel modeling. To establish agreement, one merely needs to demonstrate that responses from group-members are more similar each other than would be expected by chance (Klein et al., 1994). The term within group agreement refers to the degree to which ratings from individuals are interchangeable; that is, agreement reflects the degree to which raters provide essentially the same rating (Kozlowsky & Hattrup, 1992, Tilsley & Weiss, 1075). ICC1 and ICC2, the two major forms of Intraclass Correlation Coefficients, are calculated from a one-way random effect ANOVA model. Here, the variable of interest is predicted from a group membership factor.
where is the outcome value observed for micro-unit within macro-unit , is the
population grand mean, is the effect of group and is the residual effect for
micro-unit within the group . Hence, group has true mean , and each value of the dependent variable that deviates from the group-mean is given by some values of
. This one is a random variable and it means that values differ each other randomly. It is
42 | Financial ownership in European countries: a multilevel analysis
population between group variance) and the terms have mean 0 and variance (the population within group variance). So, total variance of the dependent variable is ( )
. The number of macro-units is N and the number of micro-units within group is
denoted by .
In general, the Intraclass Correlation Coefficient is the proportion of variance that is accounted for by the group level (Snijders, Bosker, 1999).
The first form of ICC is ICC(1) (Bartko, 1976, James, 1982, McGrow & Wong, 1996). It is defined as the ratio of between group variance and total variance. When group sizes differ each other, it can be used the Blalock’s formula (1972):
( ) ( )
The second form of Intraclass Correlation Coefficient is ICC(2). It refers to reliability of the group means.
( )
In the next chapter, we try to establish if the two-level structure of data is necessary when applied into the model and if the within agreement of units may be considered non-random.
Università degli Studi di Padova – Universiteit Van Tilburg | 43
4.3 Random Group Resampling
There are some methods to test if membership group matters. One of the most popular is Random Group Resampling (RGR), from Bliese and Halverson (2002). In few words, it compares multilevel results based on actual group membership to multilevel results based on pseudo-group membership. It tests whether results using aggregate-level variables from actual groups differ from results using aggregate-level variables created from randomly formed groups. In regression analyses, it is fairly easy to determine whether or not group membership matters by contrasting within-group and between-group correlations and regression coefficients.
RGR is a versatile resampling procedure similar to the permutation test proposed by Fisher in 1930 and related to the bootstrap and jackknife approaches (Efron & Tibshirani, 1993). The permutation test evaluates whether two samples come from the same population. If two samples belong to the same population, it has to be that the group-mean differences between the two pseudo-groups should equal the group-mean differences between the two real groups. Pseudo-groups are created by sorting the observations from the lowest to the highest and then randomly selecting and assigning n1 observations to the first group and n2 observations to the second one (where equals to the number of observations in the group). The comparison between the group-mean differences from the actual groups and the group-mean differences from the pseudo-groups allows to estimate the probability that the observed group means from the actual groups come from a single population.
RGR creates as many pseudo-groups as there are actual groups, to test if agreement in pseudo groups is different from the one in real groups. When group-level results from actual groups significantly differ from pseudo-group results, group effects are identified as being present and group membership is considered important to the interpretation of the data (Bliese and Halverson, 2002).
44 | Financial ownership in European countries: a multilevel analysis
RGR is a procedure to assess within-group agreement in multilevel data. The aim of the RGR procedure is to determine a null distribution of random response when the data comprise a collection of groups, with raters being nested within groups. The distribution of these pseudo groups’ variances is then used to determine the expected random variance (Lüdtke and Robitzsch, 2008). A powerful R function is the rgr.agree. It uses RGR to create pseudo groups and calculate pseudo group variances. The rgr.agree algorithm creates pseudo groups that are identical in size characteristics to the actual groups. Table 4.3 and 4.4 provide the standard deviations, variance estimates and the estimate of the z-value if group are regions (table 4.1) and countries (table 4.2).
Summary Statistics for Random and Real Groups ( if groups = regions)
# Random Groups Avg Random Group Variance
SD Random Group Variance
Avg Real Group
Variance Z-value
960 48.8 14.3 39.0 -8.6
Table 4.1 Summary of RGR function, with groups are regions.
Summary Statistics for Random and Real Groups (if groups = countries) # Random Groups Avg Random
Group Variance
SD Random Group Variance
Avg Real Group
Variance Z-value
1001 48.3 2.3 42.5 -9.2
Table 4.2 Summary of RGR function, with groups are countries.
From the first section of the outcome, we can see statistics that allow us to contrast within-group variances from actual within-group with within-within-group variances from pseudo within-groups. The z-value for both the outputs tells us that the within-group variances from actual groups were significantly smaller than the within-group variances from the random groups. For regions, the average within-group variance for random groups is 48.8, with standard deviations of 14.3. For countries the average within-group variance for random groups is similar to that obtained for regions (48.3), but standard deviations are much smaller (2.3). The average within-group variance in actual groups are smaller, 39 for regions and 42.5 for countries.
Università degli Studi di Padova – Universiteit Van Tilburg | 45
By using the quantile statistics on pseudo groups variance, we can understand how many groups display agreement or not. For regions, the test establishes that variance has to be within the confidence interval of (39.8, 61.6). It must be smaller than 39.8, that it is in the lowest 10% of all pseudo groups variances. In this way, we can say that groups with variance lower than 35.8 have, according to this criteria, a strong agreement, because they are different from pseudo groups. One hundred and five of the total number of groups (131) meet this criteria.
In the same way, we can estimate the variance in order that it should considered ‘large’ compared to pseudo groups.
A variance equal or larger than 61.6 is too big compared to pseudo groups standards. By using this criteria, we find that 20 regions with an apparent lack of agreement. They are:
DK009 Sonderjyllands amt 62.4409404 CZ08 Moravskoslezsko/Moravian-Silesian 62.5104440 DK005 Vestsjaellands amt 63.9667206 CZ01 Praha/Prague 64.3836864 DK004 Roskilde amt 66.4807670 CZ04 Severozapad/Nothwest 64717231 ITF5 Basilicata 68.4032141 CH07 Ticino 70.0466240 DK00B Vejle amt 72.2765977
SE02 Oestra Mellansverige 76.1237312 DK00F Nordjyllands amt 80.4047472 SE09 Smaland med oearna 86.8310331 CH01 Iemanique 88.7259496
SE0A Vaestsverige 89.3599440 SE04 Sydsverige 92.0256950
SE06 Norra Mellansverige 102.1601403 DK006 Storstroms amt 110.1516969 SE07 Mellersta Norrland 111.1899427 ES63 Ciudad Autónoma de Ceuta135.2090227 SE08 Oevre Norrland 137.4701411
46 | Financial ownership in European countries: a multilevel analysis
The first expression indicates the code used in the SHARE dataset to refer a determined region, the second reports the name of the same and into parenthesis we can find the corresponding within-group variance.
Three are regions staying in Czech Republic. There are seven regions in Sweden, two in Switzerland, six in Denmark, one in Spain and one in Italy. This kind of analysis suggests that using a two-level structure for our data is a correct way to proceed. Similar results are obtained for countries.
Anyway, we must consider that a high value of ICC(1) can be due to one or two highly anomalous groups rather than indicating generally shared group properties among the entire sample (Bliese, 2012). To see if this happens in our sample, we use an approach which compares observed group means with group means resulting from a randomly assigning of individuals to pseudo groups.
Graph 4.1 Groups sorted from highest to lowest
Università degli Studi di Padova – Universiteit Van Tilburg | 47
The bar chart in graph 4.1 represents each groups’ average rating of logarithm of net amount of financial assets value sorted from highest to lowest. The line represents a random distribution of random groups, that is the expected distribution if there were no group-level effects associated with these data. The dotted lines represent the upper and lower 95% confidence bootstrap interval estimates.
Because there are no one or two groups which are clearly different from the pseudo-group distribution, we can say that ICC(1) value does not seem to be caused by one or two aberrant groups.