Pr
eliminary
Tbermobydraulics
Design of tbe LORELEI
Device with CATHARE
Descrittori
Tipologia del documento: Collocazione contrattuale:
Rapporto Tecnico
Accordo di programma ENEA-MSE:
tema diricerca "Nuovo nucleare da fissione"
Reattori nucleari ad acqua, Reattori esistemi innovativi, Termoidraulica dei reattori nucleari
Argomenti trattati:
Sommario
This report has been issued within the framework ofthe PAR2008-09 research program ofthe ENEA-MSE
agreement and it is one of the deliverables of the task E "Sviluppo e validazione codici di calcolo" of the work program LP2 "Reattori evolutivi".
Inthe Jules Horowitz Reactor (JHR) experimental facilities are foreseen, including the Light water One
Rod Equipment for LOCA Experimental Investigations (LORELEI) device, which is dedicated to Loss Of
Coolant Accident (LOCA) transient studies ona single fuel rodo
In this work the thermal-hydraulic design of the LORELEI facility was developed with the code
CATHARE. The objective of the work was: to define a 3D geometry of the facility; to verify the capacity
of the system, under natural circulation, to remove the power generated bythe fuel rod (up to 400 W/cm)
and thepower generated bygamma irradiation heating on the device materials. The study consisted of three main steps: definition of a 3D geometry of the facility, definition of a numerica Imodel, development of
thermo-hydraulic calculations.
Note
This work was developed with CEA - Cadarache Research Center.
Copia n. In carico a: NOME 2 FIRMA OME 1 FIRMA
Francesco Saverio Nitti Paride Meloni Paride Meloni
NOME
EMISSIONE
1
2/
0
9j
è
Jf
/
o
FIRMA
INDEX
1. INTRODUCTION ... 5
2. OBJECTIVES ... 6
3. THE GEOMETRY OF THE FACILITY ... 7
4. THE NUMERICAL MODEL ... 10
5. THE THERMO-HYDRAULIC CALCULATIONS... 10
5.1 NATURAL CIRCULATION PHASE ... 12
5.1.1 PRELYMINARY ANALYSIS: THERMAL POWER IN FUEL ROD ... 12
5.1.2 ANALYTICAL APPROACH ... 14
5.1.3 SUBSEQUENCE DEVELOPMENT OF CALCULATION... 19
5.1.4 THERMAL POWER DUE TO GAMMA HEATING ... 26
6. APPENDIX A ... 32
7. APPENDIX B ... 35
8. REFERENCES ... 38
FIGURES INDEX
Figure 1 Schematic representation of device, displacement system and its position in the core
shield ... 6
Figure 2 Schematic two-dimensional drawing and materials ... 7
Figure 3 Axonometric views of device ... 8
Figure 4 Axial and cross section of device ... 9
Figure 5 Nodalization of device ... 11
Figure 6 Void fraction distribution with a power of 300W/cm ... 13
Figure 7 Normalized GHTC as a function of Normalized geometrical parameters ... 17
Figure 8 Normalized GHTC as a function of Normalized geometrical parameters. ... 17
Figure 9 Temperature behaviour for the geometries G0, G1, G2, G3 ... 18
Figure 10 Void fraction behaviour for the geometries G0, G1, G2, G3 ... 19
Figure 11 Temperature distribution at linear power of 400 W/cm ... 21
Figure 12 Temperature behaviour for the geometries G4, G5 ... 22
Figure 13 Void fraction behaviour for the geometries G4, G5 ... 22
Figure 14 Temperature distribution on the fuel rod for the geometries G4, G5. ... 23
Figure 15 Nucleate Boiling heat flux and Total flux on fuel rod ... 23
Figure 16 DNBR behaviour for the geometries G0, G1, G2, G3 ... 25
Figure 17 DNBR behaviour for the geometries G4, G5 ... 25
Figure 18 Neutron flux distribution, [4] ... 26
Figure 19 Thermal power due to gamma irradiation ... 27
Figure 20 Temperature behaviour at different power, case G5 ... 28
Figure 21 DNBR behaviour at different power, case G5. ... 29
Figure 22 Power exchanged through hot and cold channel and power discharge in the surrounding, ... 30
Figure 23 Temperature distribution with thermal-power on the rod and gamma-power on structures, related to the final geometry ... 31
TABLES INDEX Table 1 Data of main cases analyzed ... 12
Table 2 Average physical parameter in the cold-channel above the rod, ... 16
Table 3 Interpolation equations of curves in fig.8 ... 18
Table 4 Geometrical parameters and normalized values ... 20
Table 5 Correction coefficient and maximum gamma power in the materials, [5] ... 27
NOMENCLATURE Cp specific heat [J/kg*K] Dh hydraulic diameter [m] g gravity acceleration [m/s2] Gr numero di Grashof h convective coefficient [W/m2 K] k conductive coefficient [W/mK] L length [m] Pr numero di Prandtl Q heat flux [W/m2] r radius [m] T temperature [°C] Tw walltemperature [°C] α void fraction
β thermal expansion coefficient [1/°C]
ρ density [kg/m3]
1. INTRODUCTION
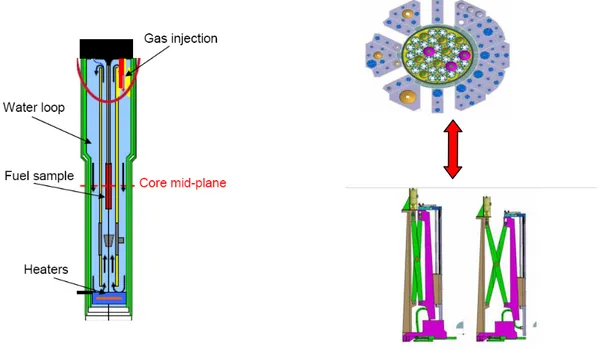
In the Jules Horowitz Reactor (JHR) experimental facilities are foreseen, including the Light water One Rod Equipment for LOCA Experimental Investigations (LORELEI) device, which is dedicated to Loss Of Coolant Accident (LOCA) transient studies on a single fuel rod. The objective of the test device is to evaluate the thermomechanical properties and radiological consequences of LOCA phenomena on a LWR fuel rod.
The system will offer representative conditions to investigate the following phenomena: • Ballooning and burst of the cladding
• Corrosion phase at high temperature (oxidation and hydration) • Quenching of the cladding
• Post-quench behaviour of the fuel rod.
The test device will be installed on a displacement system in the core reflector. This arrangement facilitates simple control of fuel rod power by modifying the position of the device from the core. Furthermore, in the case of an accident, this displacement system can ensure safety.
The main operating conditions consist of, [1]:
• Re-irradiation Phase: Before the LOCA transient, the test device is operated as a capsule at below saturation temperature (330,85 °C), in natural circulation, at 13 MPa . These re-irradiation conditions of the fuel sample in the test device create a representative fission product (FP) inventory for radiological purposes or for fuel microstructure studies. The cladding temperature is expected to be similar to PWR temperature ranges.
• Dry-out Phase: The dry-out phase is simulated by a gas injection that allows the emptying of test device to a low pressure value. A small amount of water will remain at the bottom of the device to generate a steam atmosphere during the heat-up phase. The steam will be generated by an electrical heater in the bottom of device.
• Heat-up Phase: The heat-up phase will occur at a rate of 10 to 20°C/s and will be monitored by tuning the power in the fuel. To avoid azimuthal temperature discrepancies, an electrical heating shell will be implemented surrounding the fuel to compensate for azimuthal differences in thermal insulation and thermal inertia. Heating will be stopped at a high temperature in order to increase the apparent heat-losses of the rod and therefore avoid the steam-zircalloy thermal escalation.
For the power distribution, a neutron screen will be installed to flatten the axial power profile and to reduce, if necessary, the radial profile.
• Quenching Phase: The quenching phase will be simulated by a water injection at the bottom of the test device. It is possible to operate in the long term (several hours or days) at low power which will allow the investigation of post-quench fuel behaviour. Sampling lines are foreseen to analyse FP activities during the post-quench phase. The initial internal rod pressure is a test parameter that can be adjusted, depending on the expected ballooning and burst conditions.
In fig.1 schematic representation of the device, displacement system and its position in the reflector is displayed.
Figure 1 Schematic representation of device, displacement system and its position in the core shield
2. OBJECTIVES
In this work the thermalhydraulic design of the LORELEI facility was developed with the code CATHARE. The objective of the work was:
• to define a 3D geometry of the facility
• to verify the capacity of the system, under natural circulation, to remove the power generated by the fuel rod ( up to 400 W/cm) and the power generated by gamma irradiation heating on the device materials
The study consisted of three main steps:
• definition of a 3D geometry of the facility • definition of a numerical model
Inox 316
Helium
Hafnium
Incon 718
Porous Zirconia
Water
Zirconia
Zircalloy
Fuel
3. THE GEOMETRY OF THE FACILITY
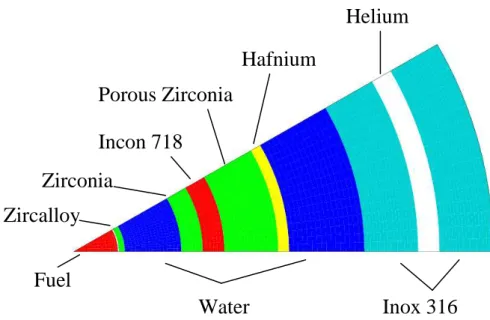
In normal operating conditions the LORELEI device operates with pressurized water in natural circulation, moving the generated nuclear thermal power from a hot to a cold well. Essentially the system is composed of two concentric cylinders with the internal cylinder containing the fuel rod (the hot well) and the external cylinder in contact with a pool (the cold well). The annular chamber between the rod and the internal cylinder is the hot channel, where the heat is removed from the rod, the annular chamber between the two cylinders is the cold channel, where the heat is transmitted to the external pool. However in reality, the system will be composed of cylindrical layers of different materials, which meet different needs in the normal and safety operating conditions. With reference to the schematic cross section of the device displayed in the fig.2, following the description of utilized materials:
• Zircalloy : utilized for the cladding of the fuel rod; • Zirconia: utilized as a structural material
• Incon 718: utilized as the basic material for the electrical heater. The heater is implemented to compensate azimuthal differences in thermal insulation and thermal inertia, in order to avoid azimuthal temperature discrepancies;
• Porous Zirconia: utilized as a thermal insulation screen between the hot and cold channel
• Hafnium: utilized as a neutron screen installed to flatten the axial power profile and to reduce, if necessary, the radial profile;
• Inox 316: utilized for the external cylinder, which is composed of two cylinders separated by a gas gap. The internal is the first containment wall of the device and the external is the second containment wall for safety purposes. Inox 316 is also used for the water discharge pipe which will simulate the break in LOCA phenomena.
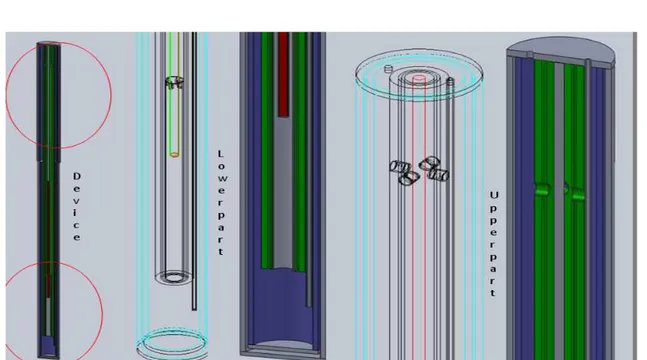
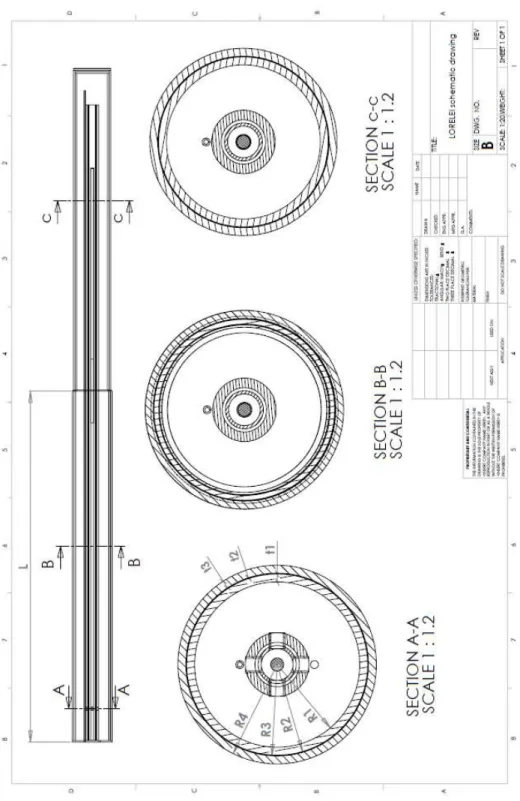
The geometry defined in the fig.2, supplied by JHR team, was utilized as a starting point to build a 3D geometry of the facility. In fig.3 and 4 the axial section, cross section and axonometric views are displayed. The connection between the hot and cold channel consist of 4 holes located on a plane and separated 90° from each other.
The drawings were created with SOLID-WORKS software.
4. THE NUMERICAL MODEL
The numerical calculations were performed with CATHARE 2 V2.5_2, a two-phase thermohydraulic code with a 2-fluids and 6-equations model. The code resolves three equations per phase: energy, mass and momentum with six principal variables: pressure, enthalpy of liquid and gas, velocity of liquid and gas, void fraction, [2].
The input data required for these calculations were: • Geometries
• material physical properties (Appendix A) • local pressure drop coefficients (Appendix B) • boundary conditions.
Fig.5 displays the discretized model of the system, features include:
• the hot channel (HOTCHAN), upward annular water channel along the fuel rod • the cold channel (COLCHAN), downward annular water channel in contact with the
cold well
• a connection duct (CONHC) to simulate the connection holes between the hot and cold
• channels at the top of device
• the water discharge channel (WATDIS), to simulate the break in the LOCA phenomena
• the lower plenum (LOWPLEN), a volume at the bottom of the device to connect the hot and cold channels.
Typical calculation parameters used were: • number of meshes: 474
• meshes length: from 1mm to 10 mm
• boundary conditions: pressure 13 MPa, temperature 50 °C on the external wall of device.
Different geometries of the device with different number and length of meshes was studied. The above values are referred to the geometry of the case G5. Some calculations were performed with a double number of meshes to verify the grid independence of results. The variation of calculated physical parameters is negligible, order of variation 0,02 %.
5. THE THERMO-HYDRAULIC CALCULATIONS
There are three main thermohydraulic operational conditions of the device:
• the re-irradiation phase, in which the power generated will be removed in natural circulation conditions
• the dry-out phase, in which the system will be emptied with a gas injection • the quenching phase, in which the system will be re-flooded with water.
The thermohydraulic calculations were performed for all three operating conditions.
5.1 NATURAL CIRCULATION PHASE
The system must operate under natural circulation, moving the thermal power, both produced by fission in the fuel rod and generated by gamma irradiation in the structures, from the device to a cold well of water surrounding the system.
The required operating conditions for this phase are: • fluid temperature below the saturation value
• cladding temperature above the saturation value, to guarantee nucleation conditions at the wall
• sufficient margin for the Critical Heat Flux (CHF).
Different geometries were analyzed modifying the three parameters: r1, L, t2, as displayed in
fig. 4. In tab.1 the data of main cases analyzed are displayed.In order to evaluate the impact of the two heat sources the calculation was developed in two steps: the first taking in account only the fission thermal power generated in the rod, the second considering also the thermal power produced by the gamma-heating in the structures.
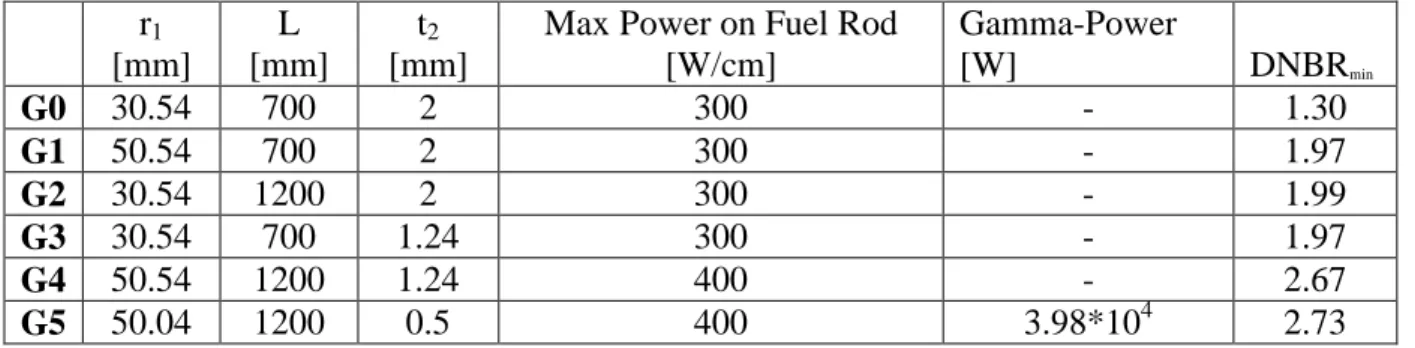
r1 [mm] L [mm] t2 [mm]
Max Power on Fuel Rod [W/cm] Gamma-Power [W] DNBRmin G0 30.54 700 2 300 - 1.30 G1 50.54 700 2 300 - 1.97 G2 30.54 1200 2 300 - 1.99 G3 30.54 700 1.24 300 - 1.97 G4 50.54 1200 1.24 400 - 2.67 G5 50.04 1200 0.5 400 3.98*104 2.73
Table 1 Data of main cases analyzed
PRELYMINARY ANALYSIS: THERMAL POWER IN FUEL ROD
The first calculation is related to the initial geometry, case G0. The power generated in the rod can vary from 100 W/cm to 400 W/cm. The code CATHARE cannot directly perform a calculation in natural circulation conditions starting with a null velocity field, thus the calculation was started in forced circulation conditions defining: a mass flow at the inlet of the cold channel and a pressure at the exit of the hot channel and the water discharge channel. When the forced circulation field reaches a stable condition, the mass flow is cut-off and natural circulation is developed, with the defined pressure boundary conditions. The simulation showed that the system operates with the max flow temperature below the saturation value only with a generated power less than 100 W/cm. With a bigger power, a large quantity of steam is generated in the device and this does not guarantee continuous and efficient natural circulation. In fig. 6 the void fraction distribution for a rod with linear power of 300 W/cm is displayed. The calculation showed that the system is able to remove the
thermal power from the hot well, however a lot of steam is accumulated in the upper part of the cold channel. The maximum temperature on the clad was 335.8°C.
Figure 6 Void fraction distribution with a power of 300W/cm
Evidently it is necessary to increase the heat exchanged with the cold well to reduce the steam production in the device.
The heat exchanged between the cold channel and the surrounding depends on the motion field, geometrical characteristics of the external walls and the surrounding conditions. The surrounding conditions are fixed and the motion field, at fixed power supply, depends on geometrical characteristics of the walls. Therefore a parametric calculation, to analyze the behaviour of the device with variation of geometry, was performed. Keeping constant the geometry of internal cylinder of device, the heat exchange with surrounding is correlated to the geometry of the external cylinder, fig 4: internal and external radius of first wall (r1, r2),
internal and external radius of second wall (r3, r4) , gas gap between the walls t2 and device
length L. In order to evaluate which parameters should be varied and the magnitude of the variation, an analytical approach with an approximate correlation between the heat exchange and geometrical parameters was developed.
5.1.2 ANALYTICAL APPROACH
The external wall of the device is composed of two concentric cylinders with a gas gap, however, due to the small width, the convection circulation is not taken into account and the gas gap is considered as a conductive material. The heat transfer is convective outside the wall and conductive inside the three layers of the wall. The heat flux between the fluid and wall and through each layer in the wall, can be evaluated with the following equations, fig.4:
( ) 1 2 1 2 ln 2 r r T T Lk Qa=− π a − (1) ( ) 2 3 2 3 ln 2 r r T T Lk Qb=− π b − (2) ( ) 3 4 3 4 ln 2 r r T T Lk Qc=− π c − (3) ( 1) 1 2 Lrh T T Qfi= π i i− (4) ( e) e fe Lrh T T Q =2π 4 4− (5)
Arranging these correlations, it is possible to have an expression of heat flux as a function of geometric parameters of conductive and convective coefficients and of temperatures of fluids on both side of the wall:
(
i e)
c b a e i e i e i T T r r k r r k r r k h h r r h r h r h h r Lr Q − + + + + = 3 4 2 3 1 2 4 1 4 1 4 1 ln 1 ln 1 ln 1 2π (6)The convective coefficient can be expressed as a function of non-dimensional parameters. In literature several correlations are reported. In the operating conditions of the device, a laminar flow in natural circulation is assumed, and the convective coefficient is evaluated by the following correlation, [3]:
( ) (
)
1/4 Pr 55 , 0 l l hl l l h Gr D k h = α (7)with l w l hl l l l T T D g Gr = − 2 3 2 µ ρ β l l l l k Cp µ = Pr P l l l l T ∂ ∂ − = ρ ρ β 1 ( c) h hl D R D = 1− ⋅ ⋅ − = −5 −3 10 3 , 10 2 , 1 1 h c D Max Min R α h( ) (α = 1−α)/
( )
1−Rc2The CATHARE code utilises a different approach. The convective coefficient of different flow regimes (laminar, turbulent, natural convection, etc.) is evaluated in each mesh by means of correlations and then the maximum value is chosen.
The Global Heat Transfer Coefficient (GHTC) in equation (6) is related to geometrical parameters, and with some simplified hypotheses, it is possible to evaluate its variation with the variation of geometrical parameters.
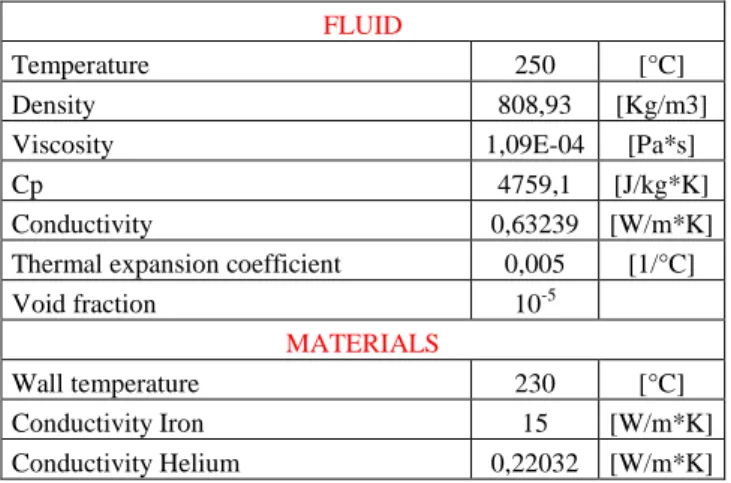
The CATHARE calculation showed a stable operating condition of the device without steam production, with a linear heat power in the fuel rod less than 100 W/cm. Starting with this stable operating condition, a study was performed to obtain an appropriate global heat transfer coefficient, modifying only the physical dimensions of the device, with the goal of obtaining the same stable conditions of the 100 W/cm case with a bigger linear power supplied. Utilizing the results of the calculation obtained with a power of 100 W/cm, average values for temperatures, density, viscosity, specific heat, conductivity and thermal expansion coefficient, in the cold channel above the rod, were assumed (see tab 2). Assuming that these average physical parameters remain constant, it is possible to calculate the change in the GHTC with the variation of the geometric parameters:
+ + + + = 3 4 2 3 1 2 4 1 4 1 4 1 ln 1 ln 1 ln 1 2 r r k r r k r r k h h r r h r h r h h r Lr k c b a e i e i e i tot π (8)
FLUID
Temperature 250 [°C]
Density 808,93 [Kg/m3]
Viscosity 1,09E-04 [Pa*s]
Cp 4759,1 [J/kg*K]
Conductivity 0,63239 [W/m*K]
Thermal expansion coefficient 0,005 [1/°C]
Void fraction 10-5
MATERIALS
Wall temperature 230 [°C]
Conductivity Iron 15 [W/m*K]
Conductivity Helium 0,22032 [W/m*K]
Table 2 Average physical parameter in the cold-channel above the rod, as resulted from calculation with linear power of 100 W/cm
Fig.7 displays the variation of GHTC with the variation of internal radius r1, length L,
thickness of first wall t1, gap between walls t2, thickness of second wall t3. These dimensions
are displayed in fig. 4. The values on the Cartesian axes are normalized to the initial reference values, tab.1, 2 and drawings in appendix C:
k*=k/ k int ; r1*=r1 / r1 int ; L*=L/ L int ; t1*=t1 / t1 int ; t2*=t2 / t2 int ; t3*=t3 / t3 int . (9)
The curves show the percentage increase of heat flux removable from the device, keeping constant the physical condition of the fluid and varying each geometrical parameter one by one. Predictably the gas gap t2 has a large impact on the variation of GHTC, due to the low
conductivity of the gas, while t1 and t3 have a low impact. To verify the reliability of these
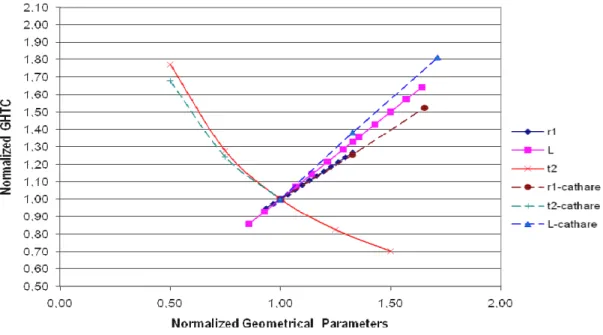
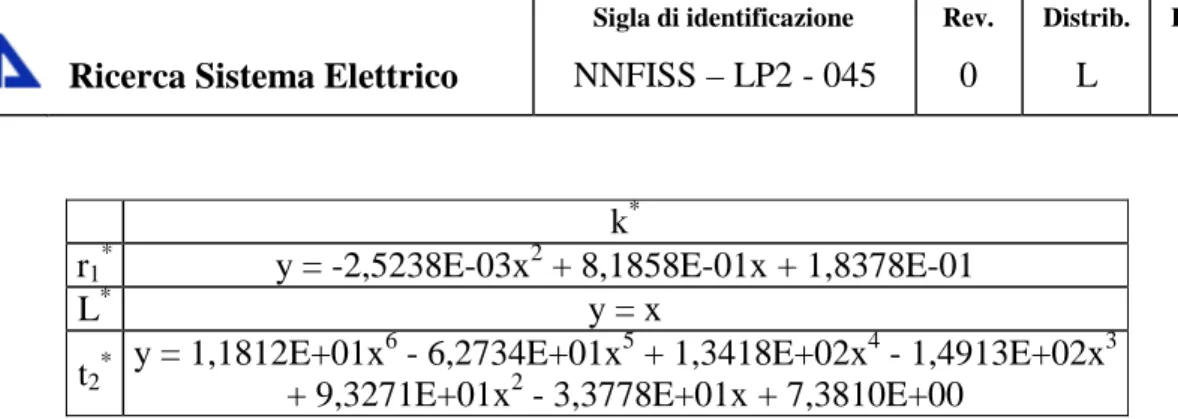
graphs, further CATHARE calculations with different geometries, obtained modifying the three parameters, were performed. In fig.8 the comparison between the variation of normalized GHTCs calculated by the correlation (8) and those obtained from the code calculation is displayed. Code calculation of heat exchange due to L variation is bigger than that calculated by the correlation because the code also evaluated the increase of driving force with increasing of length. In tab.3 the interpolation equations of curves in fig.8 are displayed.
Figure 7 Normalized GHTC as a function of Normalized geometrical parameters
Figure 8 Normalized GHTC as a function of Normalized geometrical parameters.
k*
r1* y = -2,5238E-03x2 + 8,1858E-01x + 1,8378E-01
L* y = x
t2*
y = 1,1812E+01x6 - 6,2734E+01x5 + 1,3418E+02x4 - 1,4913E+02x3 + 9,3271E+01x2 - 3,3778E+01x + 7,3810E+00
Table 3 Interpolation equations of curves in fig.8
Fluid temperature and void fraction behaviour related to the calculation of some different geometries, tab. 1, in fig.9 and 10 are displayed. Observing the curves in comparison to case G0-300, some considerations is possible to underline. In both cases G1 and G3, a reduction of average temperatures along the system and a reduction of steam production in the colchan1 is showed. Case G2 shows an increase of average temperature in the system (about 10 °C) and an increase of steam production in the colchan1. The variation of length, case G2, does not substantially modified the physics of the heat exchange. The increase of length creates a raise of the driving force and thus velocities and pressure drops. Instead the variation of the other two geometrical parameters acts directly on the physical parameters (Grashof) modifying both the amount of heat exchanged and the physical state condition throughout the system.
Figure 10 Void fraction behaviour for the geometries G0, G1, G2, G3
SUBSEQUENCE DEVELOPMENT OF CALCULATION
The maximum power that the system should nominally be able to handle is 400 W/cm , four times the initial reference value of 100W/cm. Observing the diagrams in fig.8, the single variation of a geometrical parameter is not enough to guarantee an increased of heat transfer by a factor of four. Therefore a combined variation is necessary.
The curves in fig.8 display the change in GHTC by variation of single parameters, the effect of a combined variation can be evaluated with the hypothesis of principle of superposition of effects and the variation of GHTC can be evaluated by means the correlation:
* * * * 2 1 L t rk k k k = (10)
The GHTC has been expressed as a function of three geometrical variables, thus ∞3 solutions are possible. The choice must be driven in direction of maximization of the heat exchanged, keeping the system simple, compact and easy manufacture. However the geometrical parameter variation is limited by the space available for the facility (max length 2200 mm and max external diameter 129 mm were assumed in this study), and moreover the gas gap reduction must be limited, to minimize the mechanical problems in the device assembly. Therefore, assuming the maximum values possible for length L and internal radius r1, the gas
gap thickness was calculated. Fixed L and r1,from (9) the normalized value were calculated,
coefficients:kr*1 , k*L were determined. Knowing the GHTC required, from (9) the normalized
value was calculated and from (10) the normalized heat transfer coefficients k and thus, t*2 from the diagram, the gas gap normalized thickness t2* , and then t2. In tab.4 the calculated
values are reported.
Geometrical Parameters r1 L t2 Reference values [mm] 30.54 700 2 Actual values [mm] 50.54 1200 1.24 Normalized values 1.65 1.71 0.62 Normalized GHTC 1.54 1.71 1.52 Total Normalized GHTC 4
Table 4 Geometrical parameters and normalized values
The calculation with the new geometric parameters, case G4, showed good thermohydraulic behaviour of the system up to 400 W/cm, without a significant amount of steam production. In fig. 11, 12 and 13 the temperature distribution and void fraction behaviour in the fluid are displayed. The diagram in fig.13 show a small quantity of steam in the hot-channel along the rod, thus nucleation phenomena appear in the fluid. This is also underlined from the distribution of temperature on the fuel rod that is over the saturation temperature of the fluid, fig.14, and the non zero value of the heat flux that generates nucleation, fig. 15. The convective flux is the difference between the total flux and nucleate flux.
Figure 12 Temperature behaviour for the geometries G4, G5
Figure 14 Temperature distribution on the fuel rod for the geometries G4, G5.
Figure 15 Nucleate Boiling heat flux and Total flux on fuel rod
Fluid temperature below the saturation value is a necessary but not sufficient criterion to guarantee the safe operation of the system. An important parameter that must be satisfied is the Critical Heat Flux (CHF): a heat flux from a wall to the fluid which generates a sudden
local evaporation of fluid resulting in a dangerous local superheating of the wall. The CHF is function of field of motion along the wall, in literature several correlations are reported. The code utilizes the following correlation, [3]:
(
, ,)
3 10 3 2 1⋅ ⋅ ⋅ + = FGP X cr F F F q (11) With 3 / 1 3 1 ,0.79 10 8 ⋅ = − h D Max F geometry value bundle dard s F = tan 6 . 0 1 2(
)
9 . 0 9 . 0 1 10 1 3 ≥ < − = X X if if X F(
)
(
)
l g l g x X ρ α αρ ρ α αρ − + − + = 1 1( )
( )
P H( )
P H P H H x lsat vsat lsat l − − = G=Gg +Gl =αρgVg +(
1−α)
ρlVl F is an interpolation function of the GROENEVELD table.The ratio between the CHF and the total heat flux on a wall, Departure from Nucleate Boiling Ratio (DNBR), is used to evaluate the risk conditions. Fig. 16 display the DNBR on the fuel
rod in the three cases G1, G2 and G3, compared to the case G0. The diagram shows that the margin between the CHF and the total flux is reduced along the rod, moreover the worst behaviour is in the case G2, to confirm the low influence of increased of length on the field of motion. The lowest value of margin from the CHF is equal to two, and the utilized correlation has an uncertainty of about 30%, consequently in these operative conditions the margin is sufficiently good. Fig. 17 display the DNBR on the fuel rod in the case G4, the margin of the CHF is 2.66 on the entire rod.
Figure 16 DNBR behaviour for the geometries G0, G1, G2, G3
5.1.4 THERMAL POWER DUE TO GAMMA HEATING
The thermal power generated in the structure of device due to the gamma irradiation constitutes a significant quantity of heat to the system. The amount of gamma-power and its linear distribution was evaluated considering the neutron flux distribution coming from the reactor core, fig. 18. With the hypothesis that the gamma distribution matches the neutron flux distribution, the specific thermal power distribution for each material of the structures of device is evaluated, fig.19. In tab.5 the multiplicative coefficients used to evaluate the maximum gamma heating in materials different from graphite are displayed. The power distribution is centered at the middle of fuel rod and it extends of 200 mm above and below of the rod.
COEUR RJH 70 MW
34 éléments - U3Si2 27% U235 - Cœur neuf sans écrans Flux neutronique axial centre coeur
-50.0 -40.0 -30.0 -20.0 -10.0 0.0 10.0 20.0 30.0 40.0 50.0 0.0 1.0 2.0 3.0 4.0 5.0 6.0 7.0 8.0 9.0 10.0 11.0 12.0 13.0 14.0 15.0
Flux neutronique (1.E+14 n/cm2/s)
H a u te u r / p la n m é d ia n c œ u r (c m ) thermique <0.625 eV épithermique 0.625 eV < < 0.907 MeV rapide > 0.907 MeV
Figure 19 Thermal power due to gamma irradiation Variation of specific power Gmaterial / Ggraphite Maximum Gamma Power [W/g] Density [Kg/m3] Maximum Gamma Power [W/m3] GRAPHITE 1 2,5 IRON 1,12 2,8 8000 2,2400E+07 ZIRCONIA 1,23 3,075 5035,8 1,5485E+07
POROUS ZIRCONIA 1,23 3,075 480 1,4760E+06
HAFNIUM 1,73 4,325 13,31 5,7566E+04
Table 5 Correction coefficient and maximum gamma power in the materials, [5]
The thermo-hydraulic calculation in the case G4, considering both the thermal-power in the rod and the gamma-power in the structures, showed a flow field with the presence of steam in the top part of cold channel. The total heat power due to gamma irradiation resulted of about 3.98*104 W distributed on a length of 1 m, therefore it is a linear power distribution of the same order of magnitude of linear power in the rod. Hence it is necessary to change once more the geometry of the device, case G5. The total power, in fuel rod and in structures, is eight times to that of the initial reference geometry; adopting the same procedure presented in the previous paragraph the appropriate gas gap thickness was evaluated. The gas gap reduction was obtained by increasing the internal radius of the wall. The geometrical data variations are reported in tab. 6.
Geometrical Parameters r1 L t2 Reference values [mm] 30.54 700 2 Actual values [mm] 50.54 1200 0.5 Normalized values 1.65 1.71 0.25 Normalized GHTC 1.54 1.71 3.0 Total Normalized GHTC 8
Table 6 Geometrical parameters and normalized values related to the final geometry, G5
In fig. 12, 13, 14 and 17 the temperature distribution in the fluid, the void fraction, the temperature distribution along the fuel rod and the DNBR are displayed.
Fig. 20 and 21 show the fluid temperature and DNBRbehaviour in the case G5 in relation to different linear powers in the fuel rod and with gamma-heating only on the external walls.
Figure 21 DNBR behaviour at different power, case G5.
Fig.22 displays the heat fluxes through the hot and cold channel, and the heat fluxes between cold channel and external surrounding. The amount of heat flux discharged in the surrounding is about three orders of magnitude to that exchanged between the hot and cold channels. Therefore the wall between the two channels provides sufficient isolation to guarantees an appropriate driving force.
Figure 22 Power exchanged through hot and cold channel and power discharge in the surrounding, on the three sections of the device, case G5
Figure 23 Temperature distribution with thermal-power on the rod and gamma-power on structures, related to the final geometry
6. APPENDIX A
In the CATHARE code a library of materials is available. In case of use of different materials the physical property must be supplied by the user in the file FWMAXX.f. In the present work the following values were used to define the physical properties, the intermediate values were calculated with a linear interpolation:
FUEL, [6] T [ °C ] Cp [ J / kg K ] λ [ W/ m K ] ρ[Kg/ m3 ] 0 240 5,96 10520,0 100 257 5,49 10500,0 200 277 5,05 10480,0 300 292 4,64 10455,0 400 302 4,27 10427,0 500 310 3,92 10398,0 600 314 3,61 10367,0 700 318 3,33 10334,0 800 320 3,08 10300,0 900 321 2,86 10264,0 1000 322 2,67 10227,0 1100 324 2,51 10188,0 1200 326 2,39 10147,0 1300 330 2,3 10105,0 1400 335 2,24 10061,0 1500 342 2,21 10016,0 1600 353 2,21 9970,0 1700 367 2,25 9922,0 1800 385 2,31 9873,0 1900 407 2,41 9822,0 2000 434 2,54 9770,0 2100 450 2,7 2200 470 2,89 2300 500 3,12 2400 540 3,37 2500 590 3,66 2600 610 3,98 2700 610 4,33 2800 610 4,71 2900 610 5,12 3000 610 5,57 ZIRCONIA, [7]
T [ °C ] Cp [ J / kg K ] λ [ W/ m K ] D [ m2 / s ] ρ[Kg/ m3 ] 19,85 445 0,57 2,57E-07 4984,0 199,85 530 0,59 2,20E-07 5060,0 399,85 580 0,59 2,02E-07 5035,8 599,85 600 0,56 1,87E-07 4991,1 799,85 600 0,52 1,74E-07 4980,8 999,85 600 0,58 1,91E-07 5061,1 1199,85 610 0,79 2,57E-07 5039,2 1399,85 630 1,07 3,38E-07 5024,9 1599,85 670 1,32 3,93E-07 5013,1 1799,85 730 1,5 4,08E-07 5036,3 1999,85 820 1,85 4,50E-07 5013,6 2199,85 910 2,16 4,72E-07 5028,9 2299,85 940 2399,85 960 2,68 5,55E-07 5030,0 2699,85 1020 3,48 6,79E-07 5024,7 POROUS ZIRCONIA, [8] T [ °C ] Cp [ J / kg K ] λ [ W/ m K ] ρ[Kg/ m3 ] 480,0 93,333 543,92 2371,1 753,12 400 0,08 800 0,11 1100 0,14 1400 0,19 1650 0,23
HAFNIUM, [9] T [ °C ] Cp [ J / kg K ] λ [ W/ m K ] ρ[Kg/ m3 ] 13,31 0,05 23,3 25,05 23 100,05 22,4 200,05 27,424 400,05 29,239 600,05 30,941 800,05 32,552 1000,05 34,088 1200,05 35,564
7. APPENDIX B
The local pressure drops was calculated by IDELCHIK HANDBOOK, [10]. The following average physical parameters in the fluid is assumed in the calculation, [11]. The pressure drop coefficients of case G5 are displayed.
P [MPa] T [°C] ρ [kg/m3] µ[Pa*s] v [m/s]
13 330.85 638.37 7.4196*10-5 0.1
Hot channel Inlet
Sudden area variation.
F0 [m2] F1 [m2] V0 [m/s] Re k Correlation 3,1416*10-4 2,2902*10-3 0,054 9292 0.58796 Tab.Idelcik Pag 96 krev k=(1-F0/F1)2 0,74447 Fuel inlet
Sudden area variation.
F0 [m2] F1 [m2] V0 [m/s] Re k Correlation 2,4328*10-4 3,1416*10-4 0,069735 6300 0.25 Tab.Idelcik Pag 96 krev k=(1-F0/F1)2 0,050904 End of cladding
Sudden area variation.
F0 [m2] F1 [m2] V0 [m/s] Re k Correlation
2,4328*10-4 2,6135*10-4 0,069735 6300
0.00478 k=(1-F0/F1)2
krev Tab.Idelcik Pag 96
Holes inlet
The pressure drop coefficient is calculated with two different correlation: sudden area variation and side branch in a pipe. In the code is utilized the biggest.
Sudden area variation:
Sudden area reduction
F0 [m2] F1 [m2] V0 [m/s] Re k Correlation 2,0106*10-4 2,6135*10-4 0,084378 5808 0.3 Tab.Idelcik Pag 96 krev k=(1-F0/F1)2 0,053218
Sudden area enlargement
F0 [m2] F1 [m2] V0 [m/s] Re k Correlation
2,0106*10-4 1,6735*10-3 0,084378 5808
0.77415 k=(1-F0/F1)2
krev Tab.Idelcik Pag 96
0,75
Side branch in a pipe:
Fs [m2] Fp [m2] k Correlation 2,0106*10-4 2,6135*10-4 1,6646 Tab.Idelcik Pag 268 krev k=(1-F0/F1)2 0,053218 Ktot 1,0741 Ktotrev 0,80322
Cold channel exit
Sudden area variation.
F0 [m2] F1 [m2] V0 [m/s] Re k Correlation 1,0334*10-3 2,29*10-3 0,016417 1966 0.30111 k=(1-F0/F1)2 krev Tab.Idelcik Pag 96 0,225
Water discharge channel Inlet Sudden area variation.
F0 [m2] F1 [m2] V0 [m/s] Re k Correlation 7,068*10-6 1,9761*10-3 2,4003 61955 0.49821 k=0,5*(1-F0/F1) krev k=(1-F0/F1)2 0,99286
8. REFERENCES 9.
[1] “Jules Horowiz Reactor, Status Report 2006-2007” – CEA [2] “CATHARE 2 V2.5_2. – Operation Manual” CEA
[3] “CATHARE 2 V2.5_2. – Description of the Base Revision 6.1 Physical Laws Used in the 1D,0D and 3D Modules” DER/SSTH/LDAS/EM/2008-044 CEA
[4] Internal Data - CEA
[5] DRE-SRO-SIEN / Note Technique 97-143A; Annexe 1.2 - CEA
[6] Fuel Data: Phebus P.F. - Data Book FPT3-August 2007. Part 4 Material Properties - CEA [7] Zirconia Data: Phebus P.F. - Data Book FPT3-August 2007. Part 4 Material Properties,
Table at pag. 1. - CEA
[8] Porous Zirconia Data: Zircar Zirconia. Inc. It has been chosen a Zirconia Cylinder,Type : ZYC http://www.zircarzirconia.com/doc/A-G_ZYC.pdf.
NOTE: The data for Heat Capacity have been taken from Zirconia Felt,Type : ZYF
http://www.zircarzirconia.com/doc/C-AB_ZYF.pdf
[9] Hafnium Data: Thermal Conductivity, Handbook of Chemistry and Physics. Table pag E-12. CRC Press
Specific Heat Capacity, NIST website:
http://webbook.nist.gov/cgi/cbook.cgi?ID=C7440586&Units=SI&Mask=2#Thermo-Condensed
Density, http://www.periodictable.com/Elements/072/data.html
[10] “Handbook of Hydraulic Resistance”- I. E. Idelchik [11] NIST Chemistry WebBook: