New insight into the role of metabolic reprogramming in melanoma cells
harboring BRAF mutations
Anna Ferretta
a,e, Immacolata Maida
a, Stefania Guida
b, Amalia Azzariti
c, Letizia Porcelli
c, Stefania Tommasi
d,
Paola Zanna
a, Tiziana Cocco
a, Michele Guida
e,⁎
, Gabriella Guida
a,⁎⁎
a
Department of Basic Medical Sciences Neurosciences and Sense Organs, University of Bari, Bari, Italy
bDermatology Unit, University of Modena and Reggio Emilia, Modena, Italy
c
Clinical and Preclinical Pharmacology Laboratory, National Cancer Research Centre“Giovanni Paolo II”, Bari, Italy
d
Molecular Genetics Laboratory and Radiology, National Cancer Research Centre“Giovanni Paolo II”, Bari, Italy
e
Medical Oncology Department, National Cancer Research Centre“Giovanni Paolo II”, Bari, Italy
a b s t r a c t
a r t i c l e i n f o
Article history: Received 14 April 2016
Received in revised form 4 August 2016 Accepted 13 August 2016
Available online 16 August 2016
This study explores theV600BRAF-MITF-PGC-1
α axis and compares metabolic and functional changes occurring in primary and metastaticV600BRAF melanoma cell lines.
V600BRAF mutations in homo/heterozygosis were found to be correlated to high levels of pERK, to downregulate
PGC-1α/β, MITF and tyrosinase activity, resulting in a reduced melanin synthesis as compared to BRAFwt melanoma cells. In this scenario,V600BRAF switches on a metabolic reprogramming in melanoma, leading to a
decreased OXPHOS activity and increased glycolytic ATP, lactate, HIF-1α and MCT4 levels. Furthermore, the induction of autophagy and the presence of ER stress markers inV600BRAF metastatic melanoma cells suggest that
metabolic adaptations of these cells occur as compensatory survival mechanisms. For thefirst time, we underline the role of peIF2α as an important marker of metastatic behaviour in melanoma.
Our results suggest the hypothesis that inhibition of the glycolytic pathway, inactivation of peIF2α and a reduction of basal autophagy could be suitable targets for novel combination therapies in a specific subgroup of metastatic melanoma.
© 2016 Elsevier B.V. All rights reserved.
Keywords: Melanoma BRAF PGC-1α Lactate MCT4 peIF2α 1. Introduction
The study of molecular pathways involved in metastatic melanoma (MM) is challenging, and many routes have been reported to support pro-liferation and survival. Mutations in the BRAF gene have been identified in 50–70% of malignant melanomas. All the mutations occur within the ki-nase domain, and the specific mutation V600BRAF (V600E, V600K,
V600R and V600D) accounts for approximately 90% of them. This muta-tion introduces a conformamuta-tional change in the BRAF activamuta-tion domain, which results in the constitutive activation of the protein and a major in-crease in its basal kinase activity. The RAS-RAF-MEK-ERK pathway plays a crucial role in regulating gene expression and cell proliferation, contribut-ing both to melanoma formation and to progression[1].
ERK proteins, through the activation of p90RSK kinase, induce the phosphorylation of the Microphthalmia-associated transcription factor (MITF), increasing its activity, but undermining its intracellular stability. MITF, a master regulator of melanocyte development and melanomagenesis,[2]binds the M box in the tyrosinase promoter region, positively regulating tyrosinase and tyrosinase related protein 1/2 (TRP1/ 2) gene expression and thereby increasing melanogenesis[3].
MITF expression is also increased following Adenylate Cyclase (AC) stimulation induced by theα-MSH hormone[4]. In turn, the cAMP and Abbreviations: ATP, adenosine triphosphate; BRAF, serine/threonine-protein kinase
B-Raf; cAMP, cyclic adenosine monophosphate; CDK4, cyclin-dependent kinases 4; CREB, cAMP response element binding protein; DMEM, Dulbecco's modified Eagle's medium; DMSO, dimethyl sulfoxide; DNP, dinitrophenol; DO, dopa-oxidase; ER, endoplasmic reticulum; ERK, extracellular signal-regulated kinase; FBS, fetal bovine serum; FSK, forskolin;
GAPDH, glyceraldehyde 3-phosphate dehydrogenase; H2DCFDA, 2′-7′
dichlorodihydrofluorescin diacetate; HIF-1, hypoxia-inducible factor-1; LDH, lactate dehy-drogenase; MAPK, mitogen-activated protein kinase; MBTH, 3-methyl-2-benzothiazolinone; MCT, monocarboxylate transporter; MC1R, melanocortin 1 receptor; MITF, microphthalmia-associated transcription factor; MM, metastatic melanoma; NDP-MSH, (Nle4,D-Phe7) alpha-melanocyte stimulating hormone; OCR, oxygen consumption rates; OXPHOS, oxidative phos-phorylation; PBS, phosphate buffer saline; PDK1, pyruvate dehydrogenase kinase 1; PDH, py-ruvate dehydrogenase; PKA, protein kinase A; PGC-1α, peroxisome proliferator-activated
receptor-gamma coactivator 1; PMSF, phenylmethylsulfonylfluoride; RHC, red hair color;
ROS, Reactive oxygen species; TCA, tricarboxylic acid cycle; TH, tyrosine hydroxylase; TRP1/ 2, tyrosinase related protein 1/2.
⁎ Correspondence to: M. Guida, Medical Oncology Department, National Cancer
Research Centre“Giovanni Paolo II”, Via Orazio Flacco, 65, 70124 Bari, Italy.
⁎⁎ Correspondence to: G. Guida, Department of Basic Medical Sciences, Neurosciences and Sense Organs, University of Bari, 70124 Bari, Italy.
E-mail addresses:[email protected](M. Guida),[email protected](G. Guida).
http://dx.doi.org/10.1016/j.bbamcr.2016.08.007
0167-4889/© 2016 Elsevier B.V. All rights reserved.
Contents lists available atScienceDirect
Biochimica et Biophysica Acta
j o u r n a l h o m e p a g e :w w w . e l s e v i e r . c o m / l o c a t e / b b a m c rthe RAS-RAF-MEK-ERK pathways cooperate to regulate melanocyte biol-ogy and stimulate melanogenesis, and their interplay is essential for MITF activity[5,6].
Another important pathway in melanocytes and melanoma development is the WNT/β-catenin signaling. Its activation, determined by Wnt glycoprotein family members binding to the Frizzled receptors leads toβ-catenin activation as a transcription factor and increases C-Myc, PPAR1 and CyclinD1 expression[7].
In addition, ERK activation, constitutive in V600BRAF mutated melanoma cells, determines an induction of cyclin D1 expression through the activation of the AP1 and ets-2 expression factors[8–12]. In turn cyclin D1, binding CDK4, represses peroxisome proliferator-activated receptorγ coactivator 1 alpha (PGC-1α) by phosphorylation, reducing its activity as a transcriptional coactivator[13].
In our study, in particular, attention has been focused on the role of oxidative phosphorylation (OXPHOS), known to be controlled by mem-bers of the PGC-1 coactivators family: PGC-1α and PGC-1β. The role of these proteins has been previously studied in metabolic alterations in breast and colon cancers[14–16]. PGC-1α, the most closely studied, is the main positive regulator of mitochondrial biogenesis, increasing the capacity for cellular energy production[17,18].
Although some of its functions overlap with PGC-1α, less is known about PGC-1β, that shows distinct functions in different tissues[19, 20]. PGC-1α expression can be influenced by several signaling pathways and has been involved in angiogenesis development[21]. Recently, an important role of PGC-1α has been associated to melanoma resistance to anti-BRAF therapies, and its overexpression, driven by MITF in mela-noma cells, influences metabolic homeostasis[22–24].
Several decades ago, Otto Warburg observed that cancer cells show a significantly higher glycolytic activity compared to normal cells even in the presence of an adequate oxygen supply[25]. This phenomenon occurs in normal proliferating and tumor cells[26,27], in order to pro-vide building blocks for the synthesis of new macromolecules such as proteins, lipids and nucleic acids. Moreover, in melanoma development and progression, both autophagy and ER stress play an important role in energy regulation, although their true impact is still unclear[28]. Autophagy is the main process for bulk degradation and recycling of damaged intra-cellular components[29–31], providing nutrients during stress conditions, such as nutrient deprivation[32]. Autophagy activa-tion is frequently observed in late stage malignancy. A deregulaactiva-tion of autophagy seems to be a secondary event contributing to melanoma progression, and to play an important role in chemoresistance. Likewise, ER stress may represent a key event in melanoma development. It is ac-tivated by the accumulation of unfolded proteins, protein overload or a depletion of ER calcium stores. It is mediated by specific signaling path-ways, in order to maintain ER homeostasis promoting the induction of an Unfolded Protein Response (UPR), ensuring a cytoprotective and pro-survival activity[28]. Furthermore, a persistent ER stress condition may induce apoptosis[33].
In this study we analyse theV600BRAF-MITF-PGC-1α axis and
com-pare metabolic and functional changes, autophagy and ER cellular stress occurring in melanoma cell lines harboring BRAF mutations. In particu-lar, we focus on gaining a better understanding of relevant pathways and their correlation in order to develop new approaches for clinical therapeutic strategies.
2. Materials and methods
2.1. Cell lines
Melanoma cells, hmel1, M3, hmel9, and hmel11, were obtained from human sporadic melanoma biopsy specimens, after obtaining informed consent, and genotyped for NRAS, BRAF and MC1R[34,35](Table 1). hmel1 and M3 arise from metastases while hmel9 and hmel11 arise from primary lesions. Melanoma cells HBL, used as control for the experiments, and LND1, both BRAFwt, were a gift from Prof. G. Ghanem,
Université de Bruxelles, Belgium. Cell culture media used was high-glucose Dulbecco's modified Eagle's medium (DMEM) supplemented with 10% (v/v) fetal bovine serum (FBS), 1% (v/v)L-glutamine, 1% (v/v) penicillin/streptomycin, at 37 °C in a humidified atmosphere at 5% CO2.
2.2. Tyrosine hydroxylase (TH) activity
Tyrosinase, as tyrosine hydroxylase (TH) activity, was assessed in cell lysates prepared as described in[34]. The tyrosine hydroxylase ac-tivity was determined by a radiometric method. One unit was defined as the amount of enzyme catalyzing the hydroxylation of 1μmol of l-tyrosine/min in presence of a 50μM concentration of the substrate and 10μML-dopa as cofactor.
2.3. Western blot analysis
Total cell proteins (30μg) were separated on 13% Tris–Tricine SDS-PAGE according to[36]and transferred onto nitrocellulose membranes. Western blot analysis was performed using the specified primary anti-bodies against the: CI-39 kDa subunit, CIV-Cox IV subunit, porin (Invitrogen), monocarboxylate transporters MCT1 and MCT4 (Santa Cruz Biotechnology), MITF (Thermo Scientific), eIF2α and peIF2α (Santa Cruz Biotechnology) according to the manufacturer's suggested concentrations. Protein loading was assessed by reprobing the blots withβ-actin (Sigma), or Tubulin (Sigma-Aldrich) antibodies. pERK was determined as described in Zanna et al.[35]. The lipid-conjugated form of LC3 (LC3 II) localises to the membranes of autophagosomes and it can be separated from non-conjugated form (LC3 I) by immuno-blotting, since LC3 II migrates faster than LC3 I due to the extreme hydrophobicity of LC3 II. For LC3 detection, total cell proteins (45μg) were separated on 12% Tris-Glycine SDS–PAGE and transferred onto ni-trocellulose membranes. Western blot analysis was performed using a specific antibody against LC3B (Cell Signaling Technology).
The secondary antibodies were anti-rabbit-HRP, anti-mouse-HRP (Millipore) or anti-Goat IgG (SIGMA A-8919). Proteins were detected by chemiluminescent LiteAblot reagent (Euroclone) and the signal was quantified by densitometric analysis using Quantity One-4.4.1 imaging software (Bio-Rad Laboratories).
2.4. Cyclic adenosine monophosphate (cAMP) assay
The cAMP levels were determined by the direct cAMP ELISA Kit (Enzo Life Sciences). The cells were treated in the presence of 10−7Mα-MSH and 10−5M forskolin for 30 min, used as a positive control, or DMSO used as a vehicle. For cAMP assays, the culture medium was removed and 1 ml of 0.1 M HCl was added to the cell layer, followed by 10 min in-cubation at 37 °C. The lysed cells were scraped and transferred into Eppendorf tubes. The samples were centrifuged at 1300 ×g for 10 min. at 4 °C. The supernatants were used for cAMP measurements using a di-rect immunoassay kit (Assay Designs) according to the manufacturer's in-struction. Measurements were performed on a Victor 2030 multilabel reader (PerkinElmer) and normalized on protein content.
Table 1
Genotyping analysis of BRAF, NRAF and MC1R in melanoma cells lines through direct se-quencing or next generation sese-quencing.
Cell line Origin MC1R NRAS BRAF exon 15
HBL Metastasis WT/WT WT/WT WT/WT
LND1 Metastasis WT/WT WT/WT WT/WT
hmel1 Metastasis WT/WT WT/WT V600K/WT
M3 Metastasis D184H/D184H WT/WT V600E/V600E
hmel 9 Primary melanoma T314T/WT WT/WT V600R/V600R
2.5. Real-time PCR
Purification of total RNA from fibroblasts was carried out using the RNeasy Mini Kit (Qiagen), according to the manufacturer's protocol. One microgram of total RNA was then reverse-transcribed to generate cDNA for PCR using the I Script cDNA Synthesis Kit (Bio-Rad). q-PCR on cDNA was performed as previously described [37], using glyceraldehyde-3-phosphate dehydrogenase (GAPDH) andβ-actin as internal control. Relative quantification was performed using the comparative CTmethod (ΔΔCT). Validated primers for qRT-PCR were
in Table S1.
2.6. Endogenous respiration rates in intact cells
Mitochondrial oxygen consumption was measured polarographical-ly with a Clark-type oxygen electrode in a water-jacketed chamber (Hansatech Instruments, Norfolk, UK), magnetically stirred at 37 °C as previously described[37].
Cells were grown to 70% confluence and medium was changed the day before the measurement. Cells were collected by trypsinization and centrifugation, washed once in TD (0.137 M NaCl, 5 mM KCl, 0.7 mM Na2HPO4, 25 mM Tris–HCl, pH 7.4), resuspended in the same buffer
pre-viously air equilibrated at 37 °C, and transferred into a polarographic chamber, at afinal concentration of 1 to 3 × 10⁶cells per ml. After the
na-tive endogenous O2consumption rate was recorded, dinitrophenol (DNP)
was added at a concentration of 30μM, followed by 20 nM antimycin A to inhibit the upstream segment of the respiratory chain.
2.7. Total cellular ATP level
The melanoma cells were grown in T25flasks. Once the cells were at 75% confluence, the ATP level was measured in untreated and 5 μM oligomycin-treated cells incubated for 30 min. After incubation the cells were collected by trypsinization and centrifugation at 500 ×g and then re-suspended in phosphate-buffered saline, pH 7.4. Cellular ATP content was determined using the PerkinElmer“ATPlite” Kit (PerkinElmer) according to the manufacturer's instructions. Measurements were performed on a Victor 2030 multilabel reader (PerkinElmer) and normalized on protein content.
2.8. Lactate level
Cells were seeded in 60 mm plastic Petri dishes and cultured for 24 h. The amount of lactate in the cell medium was estimated as described in
[38].
2.9. Intracellular ROS level
Quantitative analysis of ROS level was performed using the cell permeant probe 2′-7′dichlorodihydrofluorescin diacetate (H2DCFDA).
Cells were incubated with 10μM H2DCFDA in a serum-free medium in
the dark at 37 °C for 30 min, collected by trypsinization, washed and re-suspended in an assay buffer (100 mM potassium phosphate, pH 7.4, 2 mM MgCl2). An aliquot was used for protein determination. The
ROS-dependent oxidation of thefluorescent probe (507 nm excitation and 530 nm emission wavelength) was measured by a Jasco FP6200 spectrofluorometer, as described in[37].
2.10. Statistical analysis
Data of quantitative measurements are expressed as means ± SEM, and statistically analyzed with Student's t-test; a p valueb 0.05 was set for statistically significant differences.
3. Results
3.1. pERK and cAMP levels inV600BRAF and wt melanoma cells
Table 1shows the origin of the melanoma cells studied and their MC1R, NRAS and BRAF exon 15 genotype; some of them were already described in[34,35]. HBL and LND1 cells were wild type for (gene analyzed) MC1R, NRAS and BRAF and considered as our control. Instead, hmel1, M3, hmel9, hmel11 melanoma cells, harboring different
V600BRAF mutations, were the experimental cell lines (Table 1). All
melanoma cells arise from metastases, except hmel9 and hmel11 which were from primary melanoma lesions. The NRAS genotype was wt in all our analyzed cells.
As previously reported in Zanna et al.,[35], we found higher levels of pERK in all melanoma cells harboring theV600BRAF mutation. In detail,
we found the highest pERK levels in M3 and hmel1 cells, the former harboring a BRAF mutation V600E in homozygosis, the latter a V600K in heterozygosis (Fig. 1).
Intracellular cAMP levels activate signaling pathways thatfinally induce melanogenesis, maintaining thefine balance between prolifera-tion and differentiaprolifera-tion and playing an essential role during melanocyte or melanoma development. Therefore we measured basal cAMP levels in the M3 cell line (Fig. 2), in response to NDP-MSH or forskolin treatment, taking into account the previously reported results[35]. In particular, we compared three metastatic cell lines: M3 and hmel1 (V600BRAF mutated) with HBL (BRAFwt) (Fig. 2). In accordance with
our previous data [35], cAMP levels in response to NDP-MSH or forskolin were higher in BRAFwt melanoma cells (HBL) compared to
V600BRAF melanoma cells (M3 and hmel1). Thus, both hmel1 and M3
melanoma cells did not show any significant cAMP activation after forskolin treatment. Although M3 carries a MC1R variant (Table 1), cAMP levels afterα-MSH or forskolin stimulation were not dissimilar to those of hmel1 (MC1R wt). These results, in accordance with more data obtained on BRAF mutated melanoma cells (data not shown),
**
**
HBL
hmel1
M3
pERK /
ERK
3.0
2.5
2.0
1.5
1.0
0.5
0.0
pERK1/2
ERK
HBL hmel1 M3
42 kDa
44 kDa
42 kDa
Fig. 1. Phosphorylation protein levels of Erk in wild type andV600
BRAF melanoma cells. Representative Western blot of pERK and ERK levels on whole cell lysates from BRAFwt
(HBL) andV600BRAF (hmel1 and M3) melanoma cells. The other melanoma cells are
reported in Zanna et al.[35]. Bar graph shows quantification by densitometric analysis of
pERK protein bands normalized to ERK, used as loading control. Values are means ± SEM of three independent experiments; significance was calculated with Student's t-test;
suggest the hypothesis that theV600BRAF mutation could affect cAMP
levels in response to MC1R stimulation.
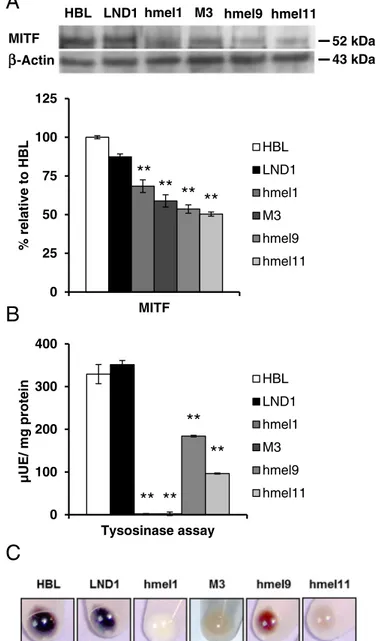
3.2. Pigmentation parameters: MITF levels and tyrosinase activity
MITF is considered a master regulator gene for pigment cells, having an important role as a transcription factor involved in melanocytes survival, growth and differentiation. MITF levels are also one of the key players in the phenotypic instability of melanomas[6]. For all melanoma cells we analyzed MITF expression levels by Western blot analysis (Fig. 3A) and their tyrosinase activity (Fig. 3B).V600BRAF cells displayed a significantly lower MITF expression than BRAFwt HBL and LND1 (Fig. 3A), with MITF values ranging from 30% (hmel1, M3) to 50% (hmel9, hmel11) compared to BRAFwt cells.
A crucial step for melanogenesis in melanoma cells is tyrosinase activity. This activity resulted significantly higher in the melanoma cells HBL and LND1 (NRAS, MC1R, BRAFwt), thus correlated to the pigmented phenotype of their cellular pellets (Fig. 3C).
Moreover,V600BRAF melanoma cells with lower MITF levels showed a
reduced (byN50% in hmel9 and hmel11) or even almost absent (hmel1, M3) tyrosinase activity, compared to the higher levels in BRAFwt melano-ma cells.
3.3. Expression levels of PGC-1α and PGC-1β inV600
BRAF and wt melanoma cells
Recently, a“MITF-PGC-1α axis” has been described, involved in me-lanocyte development as well as in the transformation to melanoma
[39]. Haq et al.[23]reported a decreased expression of the mitochondri-al master regulator PGC-1α, involved in the regulation of metabolism, differentiation and cell growth inV600EBRAF cell lines. We investigated
the PGC-1α pathways, focusing on the possible metabolic alterations in melanoma cells. First of all, we analyzed mRNA levels of PGC-1α and some of its downstream target genes, directly involved in mitochondrial biogenesis and activity (Fig. 4). Melanoma cells showed a very wide difference in PGC-1α expression related to the BRAF status. A downregulation of this coactivator was found in melanoma cells harboringV600BRAF (hmel1, M3, hmel9, hmel11), compared to HBL
mel-anoma cells. mRNA levels of TFAM (mitochondrial transcription factor) and cytochrome c resulted significantly lower in allV600
BRAF melanoma cells, compared to wt cells (HBL, LND1) (Fig. 4A), confirming an altered PGC-1α activity and transcriptional deregulation of its target genes.
Furthermore, we explored the expression of PGC-1β, a member of the PGC-1 family. PGC-1β shows a similar trend of PGC-1α expression, presenting very low levels in allV600BRAF melanoma cells (hmel1, M3,
hmel9, hmel11), as compared to BRAFwt melanoma cells (HBL, LND1) (Fig. 4B).
3.4. Functional analysis of the bioenergetic metabolism in wt andV600BRAF
melanoma cells
Cancer cells need to regulate their metabolic program to fuel several activities such as unlimited proliferation, resistance to cell death, invasion and metastasis.
Taking into account the existence of a metabolic reprogramming in melanoma cells, with an energy production strategy change from mitochondrial oxidative phosphorylation to cytoplasmic aerobic glycol-ysis, we analyzed the mitochondrial respiratory function by measuring the oxygen consumption rates (OCR) by endogenous substrates
**
*
*
**
0 25 50 75 100 125 150 HBL hmel 1 M3 pmol / mg proteinc AMP
CTRL αMSH FSK Fig. 2. Effect ofV600BRAF on cAMP levels in total melanoma cell lysates. The graph displays the basal cAMP levels normalized for the total protein content in HBL, hmel1 and M3
melanoma cells (open bar), in the presence ofα-MSH (black bar) or forskolin (grey
bar). The cAMP levels of the other melanoma cells are reported in Zanna et al.[35].
Values are means ± SEM of three independent experiments; significance was calculated
with Student's t-test; *pb 0.05, **p b 0.005 vs HBL.
A
HBL
LND1
hmel1
M3
hmel9
MITF
-Actin
**
** **
**
0
25
50
75
100
125
MITF
% relative to HBL
HBL
LND1
hmel1
M3
hmel9
hmel11
** **
**
**
0
100
200
300
400
Tysosinase assay
µUE/ mg protein
HBL
LND1
hmel1
M3
hmel9
hmel11
B
C
43 kDa
52 kDa
ββ
hmel11
Fig. 3. Effect ofV600BRAF on MITF protein expression and melanogenic enzyme activity.
(A) Representative Western blot of MITF levels performed on whole cell lysates. Bar graph shows quantification by densitometric analysis of MITF protein bands normalized
toβ-actin, used as loading control. Values, means ± SEM of three independent
experiments, are expressed as percentage of HBL values. (B) Bar graph shows tyrosinase
activity expressed asμUE/mg protein. Values are means ± SEM of three independent
experiments. Significance was calculated with Student's t-test; *p b 0.05, **p b 0.005 vs
HBL. (C) Pellets of wt andV600BRAF melanoma cell lines producing different amounts of
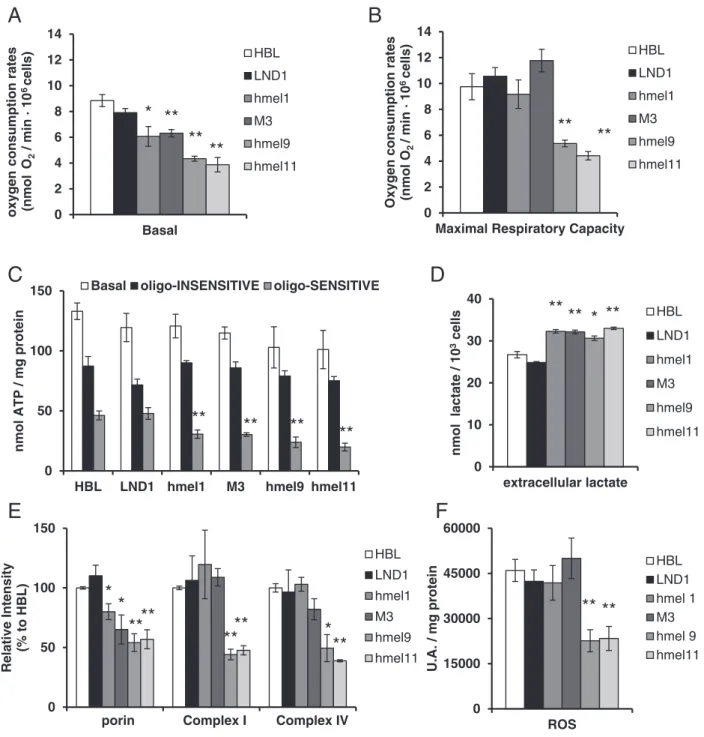
(basal) in intact cells. As shown inFig. 5A, the basal OCR was signi ficant-ly lower in theV600BRAF melanoma cells compared to wt melanoma
cells (HBL, LND1), whereas the maximal DNP-uncoupled respiration (DNP-uncoupled), in presence of a proton ionophore (Fig. 5B), was sig-nificantly lower exclusively in the primary melanoma cells (hmel9 and hmel11), as compared to the other MM cells (HBL, LND1, hmel1, M3). An important feature emerging from this assay (DNP-uncoupled) is the mitochondrial reserve capacity, calculated by subtracting the basal OCR from the DNP-stimulated rate. A lower maximal respiratory capacity observed in primary melanoma cells (hmel9 and hmel11) could indicate a decreased substrate availability or a compromised mi-tochondrial integrity (Fig. 5B). To investigate the relative contribution of mitochondrial OXPHOS and of glycolysis to ATP production, we deter-mined the intracellular ATP content in the absence and in the presence of oligomycin, a specific inhibitor of mitochondrial F1F0-ATP-synthase (Fig. 5C). In allV600BRAF cells (hmel1, M3, hmel9, hmel11), the basal
ATP levels did not differ significantly as compared to BRAFwt melanoma cells (HBL, LND1), but a significant decrease was observed in presence of oligomycin (hmel1 25.4 ± 2.8% M3 26.4 ± 1.3% hmel9 23.2 ± 4.3% hmel11 19.7 ± 3.2% of total ATP content) compared to BRAFwt melano-ma cells (HBL 36.4 ± 7.4%; LND1 40.0 ± 12.2% of total ATP content).
These data support the hypothesis that the defective OXPHOS ATP production byV600BRAF cells could be compensated by an increased
glycolytic supply. Consistent with the increased glycolytic ATP produc-tion, we found higher extracellular lactate levels measured in the culture media of allV600BRAF cells, as reported inFig. 5D.
To assess whether an altered expression of mitochondrial proteins could underlie the reduction in the mitochondrial respiratory activity, we evaluated, by semi-quantitative Western blot analysis, the steady-state levels of some OXPHOS subunits (Fig. 5E). The results showed a significant decrease (by about 50%) in the protein expression level of complex I (CI) and complex IV (CIV) subunits, only in primary melanoma cells (hmel9 and hmel11) as compared to the HBL cells, while the mitochondrial outer membrane protein expression (porin) was significantly lower in all theV600BRAF cells (hmel1: 80 ± 6.7%,
M3: 65 ± 12.2%, hmel9: 54 ± 7.4%, hmel11: 56.9 ± 7.9), compared to wt melanoma cells (HBL 100 ± % LND1:110 ± 8.8%).
Since mitochondria commonly metabolize oxygen, thereby producing reactive oxygen species (ROS) as a by-product, we evaluated ROS levels in all melanoma cells. As shown inFig. 5F, significantly lower ROS levels, by about 50%, were observed in primary melanomas cells (hmel9 and hmel11) compared with MM cells values. These data indi-cate that during melanoma development in primary and metastatic le-sions with theV600BRAF mutation status, an early activation of the
BRAF-MEK-ERK pathway occurs, shifting the energy balance through the inhibition of mitochondrial OXPHOS.
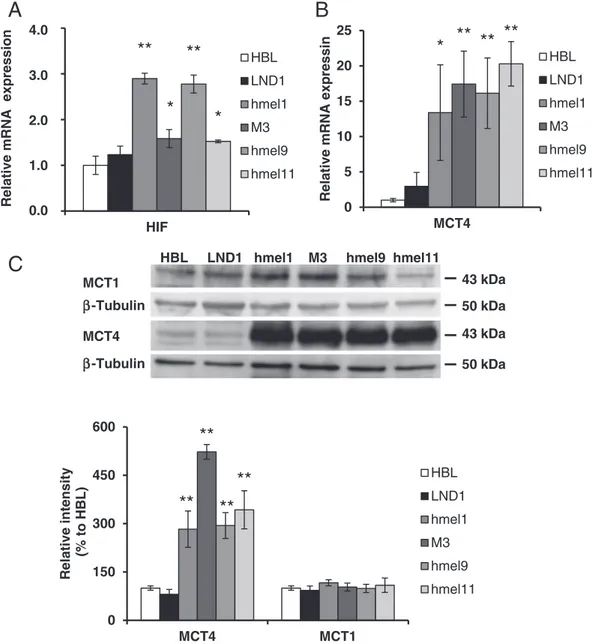
The lactate produced by the enhanced anaerobic glycolysis, de-scribed inV600BRAF melanoma cells, must be eliminated from cells in
order to avoid a drop in intracellular pH, which could result in cellular damage. To counteract this effect, HIF-1α, a master-transcriptional acti-vator for a group of genes involved in cell survival, energy metabolism and pH regulation[40]induces the expression of monocarboxylate transporter 4 (MCT4), which mediates lactic acid efflux[40]. In fact, in
V600BRAF melanoma cells, we detected significantly higher HIF-1α
mRNA levels compared to HBL cells (HBL: 1; LND1: 1.2; hmel1: 2.9; M3: 1.6; hmel9: 2.8; hmel11: 1.5 fold increase) (Fig. 6A). Furthermore, in these cells, significantly higher levels of MCT4 were observed, in terms of both mRNA (Fig. 6B) and protein expression (Fig. 6C). No significant changes were observed in the protein expression of MCT1, which mediates lactic acid influx, in all V600BRAF melanoma cells
(Fig. 6C).
3.5.V600BRAF results in increased basal autophagy and chronic ER stress
induction
Recent data link oncogenic BRAF-induced chronic ER stress and au-tophagy[28]. We explored the activation of known pathways linking these two processes. We determined the basal cell autophagy in mela-noma cells, performing immunoblot analysis of autophagic markers LC3. As shown inFig. 7A, a highly significant increase of the LC3II/LC3I ratio was detected in all V600BRAF cells, hmel1 (96 ± 49%), M3
(113 ± 40%), hmel9 (122 ± 35%) and hmel11 (197 ± 32%) compared with HBL, BRAFwt melanoma cells. These results indicate the accumula-tion of auto-phagosomes inV600BRAF melanoma cells. Furthermore, the
detection of ER stress was monitored in wt andV600BRAF cell lines, comparing the phosphorylation status of eIF2α by Western blotting analysis. Significantly high levels of p-eIF2α were observed only in MM V600BRAF cells, hmel1 (163 ± 7.3%) and M3 (139 ± 20%). Conversely, no significant changes were observed in primary melanoma cells hmel9 and hmel11 as compared with BRAFwt melanoma cells (Fig. 7B).
4. Discussion
Many studies indicate that several melanoma transformations require constitutive activation of the RAS-RAF-MEK-ERK cascade[1,41]. In fact, in
V600BRAF melanoma cells, we found high levels of ERK phosphorylation,
compared to BRAFwt cell lines. Activation of the ERK pathway is known to phosphorylate MITF[42], whose expression is regulated by the cAMP/PKA signaling pathway, via phospho-CREB, leading to a reduced melanin synthesis and, consequently hypopigmentation[43].
In fact, we observed that allV600BRAF melanoma cells have lower
levels of cAMP after the stimulation assay, revealing an impaired MC1R coupling to the cAMP pathway, downregulation of MITF expression, a depressed activity of tyrosinase, a key enzyme in melanin biosynthesis, and impaired pigmentation. In detail, in V600BRAF
A
B
**
*
*
**
**
*
**
**
**
**
**
**
PGC-1α cit c TFAM Relative mRNA expression**
**
**
**
PGC-1β Relative mRNA expression HBL LND1 hmel1 M3 hmel9 hmel11 1.5 1.0 0.5 0.0 1.5 1.0 0.5 0.0Fig. 4. PGC-1α expression and transcriptional activity in BRAFwt andV600BRAF melanoma cells. (A) Semi-qRT-PCR analysis of PGC-1α, its target genes (TFAM, cyt c) and (B) PGC-1β mRNA
levels, normalized to the housekeeping gene GAPDH (ΔΔCT), in BRAFwt (open andfilled bars) orV600
BRAF melanoma cells (grey bars). Values are mean ± SEM offive independent
melanoma cells, ERK activation, involved in the anti-melanogenic mechanism, lead to MITF and tyrosinase down-regulation, resulting in a reduction in melanin synthesis.
High levels of ERK phosphorylation, upon nuclear accumulation of ERK, overexpress cyclin D1, which is required for the growth and survival of melanoma cells in vitro and in vivo[44,45]. Bhalla et al. identified PGC-1α as a novel CDK4 substrate and further confirmed that cyclin D1/CDK4 represses PGC-1α activity[13]. Therefore,
V600BRAF sustains the repression of OXPHOS gene expression by
cyclin D1, via PGC-1α inactivation. In this context, our study
identifies a pathway by which the oncogenicV600BRAF regulates
the bioenergetic metabolism in melanoma, and it underlines how metabolic reprogramming is accompanied by a suppression of MITF and PGC-1α, a major regulator of mitochondrial biogenesis and function.
Furthermore, ourfindings show thatV600BRAF activation in
melano-ma cells is associated with OXPHOS dysfunction and an increased glyco-lytic ATP and lactate production. The decreased OXPHOS will require a shift to other sources of energy generation to ensure the maintenance of cellular ATP levels. Cancer cells rely on the so-called “aerobic
D
A
B
E
C
F
**
**
**
**
0
50
100
150
HBL
LND1
hmel1
M3
hmel9 hmel11
nmol
ATP / mg protein
Basal
oligo-INSENSITIVE
oligo-SENSITIVE
* **
**
**
0
2
4
6
8
10
12
14
Basal
oxygen consumption
rates
(nmol
O
2/ min
· 10
6cells)
HBL
LND1
hmel1
M3
hmel9
hmel11
**
**
0
2
4
6
8
10
12
14
Maximal Respiratory Capacity
Oxygen
consumption
rates
(nmol
O
2/
min
· 10
6cells)
HBL
LND1
hmel1
M3
hmel9
hmel11
** ** * **
0
10
20
30
40
extracellular lactate
nmol
lactate
/ 10
3cells
HBL
LND1
hmel1
M3
hmel9
hmel11
** **
0
15000
30000
45000
60000
ROS
U.A. / mg
protein
HBL
LND1
hmel 1
M3
hmel 9
hmel11
*
*
**
**
*
**
**
**
0
50
100
150
Relative Intensity
(% to HBL)
HBL
LND1
hmel1
M3
hmel9
hmel11
porin Complex I Complex IV
Fig. 5. Mitochondria functional analysis and bioenergetic metabolism in BRAFwt andV600
BRAF melanoma cells. (A) Oxygen consumption rates (OCR) in the presence of endogenous
substrates (basal) and (B) DNP (30μM)-uncoupling agent (Maximal Respiratory Capacity), measured in intact melanoma cells and expressed as nmol O2/min·106
cells. (C) Total cellular ATP content measured under basal conditions, (open bar). The oligomycin-insensitive (oligo-INSENSITIVE) ATP contents were determined in cells incubated for 1 h with
oligomycin 5μM, (filled bar). The oligomycin sensitive (oligo-SENSITIVE) ATP production was calculated by subtracting the oligomycin-insensitive value from the basal ATP content,
(grey bar). Values are the means ± SEM of three independent experiment. (D) The extracellular lactate level was measured in the growth medium 24 h after seeding. Values are means ± SEM of three independent experiments. (E) Protein expression of Complex I (39 kDa) and Complex IV (Cox IV) respiratory chain subunits and of porin, performed on whole cell lysates. Bar graph shows quantification by densitometric analysis of mitochondrial protein bands normalized to β-actin, used as loading control. Data, means ± SEM of three
independent experiments, are expressed as percentage of HBL values. (F) The intracellular ROS content was detected by DCFfluorescence in cells loaded with DCFH-DA (10 μM) for
glycolysis” or ‘Warburg effect’[25], characterized by a reduced TCA cycle and OXPHOS with the concomitant production of ATP and lactic acid even in presence of oxygen[46].
It is noteworthy that while significantly lower basal oxygen consumption rates were observed in allV600BRAF melanoma cells, the
DNP-stimulated rate was lower only in primary melanoma cells (hme9 and hmel11) supporting the hypothesis of a lower reserve capacity.
The shift to glycolysis, confirmed by the increased lactate levels, was found to be dependent on HIF-1α expression. In cancer cells, HIF-1α blocked pyruvate dehydrogenase (PDH) activity by activating enzyme pyruvate dehydrogenase kinase 1 (PDK1)[47–49]. This determines the fate of pyruvate, that is converted into lactate, instead of entering into the TCA cycle. This behavior is predominant inV600BRAF melanoma cells and contributes to the Warburg effect and to the enhancement of the malignant phenotype[50,51].
To counteract the increased lactate levels, HIF-1α induces monocar-boxylate transporter 4 (MCT4), which mediates the lactic acid efflux required to preserve a normal intracellular pH [40]. In fact, in
V600BRAF melanoma cells we found a higher HIF-1α expression, higher
extracellular lactate levels, and increased MCT4 mRNA and protein levels, compared with BRAFwt cells, confirming the metabolic shift of these cells. It is known that in hypoxic cancer cells, the large amounts of exported lactate create an acidic tumor environment, which fosters cancer cell invasion[52].
It has been reported that the induction of autophagy may represent an adaptation mechanism for cancer cells exposed to an acidic environ-ment[53]and, furthermore, thatV600BRAF induces senescence
trigger-ing autophagy, possibly by inhibition of the mTOR pathway[54]. In fact, in our study, we detected the induction of autophagy-related markers expression (LC3), inV600BRAF melanoma cells as compared to
BRAFwt cells.
We can hypothesize that the describedV600BRAF melanoma cells
drive a significant upregulation of autophagy as a compensatory surviv-al mechanism to counteract apoptotic signsurviv-als. Metabolic activity and cell survival are consequently sustained by the recycling of degradation products, allowing a steady supply of nutrients, and removal of
A
B
C
**
*
**
*
HIF
Relative
mRNA
expression
HBL
LND1
hmel1
M3
hmel9
hmel11
*
** ** **
0
5
10
15
20
25
MCT4
Relative mRNA expressin
HBL
LND1
hmel1
M3
hmel9
hmel11
4.0
3.0
2.0
1.0
0.0
HBL
LND1 hmel1 M3
hmel9 hmel11
MCT4
β
-Tubulin
MCT1
43 kDa
43 kDa
50 kDa
β
-Tubulin
50 kDa
**
**
**
**
0
150
300
450
600
MCT4
MCT1
Relative intensity
(% to HBL)
HBL
LND1
hmel1
M3
hmel9
hmel11
Fig. 6. Effect of HIF-1α on Monocarboxylate transporter (MCT) expression in BRAFwt andV600BRAF melanoma cells. Semi-qRT-PCR analysis of HIF-1α (A) and MCT4 (B) mRNA levels,
normalized to the housekeeping gene GAPDH, in BRAFwt (open andfilled bars) orV600
BRAF (grey bars) melanoma cells. Values are means ± SEM offive experiments performed in
duplicate. Significance was calculated with Student's t-test; *p b 0.05, **p b 0.005 vs HBL. (B) Representative Western blot of MCT1 and MCT4 levels performed on whole cell lysates,
from BRAFwt (open andfilled bars) andV600BRAF (grey bars) melanoma cells. Bar graph shows quantification by densitometric analysis of MCT1 and MCT4 protein bands normalized
damaged organelles to oppose the rapid depletion of intracellular nutri-ents and a buildup of aggregated proteins and damaged organelles[28]. Corazzari et al. described in a recent paper that autophagy and ER stress are activated in melanoma cells, having a cytoprotective and pro-survival activity[28]. Furthermore, it is known that phosphoryla-tion of theα-subunit of the translation initiation factor eIF2 at serine 51 (peIF2α) is a master regulator of cell adaptation to various forms of stress, acting as a molecular switch that dictates either cell survival or death[55].
In our study we highlight an increase of peIF2α in MM but not in pri-maryV600BRAF cells, thus delineating autophagy activation by ER stress
as a pro-survival mechanism in peIF2α-proficient cells (MMV600
BRAF cells). To our knowledge, this is thefirst report of peIF2α as a marker of a more aggressive phenotype in melanoma.
In conclusion, the innovative findings of our research strongly suggest that metabolic pathways, autophagy and ER stress may be important targets for combination therapies in metastatic melanoma.
Supplementary data to this article can be found online athttp://dx. doi.org/10.1016/j.bbamcr.2016.08.007.
Transparency document
TheTransparency documentassociated with this article can be found, in online version.
Acknowledgements
The authors are grateful to Mary V. Pragnell for language assistance in the preparation of this manuscript. Dr. Anna Ferretta's work was sponsored by an IMI (Intergruppo Melanoma Italiano) fellowship.
References
[1] H. Davies, G.R. Bignell, C. Cox, P. Stephens, S. Edkins, S. Clegg, J. Teague, H. Woffendin, M.J. Garnett, W. Bottomley, N. Davis, E. Dicks, R. Ewing, Y. Floyd, K. Gray, S. Hall, R. Hawes, J. Hughes, V. Kosmidou, A. Menzies, C. Mould, A. Parker, C. Stevens, S. Watt, S. Hooper, R. Wilson, H. Jayatilake, B.A. Gusterson, C. Cooper, J. Shipley, D. Hargrave, K. Pritchard-Jones, N. Maitland, G. Chenevix-Trench, G.J. Riggins, D.D. Bigner, G. Palmieri, A. Cossu, A. Flanagan, A. Nicholson, J.W.C. Ho, S.Y. Leung, S.T. Yuen, B.L. Weber, H.F. Seigler, T.L. Darrow, H. Paterson, R. Marais, C.J. Marshall, R. Wooster, M.R. Stratton, P.A. Futreal, Mutations of the BRAF gene in
human cancer, Nature 417 (2002) 949–954, http://dx.doi.org/10.1038/
nature00766.
[2] T.J. Hemesath, E.R. Price, C. Takemoto, T. Badalian, D.E. Fisher, MAP kinase links the transcription factor microphthalmia to c-kit signalling in melanocytes, Nature 391
(1998) 298–301,http://dx.doi.org/10.1038/34681.
[3] J.C. García-Borrón, F. Solano, Molecular anatomy of tyrosinase and its related pro-teins: beyond the histidine-bound metal catalytic center, Pigment Cell Res. Spons. Eur. Soc. Pigment Cell Res. Int. Pigment Cell Soc. 15 (2002) 162–173.
[4] C. Bertolotto, P. Abbe, T.J. Hemesath, K. Bille, D.E. Fisher, J.P. Ortonne, R. Ballotti, Microphthalmia gene product as a signal transducer in cAMP-induced differentia-tion of melanocytes, J. Cell Biol. 142 (1998) 827–835.
[5] N. Dumaz, R. Hayward, J. Martin, L. Ogilvie, D. Hedley, J.A. Curtin, B.C. Bastian, C. Springer, R. Marais, In melanoma, RAS mutations are accompanied by switching sig-naling from BRAF to CRAF and disrupted cyclic AMP sigsig-naling, Cancer Res. 66 (2006)
9483–9491,http://dx.doi.org/10.1158/0008-5472.CAN-05-4227.
[6] C. Levy, M. Khaled, D.E. Fisher, MITF: master regulator of melanocyte development
and melanoma oncogene, Trends Mol. Med. 12 (2006) 406–414,http://dx.doi.org/
10.1016/j.molmed.2006.07.008.
[7] K. Marinou, C. Christodoulides, C. Antoniades, M. Koutsilieris, Wnt signaling in
car-diovascular physiology, Trends Endocrinol. Metab. 23 (2012) 628–636,http://dx.
doi.org/10.1016/j.tem.2012.06.001.
[8] K. Balmanno, S.J. Cook, Sustained MAP kinase activation is required for the expres-sion of cyclin D1, p21Cip1 and a subset of AP-1 proteins in CCL39 cells, Oncogene
18 (1999) 3085–3097,http://dx.doi.org/10.1038/sj.onc.1202647.
[9] H. Aktas, H. Cai, G.M. Cooper, Ras links growth factor signaling to the cell cycle ma-chinery via regulation of cyclin D1 and the Cdk inhibitor p27KIP1, Mol. Cell. Biol. 17 (1997) 3850–3857.
[10] J.N. Lavoie, G. L'Allemain, A. Brunet, R. Müller, J. Pouysségur, Cyclin D1 expression is regulated positively by the p42/p44MAPK and negatively by the p38/HOGMAPK pathway, J. Biol. Chem. 271 (1996) 20608–20616.
[11] B. Herber, M. Truss, M. Beato, R. Müller, Inducible regulatory elements in the human cyclin D1 promoter, Oncogene 9 (1994) 1295–1304.
[12] C. Albanese, J. Johnson, G. Watanabe, N. Eklund, D. Vu, A. Arnold, R.G. Pestell, Transforming p21ras mutants and c-Ets-2 activate the cyclin D1 promoter through distinguishable regions, J. Biol. Chem. 270 (1995) 23589–23597.
[13] K. Bhalla, W.-J. Liu, K. Thompson, L. Anders, S. Devarakonda, R. Dewi, S. Buckley, B.-J. Hwang, B. Polster, S.G. Dorsey, Y. Sun, P. Sicinski, G.D. Girnun, Cyclin D1 represses gluconeogenesis via inhibition of the transcriptional coactivator PGC1α, Diabetes
63 (2014) 3266–3278,http://dx.doi.org/10.2337/db13-1283.
[14] G.D. Girnun, The diverse role of the PPARγ coactivator 1 family of transcriptional
coactivators in cancer, Semin. Cell Dev. Biol. 23 (2012) 381–388,http://dx.doi.org/
10.1016/j.semcdb.2012.01.007.
[15] E. Klimcakova, V. Chénard, S. McGuirk, D. Germain, D. Avizonis, W.J. Muller, J. St-Pierre, PGC-1α promotes the growth of ErbB2/Neu-induced mammary tumors by
regulating nutrient supply, Cancer Res. 72 (2012) 1538–1546,http://dx.doi.org/10.
1158/0008-5472.CAN-11-2967.
[16] X. Wang, C.T. Moraes, Increases in mitochondrial biogenesis impair carcinogenesis
at multiple levels, Mol. Oncol. 5 (2011) 399–409,http://dx.doi.org/10.1016/j.
molonc.2011.07.008.
[17] C. Handschin, B.M. Spiegelman, Peroxisome proliferator-activated receptor gamma coactivator 1 coactivators, energy homeostasis, and metabolism, Endocr. Rev. 27
(2006) 728–735,http://dx.doi.org/10.1210/er.2006-0037.
[18] D.P. Kelly, R.C. Scarpulla, Transcriptional regulatory circuits controlling
mitochondri-al biogenesis and function, Genes Dev. 18 (2004) 357–368,http://dx.doi.org/10.
1101/gad.1177604.
[19] J. Lin, R. Yang, P.T. Tarr, P.-H. Wu, C. Handschin, S. Li, W. Yang, L. Pei, M. Uldry, P. Tontonoz, C.B. Newgard, B.M. Spiegelman, Hyperlipidemic effects of dietary
A
B
LC3-I LC3-IIHBL LND1 hmel1 hmel9 hmel11 M3
ββ-Actin
** *
0 50 100 150 200 PeIF2 α /eIF2 α (% to HBL) HBL LND1 hmel1 M3 hmel9 hmel11 HBL LND1 hmel1 M3 hmel9 hmel11eIF2 peIF2 38 kDa 38 kDa 19 kDa 17 kDa 43 kDa
*
**
**
*
0 50 100 150 200 250 300 350 Relative Ratio LC3 -II/ LC3-I HBL LND1 hmel1 hmel9 hmel11 M3Fig. 7. Autophagy and ER stress in BRAFwt and V600BRAF melanoma cells.
(A) Representative Western blot of LC3-I and LC3-II levels performed on whole cell lysates. Bar graph shows the LC3-II/LC3I ratio calculated by densitometric analysis of the
protein bands normalized toβ-actin, used as loading control. Value, means ± SEM of
five independent experiments are expressed as percentage of the HBL value. (B) Representative Western blot of eIF2α and peIF2α levels performed on whole cell lysates. Bar graph shows the peIF2α/eIF2α ratio calculated by densitometric analysis of the protein bands, using eIF2α as loading control. Value, means ± SEM of three independent experiments are expressed as percentage of the HBL value. Significance
saturated fats mediated through PGC-1beta coactivation of SREBP, Cell 120 (2005)
261–273,http://dx.doi.org/10.1016/j.cell.2004.11.043.
[20] C. Wolfrum, M. Stoffel, Coactivation of Foxa2 through Pgc-1beta promotes liver fatty
acid oxidation and triglyceride/VLDL secretion, Cell Metab. 3 (2006) 99–110,http://
dx.doi.org/10.1016/j.cmet.2006.01.001.
[21] J. Chinsomboon, J. Ruas, R.K. Gupta, R. Thom, J. Shoag, G.C. Rowe, N. Sawada, S. Raghuram, Z. Arany, The transcriptional coactivator PGC-1alpha mediates exercise-induced angiogenesis in skeletal muscle, Proc. Natl. Acad. Sci. U. S. A. 106
(2009) 21401–21406,http://dx.doi.org/10.1073/pnas.0909131106.
[22] P. Corazao-Rozas, P. Guerreschi, M. Jendoubi, F. André, A. Jonneaux, C. Scalbert, G. Garçon, M. Malet-Martino, S. Balayssac, S. Rocchi, A. Savina, P. Formstecher, L. Mortier, J. Kluza, P. Marchetti, Mitochondrial oxidative stress is the Achilles heel of melanoma cells resistant to Braf-mutant inhibitor, Oncotarget 4 (2013)
1986–1998,http://dx.doi.org/10.18632/oncotarget.1420.
[23] R. Haq, J. Shoag, P. Andreu-Perez, S. Yokoyama, H. Edelman, G.C. Rowe, D.T. Frederick, A.D. Hurley, A. Nellore, A.L. Kung, J.A. Wargo, J.S. Song, D.E. Fisher, Z. Arany, H.R. Widlund, Oncogenic BRAF regulates oxidative metabolism via PGC1α and MITF,
Cancer Cell 23 (2013) 302–315,http://dx.doi.org/10.1016/j.ccr.2013.02.003.
[24] F. Vazquez, J.-H. Lim, H. Chim, K. Bhalla, G. Girnun, K. Pierce, C.B. Clish, S.R. Granter, H.R. Widlund, B.M. Spiegelman, P. Puigserver, PGC1α expression defines a subset of human melanoma tumors with increased mitochondrial capacity and resistance to
oxidative stress, Cancer Cell 23 (2013) 287–301,http://dx.doi.org/10.1016/j.ccr.
2012.11.020.
[25] O. Warburg, On the origin of cancer cells, Science 123 (1956) 309–314.
[26] M. López-Lázaro, Does hypoxia really control tumor growth? Cell. Oncol. Off. J. Int. Soc. Cell. Oncol. 28 (2006) 327–329.
[27] M. López-Lázaro, The Warburg effect: why and how do cancer cells activate glycol-ysis in the presence of oxygen? Anti Cancer Agents Med. Chem. 8 (2008) 305–312.
[28] M. Corazzari, F. Rapino, F. Ciccosanti, P. Giglio, M. Antonioli, B. Conti, G.M. Fimia, P.E. Lovat, M. Piacentini, Oncogenic BRAF induces chronic ER stress condition resulting in increased basal autophagy and apoptotic resistance of cutaneous melanoma,
Cell Death Differ. 22 (2015) 946–958,http://dx.doi.org/10.1038/cdd.2014.183.
[29] J.L. Armstrong, M. Corazzari, S. Martin, V. Pagliarini, L. Falasca, D.S. Hill, N. Ellis, S. Al Sabah, C.P.F. Redfern, G.M. Fimia, M. Piacentini, P.E. Lovat, Oncogenic B-RAF signal-ing in melanoma impairs the therapeutic advantage of autophagy inhibition, Clin.
Cancer Res. Off. J. Am. Assoc. Cancer Res. 17 (2011) 2216–2226,http://dx.doi.org/
10.1158/1078-0432.CCR-10-3003.
[30] R. Lazova, V. Klump, J. Pawelek, Autophagy in cutaneous malignant melanoma, J.
Cutan. Pathol. 37 (2010) 256–268,http://dx.doi.org/10.1111/j.1600-0560.2009.
01359.x.
[31] X.-H. Ma, S. Piao, D. Wang, Q.W. McAfee, K.L. Nathanson, J.J. Lum, L.Z. Li, R.K. Amaravadi, Measurements of tumor cell autophagy predict invasiveness, resistance to chemotherapy, and survival in melanoma, Clin. Cancer Res. Off. J. Am. Assoc.
Can-cer Res. 17 (2011) 3478–3489,http://dx.doi.org/10.1158/1078-0432.CCR-10-2372.
[32] G.M. Fimia, M. Piacentini, Regulation of autophagy in mammals and its interplay
with apoptosis, Cell. Mol. Life Sci. 67 (2010) 1581–1588,http://dx.doi.org/10.
1007/s00018-010-0284-z.
[33] C. Giampietri, S. Petrungaro, S. Conti, A. Facchiano, A. Filippini, E. Ziparo, Cancer mi-croenvironment and endoplasmic reticulum stress response, Mediat. Inflamm. 2015
(2015) 417281,http://dx.doi.org/10.1155/2015/417281.
[34]P. Zanna, I. Maida, M.C. Turpin Sevilla, F.C. Susca, R. Filotico, M. Arciuli, N. Cassano, G.A. Vena, R. Cicero, G. Guida, Molecular characterization of novel melanoma cell lines, J. Biol. Regul. Homeost. Agents 25 (2011) 239–247.
[35] P. Zanna, I. Maida, C. Grieco, S. Guida, M.C. Turpin Sevilla, S. De Summa, S. Tommasi, G.A. Vena, R. Filotico, G. Guida, Three novel human sporadic melanoma cell lines: signaling pathways controlled by MC1R, BRAF andβ-catenins, J. Biol. Regul. Homeost. Agents 27 (2013) 131–141.
[36] H. Schägger, T.A. Link, W.D. Engel, G. von Jagow, Isolation of the eleven protein sub-units of the bc1 complex from beef heart, Methods Enzymol. 126 (1986) 224–237.
[37] A. Ferretta, A. Gaballo, P. Tanzarella, C. Piccoli, N. Capitanio, B. Nico, T. Annese, M. Di Paola, C. Dell'aquila, M. De Mari, E. Ferranini, V. Bonifati, C. Pacelli, T. Cocco, Effect of
resveratrol on mitochondrial function: implications in parkin-associated familiar
Parkinson's disease, Biochim. Biophys. Acta 1842 (2014) 902–915,http://dx.doi.
org/10.1016/j.bbadis.2014.02.010.
[38] K.C. Lund, L.L. Peterson, K.B. Wallace, Absence of a universal mechanism of mitochondrial toxicity by nucleoside analogs, Antimicrob. Agents Chemother. 51
(2007) 2531–2539,http://dx.doi.org/10.1128/AAC.00039-07.
[39] Z.‘’e. Ronai, The masters talk: the PGC-1α-MITF axis as a melanoma energizer,
Pigment Cell Melanoma Res. (2013)http://dx.doi.org/10.1111/pcmr.12090.
[40] N.C. Denko, Hypoxia, HIF1 and glucose metabolism in the solid tumour, Nat. Rev.
Cancer 8 (2008) 705–713,http://dx.doi.org/10.1038/nrc2468.
[41] P.T.C. Wan, M.J. Garnett, S.M. Roe, S. Lee, D. Niculescu-Duvaz, V.M. Good, C.M. Jones, C.J. Marshall, C.J. Springer, D. Barford, R. Marais, Cancer genome project, mechanism of activation of the RAF-ERK signaling pathway by oncogenic mutations of B-RAF, Cell 116 (2004) 855–867.
[42] K.W. Vance, C.R. Goding, The transcription network regulating melanocyte development and melanoma, Pigment Cell Res. Spons. Eur. Soc. Pigment Cell Res.
Int. Pigment Cell Soc. 17 (2004) 318–325,http://dx.doi.org/10.1111/j.1600-0749.
2004.00164.x.
[43]M. Wu, T.J. Hemesath, C.M. Takemoto, M.A. Horstmann, A.G. Wells, E.R. Price, D.Z. Fisher, D.E. Fisher, c-Kit triggers dual phosphorylations, which couple activation and degradation of the essential melanocyte factor Mi, Genes Dev. 14 (2000) 301–312.
[44] E.R. Cantwell-Dorris, J.J. O'Leary, O.M. Sheils, BRAFV600E: implications for
carcino-genesis and molecular therapy, Mol. Cancer Ther. 10 (2011) 385–394,http://dx.
doi.org/10.1158/1535-7163.MCT-10-0799.
[45] J.D. Weber, D.M. Raben, P.J. Phillips, J.J. Baldassare, Sustained activation of extracellular-signal-regulated kinase 1 (ERK1) is required for the continued expres-sion of cyclin D1 in G1 phase, Biochem. J. 326 (Pt 1) (1997) 61–68.
[46] D.A. Tennant, R.V. Durán, H. Boulahbel, E. Gottlieb, Metabolic transformation in
can-cer, Carcinogenesis 30 (2009) 1269–1280,http://dx.doi.org/10.1093/carcin/bgp070.
[47] C.V. Dang, G.L. Semenza, Oncogenic alterations of metabolism, Trends Biochem. Sci. 24 (1999) 68–72.
[48] R.J. DeBerardinis, Is cancer a disease of abnormal cellular metabolism? New angles on an old idea, Genet. Med. Off. J. Am. Coll. Med. Genet. 10 (2008) 767–777,
http://dx.doi.org/10.1097/GIM.0b013e31818b0d9b.
[49] J. Kim, I. Tchernyshyov, G.L. Semenza, C.V. Dang, HIF-1-mediated expression of pyru-vate dehydrogenase kinase: a metabolic switch required for cellular adaptation to
hyp-oxia, Cell Metab. 3 (2006) 177–185,http://dx.doi.org/10.1016/j.cmet.2006.02.002.
[50] R.G. Jones, C.B. Thompson, Tumor suppressors and cell metabolism: a recipe for
can-cer growth, Genes Dev. 23 (2009) 537–548,http://dx.doi.org/10.1101/gad.1756509.
[51] T. McFate, A. Mohyeldin, H. Lu, J. Thakar, J. Henriques, N.D. Halim, H. Wu, M.J. Schell, T.M. Tsang, O. Teahan, S. Zhou, J.A. Califano, N.H. Jeoung, R.A. Harris, A. Verma, Pyru-vate dehydrogenase complex activity controls metabolic and malignant phenotype
in cancer cells, J. Biol. Chem. 283 (2008) 22700–22708,http://dx.doi.org/10.1074/
jbc.M801765200.
[52] R.A. Gatenby, E.T. Gawlinski, A.F. Gmitro, B. Kaylor, R.J. Gillies, Acid-mediated tumor
invasion: a multidisciplinary study, Cancer Res. 66 (2006) 5216–5223,http://dx.doi.
org/10.1158/0008-5472.CAN-05-4193.
[53] M.L. Marino, P. Pellegrini, G. Di Lernia, M. Djavaheri-Mergny, S. Brnjic, X. Zhang, M. Hägg, S. Linder, S. Fais, P. Codogno, A. De Milito, Autophagy is a protective mecha-nism for human melanoma cells under acidic stress, J. Biol. Chem. 287 (2012)
30664–30676,http://dx.doi.org/10.1074/jbc.M112.339127.
[54] N. Maddodi, W. Huang, T. Havighurst, K. Kim, B.J. Longley, V. Setaluri, Induction of autophagy and inhibition of melanoma growth in vitro and in vivo by
hyperactiva-tion of oncogenic BRAF, J. Invest. Dermatol. 130 (2010) 1657–1667,http://dx.doi.
org/10.1038/jid.2010.26.
[55] K. Rajesh, J. Krishnamoorthy, U. Kazimierczak, C. Tenkerian, A.I. Papadakis, S. Wang, S. Huang, A.E. Koromilas, Phosphorylation of the translation initiation factor eIF2α at serine 51 determines the cell fate decisions of Akt in response to oxidative stress,
![Table 1 shows the origin of the melanoma cells studied and their MC1R, NRAS and BRAF exon 15 genotype; some of them were already described in [34,35]](https://thumb-eu.123doks.com/thumbv2/123dokorg/5469839.62042/3.892.463.812.634.1008/table-shows-origin-melanoma-cells-studied-genotype-described.webp)