Full Terms & Conditions of access and use can be found at
https://www.tandfonline.com/action/journalInformation?journalCode=tbit20
ISSN: 0144-929X (Print) 1362-3001 (Online) Journal homepage: https://www.tandfonline.com/loi/tbit20
Analysing trade-offs in frameworks for the design
of smart environments
Carmelo Ardito, Giuseppe Desolda, Rosa Lanzilotti, Alessio Malizia &
Maristella Matera
To cite this article: Carmelo Ardito, Giuseppe Desolda, Rosa Lanzilotti, Alessio Malizia &
Maristella Matera (2020) Analysing trade-offs in frameworks for the design of smart environments, Behaviour & Information Technology, 39:1, 47-71, DOI: 10.1080/0144929X.2019.1634760
To link to this article: https://doi.org/10.1080/0144929X.2019.1634760
Published online: 04 Jul 2019.
Submit your article to this journal
Article views: 237
View related articles
View Crossmark data
Analysing trade-o
ffs in frameworks for the design of smart environments
Carmelo Ardito a, Giuseppe Desolda a, Rosa Lanzilotti a, Alessio Malizia b,cand Maristella Matera d
a
Dipartimento di Informatica, Università degli Studi di Bari Aldo Moro, Bari, Italy;bSchool of Creative Arts, University of Hertfordshire, Hertfordshire, UK;cMolde University College, Molde, Norway;dDipartimento di Elettronica, Informazione e Bioingegneria, Politecnico di Milano, Milano, Italy
ABSTRACT
Smart Interactive Experiences (SIEs) are usage situations enabled by the Internet of Things that empower users to interact with the surrounding environment. The goal of our research is to define methodologies and software environments to support the design of SIEs; more specifically, we focus on design paradigms suitable for experts of given domains, who however might not be experts in technology. In this context, this paper discusses some trade-offs that we identified between six different dimensions that characterise the quality of software environments for SIE design. The trade-offs emerged from the analysis of data collected in an experimental study that compared three different design paradigms to understand in which measure each paradigm supports the creative process for SIE design. After reporting on the study procedure and the data analyses, the paper illustrates how the resulting trade-offs led us to identify alternatives for SIE design paradigms, and to structure on their basis a modular architecture of a software platform where the strengths of the three paradigms can be exploited flexibly, i.e. depending on the constraints and the requirements characterising specific design situations.
ARTICLE HISTORY
Received 24 November 2018 Accepted 14 June 2019
KEYWORDS
Internet of things; non-technical domain experts; trigger-action programming; tangible user interfaces; trade-offs in design; user study
1. Introduction
Several interactive systems today are based on Internet of Things (IoT) technologies. IoT largely supports the development of smart objects, which are devices equipped with embedded electronics, whose functions and data can be accessed through distributed services (Atzori, Iera, and Morabito2010). Smart objects have a great potential from the interaction point of view, as they enable the creation of tangible interactive objects users can bring with them, touch and manipulate for tackling different tasks in different application domains (Guo et al.2013). Through them, the use of IoT systems can be extended to creating immersive experiences where users are empowered to interact with the surrounding environment, also by means of tangible interactions, and can influence the state of the overall system by means of their actions on the physical environment. Such capabilities generate Smart Interactive Experiences (SIEs – pronounced see-ehs), i.e. usage situations, enabled by IoT systems, where thefinal users can deter-mine, through their interaction, a‘personalized’ behav-iour of the overall system. SIEs are now adopted in different fields: education (Andreoli et al.2017; Madeira et al. 2011; Uskov and Sekar 2015), art exhibitions
(Cuomo et al. 2017) and museums (Marshall et al.
2016), therapies for intellectual disabilities (Garzotto and Gelsomini2018) to name but a few.
The goal of the research discussed in this paper is to define methodologies and tools to support the design of SIEs, an aspect that is only marginally discussed in the literature (Conti et al. 2012). The emphasis is on the synchronisation among multiple objects and user actions to provide narrative threads conveying some content (Ardito, Buono, et al. 2017). To define these
complex usage situations, designers not only need to programme the behaviour of single smart objects; rather adequate design environments and systematic method-ologies are required to guide the identification of strat-egies for object synchronisation.
The methodologies and the software environments that we have developed so far relate to End-User Devel-opment (EUD) (Costabile et al.2006; Lieberman et al.
2006), as they address the needs of domain experts who might not be experts in technology. In particular, our work has largely focused on supporting Cultural Heritage (CH) operators to define SIEs for museums (Ardito, Buono, et al.2017). Several studies demonstrate the importance of introducing SIEs in CH sites (Ardito
© 2019 Informa UK Limited, trading as Taylor & Francis Group
CONTACT Giuseppe Desolda [email protected] Dipartimento di Informatica, Università degli Studi di Bari Aldo Moro, Via Orabona, Bari, 4–70125, Italy
et al.2012; Ibrahim and Ali2018; Marshall et al. 2016; Petrelli and Lechner 2014; Rennick-egglestone et al.
2016; Zancanaro et al.2015). Since very often the pro-fessional operators who organise visits to CH sites are not technology savvy, it becomes important to provide tools that can facilitate the identification of strategies to convey the content of a CH site through SIEs.
To enable the EUD of SIEs, we initially defined visual metaphors for the specification of Event-Condition-Action (ECA) rules and through user studies we assessed their effectiveness (Desolda, Ardito, and Matera 2017). During this phase of the research we identified the neces-sity of introducing conceptual tools to support the crea-tive process for translating high-level ideas into rules that synchronise the behaviour of smart objects with user’s actions (Ardito, Buono, et al.2017). To respond to this need, we defined three different design paradigms, two based on Tangible User Interface (TUI) and one on Aug-mented Reality, to allow domain experts to systemati-cally express and specify concepts that derive from their domain knowledge and that can help governing the SIE dynamics. In the initial ideation phase, domain experts can thus focus on domain-oriented semantics, rather than on low-level technicalities needed to pro-gramme smart objects. The expressed concepts, which we call custom attributes, initially help experts identify in the large the SIE idea. In the following phase they pro-vide a terminology familiar to experts, which facilitates the detailed definition of ECA rules governing the behav-iour of the SIE resources.
1.1. Contributions
In our previous work, we already proved the effectiveness of introducing domain-oriented semantics as a means to simplify SIE design (Ardito, Buono, et al. 2017). Recently, we also conducted an experimental study to compare the three design paradigms for the definition of custom attributes, to better understand the contri-bution of each of them to the creative process underlying the SIE design (Ardito et al.2018). From this study, we gathered some interesting results that contribute identi-fying promising solutions for supporting the design of SIEs. In this article, we focus on some interesting corre-lations that emerged during the analysis of the primary evaluation dimensions and that suggested us that some trade-offs had to be considered. The contribution of this paper is therefore articulated along the following points:
EUD paradigms for SIE design. We present three para-digms for SIE design by domain experts. Through their comparison, we try to shed light on the elements that
can support non-technical designers to conceive SIEs and systematically translate high-level ideas into specifi-cations that can facilitate and enhance the following definition of ECA rules.
Trade-offs for frameworks for SIE design. Based on the results of the experimental study, we discuss some trade-offs we identified between some dimensions that we con-sidered for the evaluation of the three paradigms, namely UX, Workload, Engagement, Creativity, Satisfaction and Ecology. The analysis of the collected data highlighted that none of the considered paradigms, even the one that was ranked as the best, is able to maximise all such dimensions, while a combination of elements taken from each paradigm can be fruitful (Ardito et al.
2018). Considering as a basis the specific techniques devised for the three design paradigms, this article out-lines some implications related to how to combine their strengths, which can be exploited to enhance crea-tive processes for SIE design.
Reference architecture. In order to show how the pre-sented design implications can be made concrete, and to foster the replicability of our approach, we present the architecture of a platform that is adaptable to different design situations. It allows designers toflexibly combine those elements of the three design paradigms that best suit the design situations they have to cope with. In fact, given the intrinsic flexibility of the platform, which is favoured by the decoupling of the User Interface (UI) from the other layers, different design skills, needs and goals can be easily accommodated by‘plugging-in’ different UIs in a cross-modality and cross-device fashion (Desolda et al.2019). The presented architecture proposes, therefore, a solution that can be adopted by software developers to provide flexible software frameworks.
All these contributions are in line with the notion of Quality of Life frameworks that promote tools to explore innovative solutions to improve creativity, also taking into account aspects such as gaming and enjoyment (Fischer 2017). Such frameworks aim to widen design spaces by fostering the exploration offlexible solutions, able to combine the strengths and reduce the weaknesses of the different involved aspects. This also corresponds to the goal of our research: the trade-off analysis and the software architecture presented in this article are original contributions that go in this direction.
1.2. Article organisation
The article is organised as follows. Section2discusses the rationale and background of our research. It describes our previous work and situates it with respect to some notable approaches from the literature. Section 3 then
illustrates the three design paradigms compared in the experimental study; through an example scenario, it also clarifies how the domain-oriented semantics at the basis of the proposed methodology supports SIE design. Section4describes the study procedure and reports on the results related to the six different analysis dimen-sions. Section 5 discusses, for each paradigm, some trade-offs emerged from correlations between the con-sidered evaluation dimensions. Section6presents some resulting design alternatives that led us to define a mod-ular architecture of a system for SIE design so that the potentialities identified for the three paradigms can be exploitedflexibly, i.e. depending on the specific design situations, the constraints to be fulfilled and the require-ments that designers aim to maximise. Finally, Section7
draws the conclusions and outlines our future work.
2. Rationale and background
About 30 years ago, Mark Weiser envisioned that perva-sive devices and services would have become parts of our daily life (Weiser 1991). IoT technologies have largely accelerated this trend till the point that many environ-ments we live in are today augmented through an inter-leaving between the cyber and the physical worlds (Conti et al.2012). This new technological landscape opens up the space for the creation of disruptive SIEs (Ardito, Buono, et al. 2017; Delprino et al. 2018; Garzotto and Gelsomini2018; Marshall et al. 2016; Petrelli and Lech-ner 2014; Zancanaro et al. 2015). This is having an unprecedented impact on the activities that can take place in environments provided with capabilities of ‘aug-mented sensing and interaction’ (Cook, Augusto, and Jakkula2009). However, there are still important issues to be solved to increase the adoption of such technologies by a larger audience of developers, including pro-fessionals who are not very much acquainted with technology.
The IoT phenomenon has been largely investigated on the technical side (Mighali et al. 2015; Piccialli and Chianese2017). Some approaches already try to facilitate the configuration of smart objects (Petrelli and Lechner
2014). However, it is still hard for non-technical users to define SIEs that synchronise the behaviour of multiple physical and virtual (i.e. software) resources that are installed in the environment or embedded in tangible objects. Our research tries tofill this gap.
2.1. Semantic enrichment of environments for SIE design
EUD is a researchfield that focuses on enabling people who are not professional developers to design or tailor
their interactive applications (Costabile et al.2006; Lie-berman et al. 2006). With the aim of facilitating the EUD of SIEs by stakeholders who are domain experts but do not necessarily have the required technical back-ground, we identified visual metaphors (Desolda, Ardito, and Matera2017) able to increase the simplicity and the expressiveness of languages for specifying ECA rules (Coronado and Iglesias2016). We also proposed a visual framework to empower non-technical SIE designers to build a semantic layer that can facilitate the definition of ECA rules (Ardito, Buono, et al. 2017). This is in line with the contribution of some other works that pro-pose the use of ontologies to specify high-level concepts able to provide an abstract and technology-independent representation of the smart object behaviour (Corno, Russis, and Roffarello 2017a, 2017b; Tutenel et al.
2008). The advantage of adding a semantic layer is that, by exploiting semantic terms, designers can define ECA rules by referring to the ontology concepts without worrying about technical details (Corno, Russis, and Roffarello 2017b). The semantic enrichment implies creating ontologies and associating them to smart objects; these activities require technical skills and a sig-nificant effort, still exposing the system to the risk of not covering the actual needs of the SIE designers.
Our paradigm to build a semantic layer tries to alle-viate the problems observed in the other approaches. As better explained in the following section, we propose the definition, by the designers themselves, of custom attributes. Similar to ontology concepts (e.g. see (Corno, Russis, and Roffarello 2017b)), custom attri-butes are meant to represent knowledge that can sim-plify the definition of ECA rules. However, they have a different flavour as they enable SIE designers to express the operational semantics they want to assign to the SIE resources depending on the specific usage situation they want to address. In other words, the peculiarity of custom attributes is that they are usage-driven terms, specific to the application domain, that help SIE designers make sense of digital resources, put-ting them in context with respect to the actual usage situations to be addressed.
2.2. Creativity-support environments
The results of a previous study demonstrated that the notion of custom attributes, as conceptual tools used in the initial phase of SIE conception, effectively aids domain experts to reason on and ideate the SIE (Ardito, Buono, et al.2017). However, that study also highlighted that the visual paradigm adopted for the specification of custom attributes was not adequate to the target users, i.e. domain experts with no technical background.
Despite the satisfaction in the initial conceptual identi fi-cation of custom attributes, the domain experts did not feel comfortable with the visual specification needed to store the attributes into the system. The study partici-pants also highlighted the need for additional paradigms that could stimulate creativity. They suggested the use of more natural, not necessarily visual, interaction para-digms, especially for custom attribute definition, able to take advantage of the physical nature of the objects to be synchronised and to favour the exploration of the physical environment where the SIE will be rendered. The surrounding environment, indeed, can be a source of relevant custom attributes. These results motivated us to design and evaluate the new interaction paradigms (described in the next section) that could support more effectively the creative process underlying SIE design (Ardito et al.2018).
Creativity is not easy to define and can be a difficult-to-measure aspect (Beghetto and Kaufman2007; Kauf-man and Beghetto2009). The literature recognises the impact that Creativity-Support Tools (CSTs) have in helping people with their creative processes (Shneider-man2007). According to (Cherry and Latulipe2014), a CST for the computing domain is any software design environment that is used to create software artefacts. CSTs can also be considered in the larger spectrum of Creativity-Support Environments (CSEs), i.e. design environments that use different CSTs in different phases, and focus on setting enabling work environ-ments including specialised hardware, e.g. tangible devices, and instrumented spaces fostering collaboration.
According to Shneiderman (Shneiderman 2007), CSTs should stimulate creativity based on previous knowledge, should link to associated ideas, and should also provide structured tools for exhaustive exploration. They can also support strategies for collaboration.
Shneiderman introduces four phases a CST should be founded on:
. Collect: learn from previous works, available for example in libraries or online repositories.
. Relate: consult with peers and mentors at early, middle, and late stages.
. Create: explore, compose, and evaluate possible solutions.
. Donate: disseminate the results and contribute enlar-ging repositories of knowledge based on previous experiences.
These phases and the related principles guided the design of the paradigms for custom attribute definition described in the next section.
2.3. From trade-offs to flexible design environments
The study that we conducted to compare the three design paradigms highlighted that each paradigm has peculiar features that amplify some qualities of the software environments for SIE design. As described in the next sections, the analysis of the experimental data identified some trade-offs between the considered evaluation dimensions and put the emphasis on possible design situations where one needs to renounce to some features in order to fulfil with some constraints or also gain on other, more relevant aspects. This, in the end, helped us recognise that frameworks for SIE design would benefit from having flexible architectures, able to offer alternative paradigms depending on the actual situations in which the design is conducted.
This assumption is in line with some works that dis-cuss the need for trade-offs in design. Choosing appro-priate practices for a project can be hard, given the various quality dimensions that generally have to be optimised (MacCormack et al. 2003). In (Fischer
2017), the author says that design is a process with no optimal solutions, and therefore trade-offs are essential because in many situations it is difficult, or even imposs-ible, to identify fitting solutions without considering specific goals and constraints. These works focus especially on the quality of the final product (the SIE in our case). However, their assumptions can be easily translated at a meta-level, where quality dimensions have to refer to the design process itself, rather than to the final product for the final users. The focus of our research is indeed on meta-design (i.e. ‘design for designers’) and on software environments that allow domain and/or technology experts to customise or even create the final applications to be exploited by end users (Fischer and Giaccardi2006).
In (Fischer 2017), the author also introduces the notion of Quality of Life (QoL) frameworks as tools to explore innovative sociotechnical environments contri-buting to creativity, gaming, and enjoyment. For such frameworks, it is important to identify and understand design trade-offs: in contrast to design guidelines, such frameworks indeed are supposed to widen design spaces by fostering the exploration of new approaches able to combine the strengths and reduce the weaknesses of the different involved quality dimensions (Fischer
2018). Thus, the frameworks should be permissive:
differ-ent of the majority of currdiffer-ent design environmdiffer-ents, they must not be pre-packaged systems, conceived for a specific context and rigidly fulfilling with pre-defined rules, checklists, and workflows. Rather, they must give to designers the autonomy to work with the solution
they deem more adequate according to the design situ-ation they have to cope with.
The frameworks for SIE design we focus on are strictly related to the QoL framework, as they are tools that aim to stimulate creativity to guide the design of innovative smart environments. In line with the main assumptions of the works commented above, the studies we con-ducted also highlighted a difficulty in identifying a design paradigm that bestfits the different needs and qualities of an SIE design process. Thus, we exploited the results of a trade-off analysis to understand how to design a ‘per-missive’ framework, where elements of different design paradigms can be mixed to accommodate varying design contexts. Besides the identification of some implications for paradigms for SIE design, the flexible architecture that we defined for the resulting tool is an original con-tribution towards achieving permissive frameworks sup-porting SIE design.
3. Design paradigm description
In this section, we describe the prototype systems that implement three new paradigms for SIE design. An example of SIE, i.e. a game played by visitors at a museum, also shows the role of custom attributes as a conceptual tool that aids domain experts to reason on and design the SIE (Ardito, Buono, et al. 2017). A video demonstrating the use of the three systems is avail-able at the following linkhttps://goo.gl/K2s3DS.
3.1. Example scenario
John is a professional guide who wants to offer pupils a game to explore the‘smart’ rooms of an archaeological museum, which currently hosts an exhibition on the archaeological investigation process and used tools. The displayed artefacts are equipped with smart tags, i.e. QR codes or RFID tags, which visitors can scan to obtain additional information. The game goal is to ident-ify artefacts with a certain characteristic, for example, those related to a specific phase of the archaeological investigation process (e.g. collection of historical sources, excavation, and stratigraphic reconstruction). To play the game, each pupil is provided with a smart magnifying glass that, thanks to an embedded RFID reader, reads by proximity the properties assigned to a tool, for example, its usage phase. Using an app available in a tablet, John sets a quest for the players: Find tools whose‘Usage phase = stratigraphic reconstruction’. Pupils explore the museum, identify the tools corresponding to John’s request and put the magnifying glass close to it. If the tool is actually used during the stratigraphic reconstruc-tion, a video describing the main characteristics of the
tool is shown on the display of the magnifying glass. Points are given as a reward. The game continues with John asking other questions and setting new quests.
John has to manage a number of smart objects, i.e. the archaeologists’ tools and magnifying glasses that are part of the exhibition. For each of them, he must define beha-viours by specifying ECA rules.
In order to simplify the process of synchronising the behaviour of all such smart objects, we propose to empower non-technical SIE designers to build, on top of the SIE smart objects, a semantic layer by defining cus-tom attributes. This allows SIE designers to adopt in rule specification a language closer to their own domain-expert language and would introduce abstractions that favour generalisation. For each smart object, John defines properties (which, more technically, are attri-butes of the object) that can express the meaning and the role of the object according to the game dynamics. The variables later used in the rules are exactly the attri-butes previously defined by the SIE designers.
In the example scenario, each magnifying glass is used to identify the visitor who carries it during the game. Thus, one possible attribute for the magnifying glass is ‘Owner’: for each magnifying glass it will hold a value indicating the player identifier (e.g. Player_1, Player_2, etc.). Similarly, it is possible to enrich the tools with attri-butes such as ‘Usage phase’ (with values: source collec-tion, excavacollec-tion, and stratigraphic reconstruction), ‘Exposition room’ (with values such as source collection room 1, excavation room 1, stratigraphic reconstruction room) to indicate the museum room where the tool is exhibited, ‘Video’ (with values indicating names of videofiles) to specify the video to be shown on the mag-nifying glass display when the retrieved tool is the right one. John‘freely’ defines these attributes and their values depending on the goal he wants to pursue through the game, without any constraint (syntactic or semantics) on the type of properties to be specified. Therefore, we name them custom attributes.
After defining custom attributes, John specifies the ECA rules controlling the behaviours of the smart objects. He uses a visual paradigm, similar to the one proposed in the popular IFTTT platform (Jusevičius
2018), which is more usable for non-technical users. An example of a rule, which for brevity we represent here in a formal syntax, is:
Rulei:‘IF a magnifying glass is close to a tool WHERE tool.Usage_Phase = quest.Usage_Phase THEN magnify-ing glass shows the tool.video_file’.
Without custom attributes, several rules would be defined for each device, such as: ‘If the magnifying-Glass_012 is put close to the tool_032, and the current
quest is Usage_phase = stratigraphic reconstruction, then the magnifyingGlass_012 shows the video <video01.mp4>’. This rule would be replicated for each exhibited tool and for each magnifying glass. Thanks to the custom attributes, the single Ruleiaddresses an entire
class of smart objects with the same behaviour.
3.2. Description of the three design paradigms
By taking into account the results of a design workshop where 28 participants, arranged in groups of 5 or 6, were asked to reason on possible solutions to support the crea-tive process for SIE design (Ardito, Desolda, et al.2017), we implemented three systems, i.e. Tangible, Explorative and Tactile, which are based on Tangible User Interfaces, Augmented Reality, and a mix of tangible and multi-touch interaction paradigms, respectively. The focus on these interaction paradigms is motivated by the advan-tages they offer in relation to the CST phases outlined by Shneiderman in (Shneiderman2007). Each of the cor-responding systems supports one or more CST phases. All the three systems intrinsically support the Donate phase: by their nature, they favour the establishment of domain knowledge repositories, based on the definition of custom attributes, which can be exploited for future design sessions and by other designers.
3.2.1. Tangible system
The Tangible system implements tangible user interfaces, which couple digital information with everyday physical objects and environments to augment the real physical world. Manipulation of physical artefacts improves tan-gible thinking, that is the ability to think by means of the manipulation of objects augmented with digital
information (Ishii and Ullmer1997). It can thus support the Create phase, where new knowledge has to be ident-ified and represented in form of custom attributes.
The Tangible system revolves around the idea of let-ting designers manipulate tangible objects, to exploit the capability of tangible interaction to stimulate creative thinking (Doering, Beckhaus, and Schmidt 2009; Kim and Maher2008). Two kinds of tangibles are used: (i) the smart objects to be used during the final SIE; (ii) other tangibles that SIE designers manipulate for defining custom attributes; we call them tangible attributes.
The participants of the design workshop identified three main types of tangible attributes, textual, numeri-cal, and locational, and three corresponding objects. The most desirable proposals resulted in a pen for textual attributes, dice for numerical attributes, and a compass for locational attributes. The idea that most largely emerged for custom attribute definition consisted in exploiting the co-proximity of tangible attributes and smart objects, and specifying attribute name and value by using post-it notes attached to the tangible attributes. Going back to the scenario described above,Figure 1
illustrates how John would define custom attributes for his serious game. He puts on a table some tools that players will use during the SIE, i.e. a trowel (on the right) and a pick. Then, he puts pertinent tangible attributes close to the tools. For example, he puts the pen close to the trowel to indicate his intention to define a textual attribute; then he attaches a post-it to the pen to specify the name and value of the attribute, for example,‘Usage_phase = excavation’. He repeats the same actions for each custom attribute he wants to define. In the end, he uses a mobile app to take a picture
Figure 1.Tangible system: tangible attributes, post-it notes and a mobile phone are used to define custom attributes for a smart trowel
of all the elements on the table. The recognised elements are automatically converted into the definition of custom attributes (<attribute name = value> pairs). Thus, the trowel in the system is enriched with the custom attri-butes <Usage_phase = excavation> (textual), <Points = 1> (numerical), and <Exposition room = Excavation room 1> (locational). Similarly, the pick is characterised by the attributes <Usage_phase = excavation>, <Points = 3> and <Exposition room = excavation room2>.
Once the custom attributes are in place, John proceeds with the creation of ECA rules, by using a visual interface such as the one proposed in (Desolda, Ardito, and Matera2017).
3.2.2. Explorative system
The Explorative system is based on the Augmented Rea-lity (AR) paradigm, which incorporates hand gestures and voice commands instead of traditional user com-mand tools such as a touchscreen, mouse, or keyboard (Hunsucker, Baumgartner, and McClinton2018). Thus it is suitable for exploratory search (Shneiderman
2007) and walking (Oppezzo and Schwartz 2014), which were shown to be effective to stimulate creativity. For these reasons, it can be appropriate in the Collect and Create phases.
The Explorative system promotes the interactive exploration of the real world. The idea is that codified properties of real objects in the surrounding environ-ment can suggest custom attributes for SIE smart objects; the real objects are called source objects. For example, referring again to John’s scenario, the exhibited docu-ments and tools that are equipped with QR-codes and RFID tags can be source objects. In an AR fashion, a mobile app is used to frame source objects with the mobile device camera and augment them by means of a virtual layering of properties that may suggest custom
attributes. These properties can be ‘copied and pasted’ onto the SIE smart objects, as shown in the example in
Figure 2. Specifically, John walks in the museum rooms
devoted to the exhibition, looking for interesting source objects. He notices a picture that shows two archaeolo-gists during a digging activity, thus he uses the mobile app to scan its QR-code and visualise its description and properties (Figure 2(a)). From a pop-up menu listing the picture properties, he selects two of them (the first one indicating a location, <Exposition room = excavation room 2>, the second one indicating a textual infor-mation, <Usage_phase = excavation>). Once the attri-butes are selected, the app allows John to edit their name or values, or to remove them. He can also add new attributes from scratch. To associate the selected attributes to the brush smart object, John scans the brush QR-code (seeFigure 2(b)). In the end, John creates the ECA rules that define the smart object behaviour.
3.2.3. Tactile system
The Tactile system is a hybrid solution that mixes the use of tangible objects and tactile interaction with a horizon-tal interactive display that acts as a digihorizon-tal workspace enabling the association of custom attributes with smart objects. Multitouch tabletops specifically engage multiple users to interact with physical and virtual objects at the same time, and privilege natural and intui-tive social interactions. Most of the computer-mediated approaches for creativity support single-user inter-actions, thus failing to account for collaboration in group-based, face-to-face scenarios (Catala et al.2012). To overcome this problem, we considered tabletops and tangible objects interaction, which proved suitable for collaborative processes needed in the Relate phase (Catala et al. 2012; Doering, Beckhaus, and Schmidt
2009; Kim and Maher2008).
Figure 2.Explorative system: a smartphone is used to (a) explore the environment to capture attributes from source objects; (b) associ-ate them to SIE smart objects.
The same tangible attributes used in the Tangible sys-tem, i.e. the pen, the dice and the compass, are used to represent types of custom attributes. The association occurs by putting a smart object close to the tangible attributes on the tabletop. Instead of using posts-it notes, attribute names and values are specified by means of menus displayed on the digital workspace.
In the example ofFigure 3, John acts in front of the tabletop to assign attributes to smart objects. He starts by putting on the surface a smart object (e.g. a DVD on the left ofFigure 3). A proximity area (i.e. a rounded halo) appears around the object to indicate that tangible attributes can be placed inside it. John puts a pen inside the halo, thus a pop-up appears on the interactive sur-face, asking him to define the attribute name and value, i.e. <Usage_phase = excavation>. John goes on by defining further attributes. Attributes names and values are specified using the virtual keyboard shown on the screen. As with the other systems, in the end, John cre-ates the ECA rules that define the behaviour of the smart object.
4. Experimental study
As ground for this experiment, we chose the Cultural Heritage (CH) domain due to the recent and growing interest of guides and curators in the adoption of smart objects as artefacts integrated into museums and CH sites to support the fruition of content (Petrelli and Lech-ner2014; Zancanaro et al.2015). The data presented and analysed in this article were collected during a compara-tive study, whose main goal was to better understand the contribution of each design paradigm to the creative pro-cesses of SIE design. As reported in (Ardito et al.2018), the analysis of Creativity and Satisfaction identified
interesting implications for the design of creativity-sup-port environments. During the study, we also collected other data that in this article are analysed to investigate how the three different paradigms affect some aspects related to UX, Workload, Creativity, Engagement, Satis-faction and Ecology. More specifically, through these new analyses, we aim to identify trade-offs that could suggest how to calibrate different elements of the design paradigms to maximise the quality of the design environ-ment according to specific design situations.
4.1. Participants and design
A total of 18 students at the last year of the Bachelors’ or Masters’ degree in archaeology (13 females) participated in the study that was recognised as part of their curricu-lum activities and rewarded with additional credits. Their mean age was 23.9 years (SD = 6.65, min = 20, max = 44). Slightly more than half of the participants (i.e. 10) already attended at least one excavation cam-paign and spent a good amount of time in professional activities. Only 5 of them organised guided tours in museums or in archaeological parks. Regarding their experience in Information Technology (IT), it emerged that they had a moderate experience in IT and in using mobile devices and a medium familiarity in interacting with smart objects and interactive displays.
The participants knew each other well, because they attended the same university courses, which usually include a few students (about 20 people), or were used to participate in the same professional and social activities.
A within-subject design was performed, with the sys-tem as an independent variable and three within-subject factors, i.e. Tangible, Explorative, Tactile. The participants
Figure 3.Tactile system: user puts smart objects and tangible attributes on the display and specifies attribute names and values by
were organised in 9 groups of two. Participants were allowed to express a preference for the partner with whom they would have liked to undertake the experiment, although we tried to include in as many groups as possible a participant with previous experience as a guide.
4.2. Procedure
The procedure of the study consisted of 3 main phases. Three HCI experts were involved: one acted as modera-tor in thefirst phase and in the third phase; the other two acted in the second phase, one as a facilitator and the other as an observer. The experimental study lasted three days, i.e. 3 groups were observed each day. All 9 groups got the same design brief.
In thefirst phase, the group conceived the SIE. After the HCI expert introduction about the study purpose, the group signed a consent form andfilled in the ques-tionnaire to collect demographic data. Then, the partici-pants were asked to act as curators of a museum and to arrange an exhibition titled ‘How do archaeologists work?’ to disseminate the scientific value of the archaeo-logical investigation. Indeed, they were asked to define an interactive visit by using objects (e.g. a book reporting clues to identify the excavation site, aero-reconnaissance photos of potential excavation sites, several digging tools), conceived by the participants as smart. The par-ticipants were provided with a scenario including details (e.g. the smart objects to be adopted) to help them in ela-borating ideas and in shaping up their thoughts. A brain-storming was organised to promote the generation of ideas before their implementation. It was inspired by (Burnam-Fink2015; Kohno and Johnson2011; Kudro-witz and Wallace2013) and was structured in the follow-ing four steps:
1. Each member of the group proposes 3–4 rough ideas of SIE (5 min)
2. Each member illustrated ideas to his/her partner and the partner provided feedback (5 min)
3. Each member separately refined his/her ideas thanks to the partner’s feedback (10 min)
4. The group discussed the new ideas in order to select the best one or to create a new one by merging some of their ideas (20 min).
The participants used aflipchart to sketch their ideas. Thefinal ideas with indications of possible smart objects, custom attributes and smart object behaviour were tran-scribed on a blank sheet. Thisfirst phase lasted about 1 h for every group.
The second phase was related to the SIE implemen-tation by using each of the three systems. To avoid
carry-over effect, the systems ordering was counterba-lanced according to a Latin Square design. The phase started with a demo of the first paradigm showing examples of custom attributes creation. Then, the par-ticipants had about 5 min to get familiar with the specifi-cation of some custom attributes, with the possibility to ask the facilitator for help. After the training, the group started to define the custom attributes identified in the first phase; they were also free to introduce further attri-butes conceived during the system usage. Then, they had to use such custom attributes to define ECA rules gov-erning smart-object behaviour. To simplify and lighten the ECA rule creation, whose validity had already been assessed in previous experiments (Desolda, Ardito, and Matera2017), the participants were asked to write down the ECA rules on a paper sheet, where empty sche-mas of rules were reported. This phase lasted 15 minutes. In the end, theyfilled in an online questionnaire about the system they had used. Before repeating the same pro-cedure with the next system, the group was invited to relax for 5 min. Finally, a paper questionnaire was admi-nistered to compare user satisfaction with the three sys-tems. It lasted for about 90 min.
At the end of each day, once all the three groups had completed the second phase, a focus group was con-ducted with all the 6 participants. Topics like the experi-ence in using the systems, in working in a group, in creating SIEs were discussed.
The experimental study took place in quiet university rooms. In order to create an environment familiar to the participants, the rooms were enriched by placing on desks and shelves material typical of archaeologist’s offices: books, objects, tools used in the archaeological investigation process, pictures of excavation campaigns tagged with QR codes. The three rooms were identically equipped. In each of them, the apparatus for one of the three systems was previously installed.
The procedure was preliminarily assessed by a pilot study involving three participants different from those considered in the experimental sample.
4.3. Data collection
Both quantitative and qualitative data were collected through (1) the reports of the SIEs participants created during the first conception phase, (2) the notes taken by the observer on significant behaviours or externalised comments of the participants during the three phases, (3) the answers to the questionnaires the participants filled in during the study. All the interactions and focus group discussions were audio-video recorded.
Initially, the participantsfilled in a questionnaire for collecting demographic data and their competences on
IT, especially on using smartphones, smart objects and interactive displays.
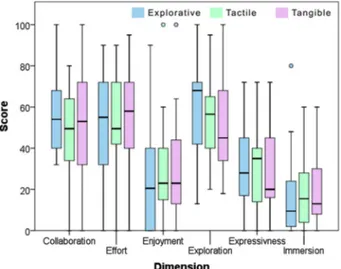
A second questionnaire, organised in 5 sections, was used to evaluate each system during the second phase. The first section included the AttrakDiff questionnaire consisting in 28 seven-step items whose poles are oppo-site adjectives (e.g.‘confusing – clear’, ‘unusual – ordin-ary’, ‘good – bad’). It is based on a theoretical work model illustrating how the pragmatic and hedonic qual-ities influence the subjective perception of attractiveness giving rise to consequent behaviour and emotions. In par-ticular, the following system dimensions are evaluated: (i) Pragmatic Quality (PQ): describes the usability of a sys-tem and indicates how successfully users are in achieving their goals using the system; (ii) Hedonic Quality– Stimu-lation (HQ-S): indicates to what extent the system sup-ports those needs in terms of novel, interesting, and stimulating functions, contents and interaction- and presentation-styles; (iii) Hedonic Quality – Identity (HQ-I): specifies to what extent the system allows user to identify with it; (iv) Attractiveness (ATT): describes a global value of the system based on the quality perception. The second section included the Creativity Support Index (CSI), a psychometric survey to evaluate the ability of a tool in supporting users’ engagement in creative works and which aspects of creativity support may need attention (Cherry and Latulipe 2014). The CSI measures 6 dimensions of creativity support: Explora-tion, Expressiveness, Immersion, Enjoyment, Effort, and Collaboration.
The third section proposed the NASA-TLX question-naire, used as‘Raw TLX’ (Hart2006). It is a 6-item sur-vey that rates perceived workload in using a system through 6 subjective dimensions, i.e. Mental Demand, Physical Demand, Temporal Demand, Performance, Effort and Frustration, which are rated within a 100-points range with 5-point steps (lower is better). These ratings were combined to calculate the overall NASA-TLX workload index (Hart and Staveland1988).
The fourth section presented the new UES (User Engagement Scale) short-form, derived from the UES long form. It is a 12-item survey used to measure the user engagement, a quality characterised by the depth of a user’s investment when interacting with a digital sys-tem (O’Brien 2016), which typically results in positive outcomes (O’Brien, Cairns, and Hall 2018). This tool measures user engagement by summarising an index that ranges from 0 to 5. It also provides detailed infor-mation about four dimensions of user engagement, i.e. Focused Attention (FA), Perceived Usability (PU), Aes-thetic Appeal (AE) and Reward (RW).
The last section had two open questions about what participants liked and disliked about the system.
The third questionnaire was administered at the end of the second phase, i.e. when the participants had used all the three systems. It evaluated the participant’s satisfac-tion asking them to rank the three systems based on their Utility, Completeness and Ease of use (from 1 to 3, 1 is the best), and to vote for the best system.
It is worth noticing that the results of the analysis of the qualitative data collected during thefirst conception phase, the notes taken by the observer during the three phases, the CSI and the third questionnaire are reported in (Ardito et al.2018). In this article, we concentrate on the data collected through the second questionnaire. In addition, a further analysis was performed also consider-ing the CSI and the data comconsider-ing from the third question-naire in order to identify possible trade-offs among the different analysis dimensions in relation to the design of smart environments.
One-way repeated measures ANOVAs (all Green-house–Geisser corrected) with posthoc pairwise com-parisons (Bonferroni corrected) were adopted to analyse CSI, NASA-TLX, AttrakDiff and UES results and some efficiency measures, such as the number of smart objects and custom attributes involved in the cre-ated SIEs. Friedman test was adopted to analyse differ-ences in the system ranking, with Wilcoxon signed-rank test used as posthoc pairwise comparisons. A Pear-son product-moment correlation was used to determine, for each system, the relationship between CSI scores with the number of custom attributes and the number of smart objects. A p-value < .10, instead of the generally accepted significance level of .05, was considered as a threshold for statistically significant results for all the previous tests. In this way we were able to capture trends that otherwise would have been discarded (Fisher1992).
4.4. Analysis and results
4.4.1. Support to creative design of SIEs
By using the CSI questionnaire, we measured the percep-tion that participants had about the creativity support. The three systems obtained a CSI score close to 80/ 100, which means very good support for creative design of SIEs (Explorative x̅ = 80.25, SD = 11.56; Tangible x̅ = 78.79, SD = 13.55; Tactile x̅ = 78.25, SD = 13.47, see
Figure 4), without significant differences (F(1.994, 33.901) = .178, p = .837, partial η2= .010). The mean and the standard deviation of the CSI dimensions for each system were reported in Table 1 and depicted in
Figure 5.
For the Exploration dimension, a significant differ-ence emerged (F(1.941, 33.000) = 2.744, p = .080, partial η2= .139). However, post-hoc test was not able to detect
notable result is that the Explorative system score resulted higher than the one of the Tangible system (+11.556 points, SE = 5.228, p = 0.123), but with a p-value slightly greater than the 0.1 threshold. Thus, we consider this as a positive trend in favour of the Explora-tive system. No differences emerged for the other dimen-sions, i.e. Collaboration (F(1.964, 33.394) = .757, p
= .475, partialη2= .043), Effort (F(1.826, 31.045) = .253, p = .758, partial η2= .015), Enjoyment (F(1.995, 33.918) = .918, p = .409, partialη2= .051), Expressiveness (F(1.487, 25.277) = .323, p = .663, partialη2= .019), and Immersion (F(1.831, 31.124) = .539, p = .573, partialη2 = .031).
Inspired by (Oppezzo and Schwartz2014), a further analysis was carried out. It considered two variables as possible indicators capable of objectively representing how creative an SIE design process is: (i) the number of useful CAs and (ii) the number of useful smart objects. In both cases, ‘useful’ indicates those CAs and smart objects that participants actually included in theirfinal SIE. Indeed, almost 10% of smart objects and CAs con-ceived during the ideation phases were not used in the SIEs. By observing the participants during the use of the systems, we identified that the main reason for not exploiting these elements was that the three systems stimulated participants to generate new ideas till the point that some of them revised their initial SIE idea and replaced some of the original smart objects and CAs with new ones. This happened, for example, when the dice of the Tangible system suggested to gamify the SIE. We also considered the number of ECA rules as the third indicator for creativity (x̅= 4.2, SD = 2.38, min = 2, max = 8). However, we observed that the initial pool of rules created by each group during the ideation phase did not change throughout the use of the three systems. The only exception was that one group introduced a new rule as the group members decided to gamify the SIE. A possible explanation is that the study setting and system usage stimulated participants to focus especially on CAs and smart objects. Thus, due to the time con-straints of each system interaction (15 min), they did not have the time to focus also on ECA rule enhancement. Groups specified a larger set of attributes when using the Explorative system (Explorative x̅ = 6.88 SD = 3.78, Tactile x̅ = 4.22 SD = 1.98, Tangible x̅ = 4.55 SD = 1.66) with significant statistical differences (F(1.277, 91.333) = 3.328, p = .094, partial η2= .294). In particular, the Explorative score resulted higher than the one of the Tac-tile (+2.667 attributes, SE = .986, p = .081). No difference emerged in the other pairwise comparisons.
The number of smart objects considered in the SIE was similar while using the three systems (Explorative x̅ = 3.22 SD = 1.86, Tactile x̅ = 2.55 SD = .73, Tangible x̅ = 2.55 SD = .73), without significant differences (F(1.181, 9.449) = 1.067, p = 342, partialη2= .118).
We also investigated existing correlations between the CSI results and the number of defined custom attri-butes (CAs)/smart objects involved in the SIEs. A signifi-cant correlation emerged for the Tangible system between the CSI score and number of smart objects (r
Figure 4.CSI scores for each system. Higher score is better.
Table 1.Mean and the standard deviation of the CSI dimensions for the three systems.
Explorative Tactile Tangible
Mean SD Mean SD Mean SD
Collaboration 55.67 18.87 48.83 24.81 51.78 27.81 Effort 51.39 26.04 49.78 27.73 53.72 27.20 Enjoyment 24.17 24.05 31.00 23.81 30.00 26.66 Exploration 61.83 24.28 54.61 19.29 50.28 22.63 Expressiveness 30.50 18.71 32.50 21.66 29.50 20.19 Immersion 17.22 20.94 18.06 15.37 21.11 19.79
Figure 5.Scores for each CSI dimension of the three systems. Higher score is better.
= .394, p = .05). In the rest of the cases, there were no statistically significant correlations for the Explorative (CA: r = .268, p = .141; smart objects: r = .286, p = .125), Tactile (CA: r = .175, p = .244; smart objects: r = .050, p = .422) and Tangible (CA: r = .251, p = .157) systems.
4.4.2. User eXperience (UX)
An overview of the AttrakDiff results is represented by the portfolio diagram shown inFigure 6, which summar-ises the hedonic (HQ) and pragmatic (PQ) qualities of the three systems according to the respective confidence rectangles. The bigger the confidence rectangle, the less the certainty on the region it belongs to. It is evident that the performance of the three systems is quite similar and very good. The systems have a high HQ and PQ and are classified as desirable products, a very promising UX. A slight difference occurs between the Explorative and Tangible systems: thefirst one has a lower PQ but higher HQ, meaning that its usability is slightly lower than the other systems but the users felt anyway playful sen-sations while interacting with it.
Details about the mean and the standard deviation of the AttrakDiff dimensions for each system are reported in Table 2 and depicted in the diagram of Figure 7. The ANOVA test revealed that there are no statistically significant differences in PQ (F(1.711, 29.090) = 1.226, p = .306, partial η2= .067), HQ-I (F(1.998, 33.796) =.354, p = .703, partial η2= .020), HQ-S (F(1.75, 29.754) = 1.166, p = .320, partialη2= .064) and ATT (F (1.71, 29.078) = .838, p = .426, partialη2= .047).
4.4.3. User engagement
UES short-form provided indications about the sys-tems’ user engagement.Figure 8shows the UES indexes
of the three systems (Explorative x̅ = 4.02, SD = .57; Tangible x̅ = 4.11, SD = .54; Tactile x̅ = 4.18, SD = .48). There are no statistically significant differences between them (F(1.796, 30.524) =1.595, p = . 220, par-tialη2= .086).
Figure 6.Portfolio diagram depicting AttrakDiff results of the three systems.
Figure 7.Average values of the three systems detailed for PQ, HQ-I, HQ-S and ATT dimensions (Y scale ranges from 1 to 7, we reduced the Y scale to improve the graph readability). Higher score is better.
Table 2. Mean and the standard deviation of the AttrakDiff dimensions for the three systems.
Explorative Tactile Tangible Mean SD Mean SD Mean SD Attractiveness (ATT) 5.91 .71 6.15 .61 5.94 .56 Hedonic quality– identity (HQ-I) 5.21 .67 5.02 .59 5.10 .65 Hedonic quality– stimulation
(HQ-S)
5.48 .63 5.42 .58 5.16 .75 Pragmatic quality (PQ) 5.15 .77 5.40 .66 5.46 .68
A more detailed analysis was also carried out to inves-tigate systems differences with respect to the UES dimen-sions. The mean and the standard deviation of the UES dimensions for each system were reported inTable 3.
Figure 9depicts the UES scores of each system calcu-lated on each dimension. The ANOVA test demon-strated that there are no statistically significant differences between the three systems in term of AE (F (1.483, 25.216) = 1.840, p = .186, partial η2= .198), FA (F(1.907, 32.427) = .238, p = .779, partial η2= .014), PU (F(1.336, 23.216) = 2.096, p = .157, partial η2= .110) and RW (F(1.270, 21.593) = 1.539, p = .234, partial η2 = .083). 4.4.4. Workload
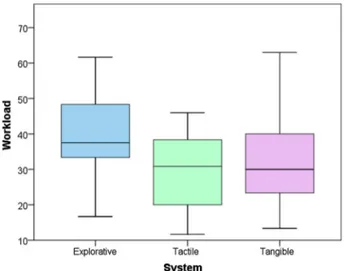
The workload data gathered through the NASA-TLX are depicted inFigure 10(Explorative x̅ = 38.24, SD = 12.21;
Tangible x̅ = 33.04, SD = 12.43; Tactile x̅ =29.87, SD = 10.30). The ANOVA test revealed a significant difference between the three systems (F(2, 34) = 4.187, p = .024, partialη2= .198), and a posthoc analysis identified a sig-nificant difference of 8.37 points (SE = 2.992, p < .05) between the Tactile and the Explorative systems.
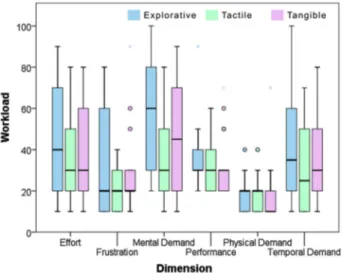
The mean and the standard deviation of the NASA-TLX dimensions for each system were reported in
Table 4and depicted inFigure 11.
A significant difference emerged for the Mental Demand dimension (F(1.791, 30.441) = 3.558, p = .045) and a post-hoc analysis revealed that the Tactile system was scored better than the Explorative one, with a differ-ence of 19.44 points (SE = 8.063, p = 0.082). No signifi-cant differences emerged for Effort (F(1.515, 25.759) = 1.377, p = .265, partial η2= .075), Frustration (F(1.944, 33.048) = 1.634, p = .211, partialη2= .088), Performance (F(1.885, 32.052) = .328, p = .710, partial η2= .019), Physical Demand (F(1.274, 21.665) =.126, p = .787, par-tialη2= .007) and Temporal Demand (F(1.509, 25.654) = 2.457, p = .117, partialη2= .126).
4.4.5. Satisfaction
The third questionnaire revealed differences on how the participants considered the systems in relation to
Figure 8.The boxplot chart depicting UES score results of the three systems. Higher score is better.
Table 3.Mean and the standard deviation of the UES dimensions for the three systems.
Explorative Tactile Tangible Mean SD Mean SD Mean SD Aesthetic appeal (AE) 4.17 .75 4.46 .54 4.15 .68 Focused attention (FA) 3.46 .41 3.37 .53 3.33 .58 Perceived usability (PU) 3.89 .65 5.42 .58 3.91 .49 Reward (RW) 3.59 .96 3.96 .73 5.46 .68
Figure 9.The boxplot chart depicting UES score dimensions of the three systems. Higher score is better.
Figure 10.NASA-TLX workload of the three systems. Lower score is better.
Completeness, Utility and Ease of Use and their overall preference on one of the three systems.
Regarding the Completeness, the Explorative and Tac-tile were considered the best systems (Explorative x̅ = 1.72, Tactile x̅ = 1.78, Tangible x̅ = 2.50), with some sig-nificant difference (χ2(2) = 7.778, p = .034): Tactile was
significantly better than Tangible (Z = −1.960, p = .050) and Explorative was significantly better than Tangible (Z = 2.854, p = .004). Regarding the Utility, the Explora-tive and Tactile were considered the best systems (Explorative x̅ = 1.83, Tactile x̅ = 1.78, Tangible x̅ = 2.39), with significant differences (χ2 (2) = 4.111, p
= .128), even if the p-value was slightly greater than the 0.1 threshold: the Tactile system was perceived better than Tangible (Z =−.824, p = .068). Regarding the Ease of Use, the system rankings were quite similar (Explora-tive x̅ = 1.89, Tactile x̅ = 2.06, Tangible x̅ = 2.06) without significant differences (χ2(2) = .333, p = .846).
These results are coherent with the way participants voted for the best system: the Tactile got 9 votes, the Explorative 6 votes and the Tangible 3 votes.
4.5. Threats to validity
In this section, we analyse some issues that may threaten the validity of the experimental study, also to highlight
under which conditions the study design offers benefits that can be exploited in other contexts, and under which circumstances it might fail.
Internal validity. Internal validity can be threatened by some hidden factors compromising the achieved conclusions:
Learning effect. In our experiment, this factor was minimised by counterbalancing the order of the systems according to a Latin Square design.
Subject experience. It was alleviated by the fact that none of the subjects had any experience with the experi-mented systems, as well as with similar systems in general.
Available time. Participants had 15 min to design their SIEs by using each system. The pilot study had shown that 15 min are adequate to implement most of the designed ideas and to provide significant feedback on the design experience. All of the participants entirely exploited the available times. Having more time would possibly allow them to implement more details and to enhance, for example, the ECA rules defined during the ideation phase. However, due to the within-subject design, we constrained the time to not overload partici-pants with too much work that could induce them in downgrading their performance and perceptions, thus determining useless results.
Subject-expectancy effects. Students are not the best participants for an experimental study due to the sub-ject-expectancy effect they can produce, i.e. a form of reactivity that occurs when a research subject expects a given result and therefore unconsciously affects the out-come. We mitigated this effect by masking details that could produce bias. In particular, we presented the experiment to the participants in a way that suggests that we had no stake in the outcome. For example, we introduced all the experimental systems as already avail-able tools that we wanted to analyse during the creation of SIEs; furthermore, in order to foster the credibility of this aspect, we developed our systems with a professional look-and-feel.
Method authorship. We eliminated the biases that different facilitators running the experiment could intro-duce, as we had the same instructor for every session of the study. In this way, we avoided any variability in the initial training as well as in the way participants had been observed.
Information exchange. Since the study took place over 3 days, it is difficult to be certain whether the involved subjects did not exchange any information. However, the participants were recruited during the exams period thus, for many of them, it was difficult to communicate. The participants were asked to return all the material (e.g. the booklet) at the end of each session. Participants
Table 4. Mean and the standard deviation of the NASA-TLX dimensions for the three systems.
Explorative Tactile Tangible Mean SD Mean SD Mean SD Effort 43.33 24.73 36.11 20.62 37.22 22.18 Frustration 32.22 26.69 21.67 10.43 27.78 20.45 Mental demand 57.78 25.33 38.33 21.49 48.33 25.72 Performance 35.56 16.53 33.33 12.83 33.33 14.55 Physical demand 18.89 8.32 19.44 9.98 17.78 14.37 Temporal demand 41.67 25.50 30.56 19.24 33.89 22.27
Figure 11.NASA-TLX dimensions workload of the three systems. Lower score is better.
who typically study and travel together were involved in the same study session.
Study venue. In order to create an environment fam-iliar to the participants, the rooms, where the experimen-tal study was carried out, were enriched with material typical of archaeologist’s offices and other possible objects and tools that could be included in the SIE to be designed, included pictures of excavation campaigns tagged with QR codes, necessary for the Explorative sys-tem. However, we do acknowledge that performing the study in a natural environment, such as an archaeologi-cal museum, would probably have provided more lever-age to the participants’ creativity. Such a stimulus would have been particularly beneficial for the Explorative system.
Understandability of the material. A pilot study invol-ving three more participants was performed to evaluate the system reliability and the research methodology (e.g. time constraints, coding techniques, video-record-ing activities), as well as the understandability of exper-imental procedures and materials.
External validity. refers to the possible approximation of truth of conclusions in the attempt to generalise the results of the study in different contexts. With this respect, the main threats of our study are:
Participants’ age and domain experience. Since the study participants were young students not experienced with IoT and systems for SIE design, we have to take into account two potential limitations of the study results. The first one is the participants’ age that limits the prediction of the benefits of the systems to older people. Thus, we can safely accept the experiment results for digital natives (Prensky 2001) but further studies have to be carried out including older people. The second potential limitation is related to the participants’ domain experience. Rather than students of the Bachelor’s or Master’s degree in archaeology, the perfect participants would have been professional guides with experience in conducting guided tours, familiar with and able to mas-ter cutting-edge technologies. In our initial studies con-ducted to preliminarily assess the validity of the domain-oriented semantics (Ardito, Buono, et al.
2017), we already involved professional guides. Unfortu-nately, it is very hard to recruit people with this back-ground with a statistically significant numerousness. Thus, students with a background in archaeology rep-resented the best choice that mediates the need of ade-quate skills and a large sample. To mitigate this problem, we chose a theme of the exhibition consistent with the skills of archaeology students, i.e. the exhibition of tools they use regularly during their activities. In addition, we tried to include in as many pairs as possible a participant who had experience as a guide.
Validity across different domains. The scenario used for the study exclusively focused on the Cultural Heri-tage domain. This could have limited the research findings, especially in relation to the discussed trade-offs. Further studies considering different domains are needed to extend the validity of the results.
SIE Complexity. The scenario used for the study asked participants to act as curators of a museum. It was designed with the help of professional guides that took into account the participants’ skills and age. Thus, the obtained results and the proposed design indications are valid for a particular class of scenarios, i.e. SIEs for the arrangements of traditional exhibitions. More com-plex and significant scenarios need to be evaluated.
SIE Design Process. The SIE design is a three-phase process consisting of (1) conception of a high-level idea of the SIE, (2) creation of custom attributed for the SIE and (3) definition of ECA rules. Since the brain-storming phase at the beginning of the process is not affected by the use of a specific design paradigm, and we already assessed the validity of the ECA rule creation paradigm (Desolda, Ardito, and Matera 2017), we iso-lated the only variable not yet validated that could impact on the process, i.e. the custom attributes creation. Since we had a within-subject design, in order to lighten the participants’ workload, we focused on the custom attribute creation phase, by comparing the three systems proposed in this paper. To cover the remaining process, we included the ideation phase only once before the use of the three systems, and we asked participants to write down the ECA rules on a paper sheet, according to the schemas of rules supported by our system for ECA rules (Desolda, Ardito, and Matera2017).
Resulting SIE. This paper focuses on the design of SIEs; the quality of the resulting SIE was intentionally not evaluated. Anyway, as a future step, it is important also to assess the SIE quality, to deeply understand how the adoption of one of the three systems impacts the final result. In this direction, we already planned other sessions to design SIEs implementing different scenarios, with the aim to evaluate the overall design pro-cess and thefinal SIE from the perspective of SIE final users, i.e. museums visitors in our scenario.
Technological Solutions. The three systems evaluated in this study adopt specific technological solutions that we considered as adequate for the purpose of the design paradigms. However, these specific technological fea-tures can impact on the SIE design and the results that can be achieved when using the systems. For example, participants suggested that a tablet could be a more ade-quate device for the Explorative system since it can facili-tate the exploration phase. For the Tactile system, the display size affects the workspace overview thus
determining a different design experience. In general, we need to better characterise the impact that the techno-logical features characterising our systems have on the design process, in order to generalise the results of the study to a broader range of devices or to technology classes, and make them more independent from the specific technology.
Conclusion validity. Conclusion validity refers to the validity of the statistical tests applied for the analysis of the collected data. In our study, this validity was ensured by applying the most common tests that are traditionally employed in Empirical Software Engineering (Juristo and Moreno2013). It is worth remarking that the signi fi-cance level we used in this paper (p < .1) is slightly less strict than the conventional ones (p < .05 or p < .01). This because the overall goal of this research is to identify trends and trade-offs between the analysed dimensions of the three systems (Fisher1992); the higher threshold thus allowed us to consider also those results with p-values in the range 0.1–0.05, which still highlight trends.
5. Emerging trade-offs
Given the results illustrated above, we investigated whether any correlation occurred, to understand in which extent each analysis dimension was related to the others. To this aim, we compared all the dimensions deriving from the questionnaires: (1) Creativity from CSI, (2) Workload from NASA-TLX, (3) UX from AttrakDiff, (4) Engagement from UES, and (5) Satisfac-tion (decomposed in Utility, Completeness, Ease of Use). We also considered an additional dimension we call (6) Ecology of the system, which emerged during the focus group discussions and relates to the ease of deployment of the systems in real design settings, also considering their cost-effectiveness (Ardito et al. 2018). The analysis of the Ecology dimension reported in the following is an estimation that took into account both the participants’ comments and an analysis of factors like costs and physical space required by the system installation. The Ecology ranges from 0 to 100, where
high values indicate systems that are very cheap and easy to be installed, while lower values indicate systems that are expensive and require technical skills to be installed.
Since questionnaires adopt different scales, to facili-tate the comparison of the resulting data we (1) nor-malised their values in the same interval (0–100) and (2) adjusted all the scales polarity so that higher scores indicate positive values. For AttrakDiff, we nor-malised the native scale, which ranges from 0 to 7, in the 0–100 interval. Similarly, we normalised the UES scale, which natively ranges from 0 to 5, and the Uti-lity, Completeness, Ease of Use scales that range from 0 to 3. No adjustments were required for CSI. In the end, the polarity of the NASA-TLX values was inverted because, natively, a higher score means a higher workload. Thus, in the remaining of this sec-tion, higher NASA-TLX values indicate light workload and vice versa.
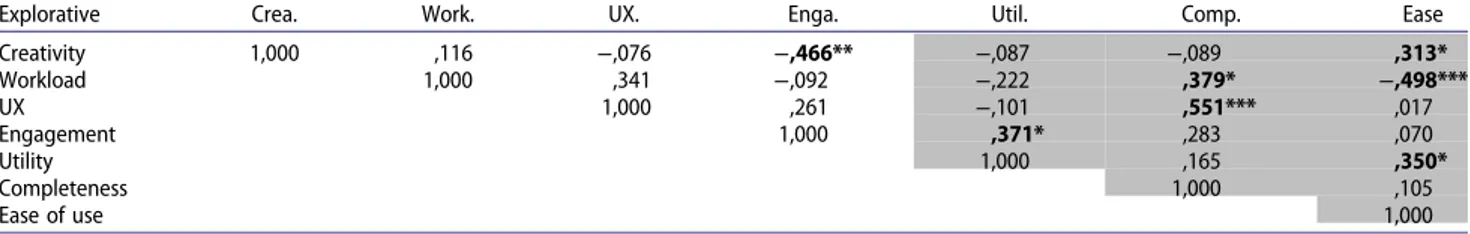
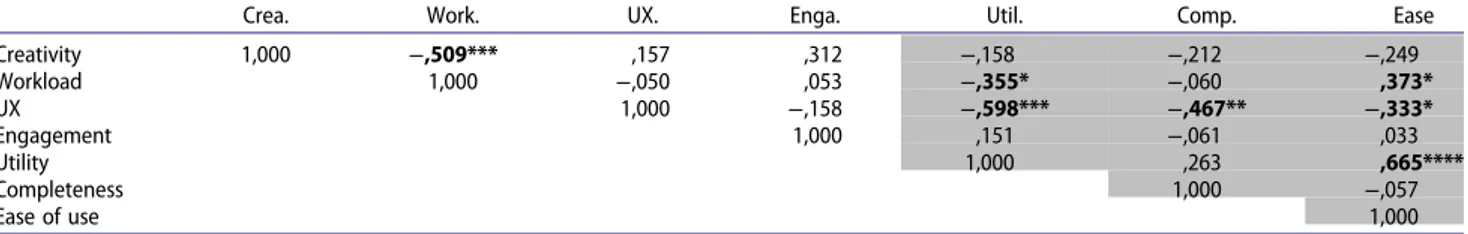
These dimensions were analysed to find significant correlations. In particular, the Pearson correlation coeffi-cient was used to find, for each system, significant relationships between Creativity, Workload and UX, while the Spearman correlation coefficient was used to identify relationships between the previous dimensions and Utility, Completeness and Ease of Use.1 Both tests were one-tailored. Tables5–7report the resulting corre-lations for each system. Cells in white report the Pearson results while those ones in light-grey show Spearman results. Values in bold indicate significant correlations at the confidence levels p < 0.1 while the number of aster-isks indicates the strength of the correlations (1 for low strength ranging from 300 to 399, 2 for medium strength ranging from 400 to 499, 3 for high strength ranging from 500 to 599, 4 for very high strength ranging from 600 to 699). Negative significant correlations have been considered to identify trade-offs.
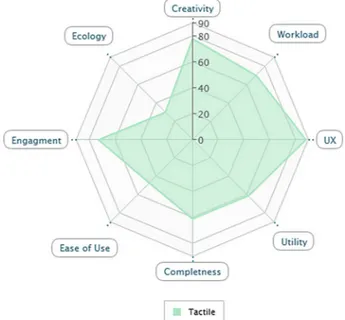
The next sub-sections discuss for each system the resulting trade-offs analysing the negative relationship existing between the quality dimensions, whose values are also depicted in radar-charts.
Table 5.Correlation strength among all the evaluation dimensions of the Explorative system.
Explorative Crea. Work. UX. Enga. Util. Comp. Ease
Creativity 1,000 ,116 −,076 −,466** −,087 −,089 ,313* Workload 1,000 ,341 −,092 −,222 ,379* −,498*** UX 1,000 ,261 −,101 ,551*** ,017 Engagement 1,000 ,371* ,283 ,070 Utility 1,000 ,165 ,350* Completeness 1,000 ,105 Ease of use 1,000
* for low strength ranging from 300 to 399. ** for medium strength ranging from 400 to 499. *** for high strength ranging from 500 to 599. **** for very high strength ranging from 600 to 699.
5.1. Explorative system
The most evident trade-offs in the correlation analysis are between Ease of Use vs Workload (rs(18) =−.498, p = .018),
as well as between Creativity vs Engagement (r =−.466, n = 18, p = .026), reported in bold inTable 5. Figure 12
reports a radar chart visualising all the dimensions scores of this system.
Regarding the first trade-off (Ease of Use vs Work-load), the Explorative system was perceived as easy to be used as the other ones. However, as shown by the negative correlation identified between the two dimen-sions, a heavier workload affects it. A possible expla-nation of the participants’ heavy workload can be found in the need of stopping the AR visualisation on the mobile device to open the overview window showing the already defined custom attributes and their associ-ation with the smart objects. This problem is in line with the heavy Mental Demand of this system, and it was both reported by the observers and highlighted by the participants during the focus groups.
When we designed the Explorative system, we con-sidered the possibility of using a device with a larger dis-play, i.e. a tablet, in order to visualise at the same time the status of the custom attribute definition and the AR mode to discover new custom attributes. We eventually came to the conclusion that sharing the screen between the workspace status and the AR visualisation would make more difficult the exploration of the surrounding
environment. Summing up, even though the AR mode fulfils the ‘Collect’ design principle for Creative Support Tools (Shneiderman2007), the decision to simplify the visualisations to privilege the AR exploration worsens the workload (in particular, Mental Demand) due to the separate workspace overview. In other words, the
Table 7.Correlation strength among all the evaluation dimensions of the Tangible system.
Crea. Work. UX. Enga. Util. Comp. Ease
Creativity 1,000 −,509*** ,157 ,312 −,158 −,212 −,249 Workload 1,000 −,050 ,053 −,355* −,060 ,373* UX 1,000 −,158 −,598*** −,467** −,333* Engagement 1,000 ,151 −,061 ,033 Utility 1,000 ,263 ,665**** Completeness 1,000 −,057 Ease of use 1,000
* for low strength ranging from 300 to 399. ** for medium strength ranging from 400 to 499. *** for high strength ranging from 500 to 599. **** for very high strength ranging from 600 to 699.
Figure 12.Radar chart that summarises all the evaluation dimen-sions for the Explorative system.
Table 6.Correlation strength among all the evaluation dimensions of the Tactile system.
Tactile Crea. Work. UX. Enga. Util. Comp. Ease
Creativity 1,000 ,158 ,065 ,063 −,127 −,281 −,018 Workload 1,000 ,121 ,113 −,067 −,244 −,381* UX 1,000 ,251 ,017 −,023 −,355* Engagement 1,000 −,123 ,042 −,307 Utility 1,000 ,344* ,641**** Completeness 1,000 ,340* Ease of use 1,000
* for low strength ranging from 300 to 399. ** for medium strength ranging from 400 to 499. *** for high strength ranging from 500 to 599. **** for very high strength ranging from 600 to 699.