U
NIVERSITÀ
D
EGLI
S
TUDI
D
I
S
ALERNO
F
ACOLTÀ
D
I
S
CIENZE
M
ATEMATICHE
F
ISICHE E
N
ATURALI
D
OTTORATO DI RICERCA IN
I
NFORMATICA
C
ICLO
X
T
ESI DI
D
OTTORATO
“From GeoVisualization to visual-analytics: methodologies
and techniques for human-information discourse”
D
AVIDE
D
E
C
HIARA
A
DVISORC
OORDINATORE DOTTORATOD
OTT.
M
ONICAS
EBILLOP
ROF.
G
IUSEPPEP
ERSIANOA
CKNOWLEDGEMENTS
Foremost, I would like to express my sincere gratitude to my advisor Monica Sebillo for the continuous support of my Ph.D study and research, for her patience, motivation, enthusiasm.
I appreciate all her contributions of time and ideas, to make my Ph.D. experience productive and stimulating.
Besides my advisor, I would like to thank Giuliana Vitiello and the rest of my thesis committee.
I am also grateful to the LabGIS components, Luca Paolino, Enzo Del Fatto and Marco Romano for sharing ideas, experiences and food. Thanks to all my friends from Dipartimento di Matematica e Informatica of the University of Salerno, for their company, their support and for the soccer matches.
My deepest gratitude goes to my family for their unflagging love and support throughout my life.
My sincere thanks also goes to my friends and colleagues of studio 22 and studio 6 for all the banquets and dinners spent to discuss serious and not serious issues.
I would not thank the Berlusconi government and Maria Stella Gelmini, (ex) Minister of Education, for her ignorant and stupid law, in particular for the construction of a tunnel between the Gran Sasso National Laboratory and CERN in Switzerland.
Davide De Chiara Fisciano, February 2012
C
ONTENTS
Chapter 1 ... 11
Introduction ... 11
1.1. Problem and motivation ... 11
1.2. Research goals ... 12
1.3. Methodology and techniques for human information discourse ... 12
1.4. Relevance Of This Research ... 12
1.5. Structure of the thesis ... 12
Chapter 2 ... 17
Definition of concepts ... 17
2.1. Overview of related concepts ... 17
2.2. Complexity of geospatial data ... 18
2.3. Representation and visualization of large geospatial data ... 19
2.3.1. Information Visualization ... 19
2.3.2. GeoVisualization ... 21
2.4. Extract Information from complex geospatial data ... 22
2.4.1. Geovisual analytics ... 23
2.4.2. Knowledge Discovery & Decision-Making ... 24
Chapter 3 ... 29
Analyzing large geospatial datasets ... 29
3.1. Enhancing mobile users’ capabilities through customized GeoVisualization techniques ... 30
3.1.1. Framy-AR: beyond the Screen Map Exploration ... 30
3.1.2. Link2U: Connecting Social Network Users through Mobile Interfaces ... 31
3.2. Building a Human-(Geo)information discourse through GeoVisual Analytics techniques ... 31
3.2.1. Accessing Spatial Data through Chorematic Maps ... 32
3.2.2. Delivering Advertisements on Mobile Devices ... 32
3.2.3. TagaMap: Visually analyzing Geographical Information through Tag Clouds ... 33
Chapter 4 ... 37
Augmented Map navigation through Customizable Mobile Interfaces ... 37
4.2. The Framy-AR multimodal technique ... 38
4.3. The customization model ... 41
4.4. A working example ... 43
Chapter 5 ... 47
Connecting Social Network Users through Mobile Interfaces ... 47
5.1. The Multimodal Interaction Paradigm ... 48
5.2. Grouping Methods... 49
5.3. Scenario ... 51
5.4. Link2u@Unisa ... 53
5.4.1 The System Network... 53
5.4.2. The Client ... 54
Chapter 6 ... 59
A Chorem-based Approach for Visually Analyzing Spatial Data ... 59
6.1. Related Work ... 61
6.2. Preliminaries ... 61
6.2.1. Chorem definition and classification ... 62
6.2.2. The Architecture of the Extraction and Visualization System (ChEViS) ... 65
6.2.3. ChorML structure ... 66
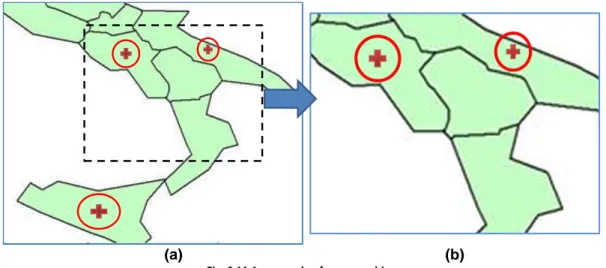
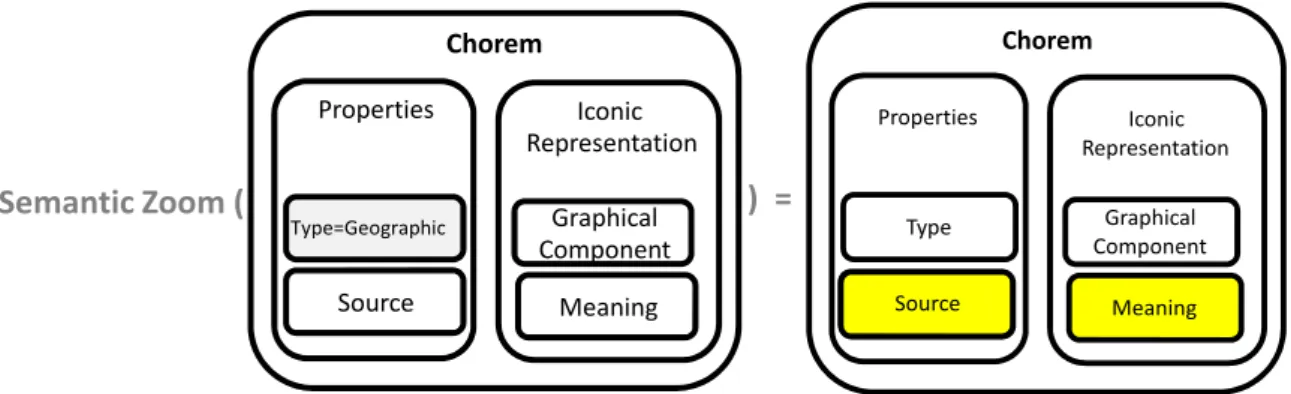
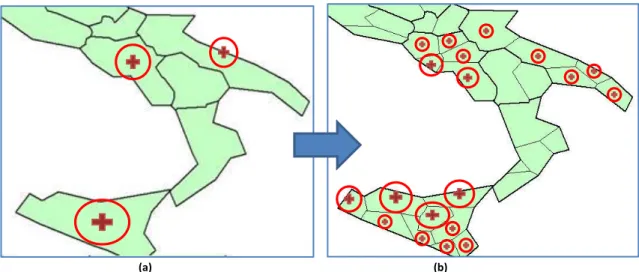
6.3. Accessing Spatial Data through Chorematic Maps ... 68
6.3.1. Zooming and filtering a chorematic map ... 69
6.4. Extending ChorML to Perform Visual Analytics Tasks ... 74
6.4.1. The extended version of ChorML ... 75
6.4.2. The Analysis of migrating flows of population through a chorematic map ... 79
Chapter7 ... 89
Geomarketing Policies and Augmented Reality for Advertisement Delivery on Mobile Devices. ... 89
7.1. system overview ... 90
7.2. A dynamic user model for ads delivery ... 92
7.2.1. Long term user interest frameworks ... 92
7.2.2 Short term user interest framework ... 94
7.3. system architecture ... 95
Chapter 8 ... 101
Analyzing Geographic Information through Tag Clouds ... 101
8.1. Background ... 101
8.2. Visualizing Data Summaries by Georeferenced Clouds of Tags ... 103
8.3. The System Architecture and the TaGaMap Prototype ... 103
8.4. Performing GeoVisual Analytics by Georeferenced Clouds of Tags ... 104
8.4.1. The System Architecture and the Tag@Map Prototype ... 105
8.4.2. The Analysis of Italian Surnames performed through Tag@map ... 106
Chapter 9 ... 113 Conclusions ... 113 9.1. General discussion ... 113 9.2. Contributions ... 114 9.3. Future work ... 115 List of figures ... 116 References ... 121
C
HAPTER1
I
NTRODUCTIONRecent estimates suggest that 80% of all digital data generated today include geospatial referencing (e.g., geographic coordinates, addresses, postal codes, etc.) (MacEachren and Kraak 2001). Indeed, most researchers agree that the geographic component represents an ubiquitous factor which both is an integral part of a territory and contributes to acquire knowledge about its phenomena. This awareness has a direct implication on studies conducted within the general domain of Earth and Environmental Science, where a parameter involved in the analytical methods is now focused on place and space. As a matter of fact, researchers from those disciplines have recognized that in order to turn large heterogeneous data volumes into information, the challenge is to develop methods capable to understand patterns and relationships in geographic space along with their change over time or processes that are responsible for them. To achieve this goal, human vision and domain expertise can be exploited together with computational tools. In particular, a visual representation and computing may contribute to better motivate pattern recognition and hypothesis generation, thus allowing better understanding of structures and processes, and supporting knowledge construction.
The aforementioned activities fall in the area of GeoVisual Analytics (or geospatial visual analytics). Geovisual Analytics belongs to the GeoVisualization research field and deals with problems involving geographical space and various objects, events, phenomena, and processes populating it. It benefits from the integration of different disciplines. In fact, the adoption of visual interactive methods from GeoVisualization, and their integration with new possibilities offered by computational techniques, set the basis for effective support to data exploration and decision-making processes, due to the capability of combining geospatial information with “human vision and domain expertise” [28], [64].
1.1.PROBLEM AND MOTIVATION
The increasing volumes of geospatial data presents a difficult challenge in the exploration of patterns and relationships. With such large volumes of data, common geospatial analysis techniques are often limited in revealing patterns and relationships, a process necessary for understanding underlying structure and related real world processes.
New interactive visualization tools are being envisaged to deal with large datasets in order to synthesize information and perform complex analytical tasks. Along this line, our research efforts have been focusing on new cartographic approaches which could support daily analysts’ work by producing synthesis and presentation of discovered patterns in a concise and understandable way (Openshaw 1997). In order to decide the class to which the pattern belongs, common classification or pattern recognition methods are used to compare the unknown pattern with all known reference patterns, on the basis of some criteria for the similarity degree. These techniques are difficult to apply in the case of unknown data, as it is not obvious what mechanisms or rules are behind data of interest. New approaches in exploratory geospatial data analysis and visualization are needed to effectively extract patterns and relationships, and represent such data in a visual form that can better stimulate exploration, pattern recognition and hypothesis generation, as well as allow better understanding of structures and processes and support knowledge construction.
1.2.RESEARCH GOALS
The objective of our research is to give support to decision makers when facing problems which require rapid solutions in spite of the complexity of scenarios under investigation. In order to achieve this goal our studies have been focused on GeoVisualization and GeoVisual Analytics research field, which play a relevant role in this scope, because they exploit results from several disciplines, such as exploratory data analysis and GIScience, to provide expert users with highly interactive tools by which they can both visually synthesize information from large datasets and perform complex analytical tasks.
The research we are carrying out along this line is meant to develop software applications capable both to build an immediate overview of a scenario and to explore elements featuring it. To this aim, we are defining methodologies and techniques which embed key aspects from different disciplines, such as augmented reality and location-based services. Their integration is targeted to realize advanced tools where the geographic component role is primary and is meant to contribute to a human-information discourse.
1.3.METHODOLOGY AND TECHNIQUES FOR HUMAN INFORMATION DISCOURSE
To address the abovementioned research issues, a methodology is proposed. It includes a paradigm for visual representation and navigation along with Geovisualization techniques aiming at experimenting it in different domains.
Moreover, a theoretical basis has been defined for enhancing the role of visual metaphors by associating them with a composite structure capable to store different levels of summarized data. This enhancement is intended to offer alternative and different views of the data and stimulate the visual thinking process characteristic of visual exploration. Moreover, it aims to support advanced analytical tasks through the use of appropriately specified operators.
1.4. RELEVANCE OF THIS RESEARCH
The results of this research are new and they are relevant to perform analytical tasks and discovery knowledge from geographical databases. It advances the technological solutions for the wider scope of Geographic Information and provides sample cases, which document knowledge discovery from spatial databases by using GeoVisualization methods in that context. As a matter of fact, by applying such methods this research supports the process of planning and makes it a tool for human information discourse. This could be considered a preliminary work for building models and provides a relevant contribution to the development of advanced spatial analysis applications that can be exploited also through mobile devices. In particular, given the mobile device pervasiveness they could help decision makers handle emergency situations and crisis evolution by on site tools.
1.5.STRUCTURE OF THE THESIS
To carry out the research goals set out above, a research plan was implemented. These activities are reported in the different chapters of the dissertation, as follows.
Chapter 1: Introduction - This chapter provides an introduction to the scope of the research, the research problem, the relevance of the topic, the context, the objectives, and the research questions.
Chapter 2: This Chapter is meant to introduce the context of this dissertation, which is based on several topics, namely GIScience, Geoinformation, Visual Analytics and GeoVisualization, Decision-Making and Knowledge Discovery.
Chapter 3: This Chapter emphasizes how each specific result has a proper collocation within the whole management process of geospatial data.
Chapter 4: This chapter contains detail on how chorems are able to visually summarize database content. A definition and a classification of chorems, meant both to homogenize chorem construction and usage and to provide a usable framework for computer systems, is provided.
Chapter 5: A technique to enhance user’s navigation activities with mobile devices using augmented reality is proposed.
Chapter 6: Link2U, an integrated solution for mobile devices which combines the potential of augmented reality with the ability to “communicate” of the social network is presented.
Chapter 7: An approach for presentation of personalized ads on mobile devices, based on a user model that takes into account user’s interests over time is illustrated.
Chapter 8: We propose a GeoVis method based on a recent InfoVis technique, known as Tag Cloud, which combines tag.
Chapter 9: This section summarizes the content of this thesis, highlighting the contribution research and discusses possible scenarios for the future work.
C
HAPTER
2
D
EFINITION OF CONCEPTSThis chapter is targeted to recall fundamentals of topics belonging to the wide scope of this dissertation. Moreover, it traces a link among the key concepts of the involved topics in order to both help understand how the research evolves and provides an overview about the whole research field on Geographic Information. To this aim, in the following the state of play and some basic results on specific topics are discussed, namely GIScience, Geoinformation, Geovisual Analytics and GeoVisualization, Decision-Making and Knowledge Discovery.
2.1.OVERVIEW OF RELATED CONCEPTS
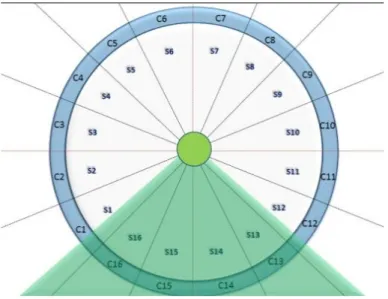
The scope of this research includes several disciplines. Figure 2.1 suggests an organization of their basic concepts around the proposed research area. It indicates the extent of this research in a light gray circle and the core scope with a gray circle. Core concepts and fields are illustrated which involve GIScience, Geoinformation, Visual Analytics and GeoVisualization, Decision-Making and Knowledge Discovery. Individual concepts are arranged around these core fields. The boundary between these fields is fuzzy and is indicated by a dashed line.
Fig 2.1 Organization of concepts around the proposed research areas
Within this general overview, specific concepts are identified and elaborated. The wide fields of knowledge discovery and decision-making are not included as separate fields, they are integrated as important supporting concepts.
The research starts from Geographic Information Science (or GIScience) that is the science behind the GIS technology. An initial definition by Goodchild describes GIScience as a “science which deals with generic issues that surround the use of GIS technology, impede its successful implementation, or emerge from an understanding of its potential capabilities” (Goodchild, 1992). A full definition of GIScience was provided in a report on a workshop held in January 1999 at the National Science Foundation on Geographic Information Science: “Geographic Information Science (GIScience) is the basic research field that seeks to redefine geographic concepts and their use in the context of geographic information systems. GIScience
also examines the impacts of GIS on individuals and society, and the influences of society on GIS. GIScience re-examines some of the most fundamental themes in traditional spatially oriented fields such as geography, cartography, and geodesy, while incorporating more recent developments in cognitive and information science. It also overlaps with and draws from more specialized research fields such as computer science, statistics, mathematics, and psychology, and contributes to progress in those fields. Based on this definition it is a multidisciplinary field, which includes many disciplines that have traditionally researched geographic information technologies (like cartography, remote sensing, geodesy, surveying, photogrammetry, and image processing) and disciplines that have traditionally researched digital technology and information, in general (e.g., computer science, particularly: databases, pattern recognition, computational geometry, image processing, , information science).” (Mark, 2000)
Furthermore finally, GIScience takes into account disciplines that have traditionally investigated the Earth, particularly its surface, with regard to the earth itself or with regard to humans (e.g., biology, ecology, biogeography, environmental science, geography etc.). These are all sciences that are potential users of GIS. All these disciplines have traditionally studied the nature of human understanding and its interactions with machines.
Regarding the difference between the terms spatial and geographic, it might be suggested that geographic has to do with the earth, including its two-dimensional surface and its three-dimensional atmosphere, oceans, sub-surface. Spatial has to do with any multi-dimensional frame (e.g., engineering drawings are referenced to a mechanical object or architectural drawings are referenced to a building). Within this framework, geographic is a subset of spatial, the terms are often used interchangeably. In the literature geographic is also referred as geospatial.
The following subsections briefly introduce methodologies and techniques defined for the visual representation and analysis of geospatial data. However, an initial discussion focused on the spatial data complexity is given, in order to explain why specific approaches are necessary for geospatial data design and management.
2.2.COMPLEXITY OF GEOSPATIAL DATA
To convey valuable information, data must be prearranged, transformed and presented in a way that gives meaning and makes them useful. To facilitate the transfer of knowledge, patterns and meanings of the information must be assimilated. Creative manipulation of data is therefore necessary to assist our understanding (Hodge and Janelle 2000). Cognitive research suggests that, by using an experimental component such as interaction, inspection, evaluation, contemplation or interpretation, meaning and deep understanding can be constructed. Rules are often generated from these processes to form intellectual skills used in problem solving, and are applied to achieve a solution to a novel situation, based on a combination of previously learned rules (Gagné 1977). This process of encoding and subsequently entering the encoded information into longterm memory is a central and critical event in the acquisition of knowledge. Information must therefore be organized or transformed into a form that is semantic or meaningful.
Information derived from geospatial data can be considered as a different type of information, due to their intrinsic structure (location, attributes and time), the semantics, and the geographic scale used (MacEachren and Kraak 2001). These characteristics are significant in geographic space and can be organized in association with geographic positions in a natural and intuitive way (maps). Complexity in geospatial data analysis arises also from the large volumes of data, underlying relationships, and the nature of geographic problems (Openshaw 2000; Miller and Han 2001; Gahegan and Brodaric 2002). The process
of geospatial data handling consists of methods and techniques used to collect and analyze data and explore insight related to the dataset in order to solve particular problems. Usually, maps are the results of this process and are used to give a visual representation of an existing phenomenon. This role of maps has changed and expanded (Kraak 2000) owing to the technological capacities for data acquisition and data processing, and the sophisticated nature of new visual representation techniques. Today, with the huge volume of data, static non-interactive maps do not satisfy the fundamental demands of exploratory data analysis (Andrienko et al. 2000). However, the many alternative interactive forms of maps which are now available and the use of dynamic links mean it can still play a key role in exploring geospatial data (Kraak 2000).
2.3.REPRESENTATION AND VISUALIZATION OF LARGE GEOSPATIAL DATA
A new form of visual representation for geographic data originated from the visualization field, which attempts to give a response to the increasing needs of users. There is a constant search for better visualization tools to allow users to benefit from geospatial analysis results, and to support the decision-making process.
Visualization is the use of computer-supported interactive visual representations of data to intensify cognition (Card et al. 1999), acquisition or use of knowledge. The cognitive support underlined in this definition is provided in six ways, by:
1. increasing the memory and processing resources available to the users, 2. reducing the search for information,
3. using visual representations to enhance the detection of patterns, 4. enabling perceptual influence operations,
5. using perceptual attention mechanisms for monitoring, 6. encoding information in a manipulable medium.
Visualization allows data and information to be explored graphically, in order to gain the understanding, insight or knowledge from complex multidimensional datasets (McCormick et al. 1987), necessary for decision-making, problem solving and explanation tasks. Visualization could also enhance the understanding of complexity, retaining user's participation through computational steering to improve the overall effectiveness of data analysis.
2.3.1.INFORMATION VISUALIZATION
Information visualization is the interdisciplinary study of "the visual representation of large-scale collections of non-numerical information, such as files and lines of code in software systems, library and bibliographic databases, networks of relations on the internet, and so forth [49]. The aim of this discipline is to enable complex systems to be better understood, better decisions to be made, and information to be discovered that might otherwise remain unknown (Card et al. 1999). Users looking at large amounts of complex data can quickly find the information they need; navigate and interact with data more easily; recognize patterns and trends; discover errors in the data; easily identify minimum and maximum values, and clusters; and obtain a better understanding of the underlying structure and processes. This is possible, for example, by grouping or visually relating information in order to reduce the search for data, or by aggregating data in order that they may be revealed through clustering or common visual properties. In general, representations used in information visualization often apply geographic metaphors to structure human-computer interaction, and are commonly referred to as spatializations or information spaces (Fabrikant 2001). This approach has then two fundamentally related aspects: structural modeling and graphical
representation (Chen 1999). The structural modeling intends to detect, extract and simplify underlying relationships, whereas the graphical representation is meant to transform an initial representation of a structure into a graphical one, so that the structure can be visually examined and interacted with.
Information visualization is concerned with the design, development, and application of computer generated interactive graphical representations of information. This often implies that information visualization primarily deals with abstract, nonspatial data. Transforming such nonspatial data to intuitive and meaningful graphical representations is therefore of fundamental importance to the field. The transformation is also a creative process in which designers assign new meanings into graphical patterns. Like art, information visualization aims to communicate complex ideas to its audience and inspire its users for new connections. Like science, information visualization must present information and associated patterns rigorously, accurately, and faithfully. A common question is the relationship between information visualization and scientific visualization. A simple answer is that they are unique in terms of their corresponding research communities. They do overlap, but largely differ. Here are some questions that might further clarify the scope of information visualization. First, is the original data numerical? Graphical depictions of quantitative information are often seen in the fields of data visualization, statistical graphics, and cartography. For example, is a plot of daily temperatures of a city for the last 2 years qualified as information visualization? The answer to this question may depend on another question: how easy or straightforward is it for someone to produce the plot? A key point to differentiate information visualization from data visualization and scientific visualization is down to the presence or absence of data in quantitative forms and how easy one can transform them to quantitative forms. This is why researchers emphasize the ability to represent nonvisual data in information visualization. Second, if the data is not spatial or quantitative in nature, what does it take to transform it to something that is spatial and visual? This step involves visual design and the development of computer algorithms. It is this step that clearly distinguishes information visualization from its nearest neighbors such as quantitative data visualization. In a more formal terms, this step can be found in an earlier taxonomy of information visualization, which models the process of information visualization in terms of data transformation, visualization transformation, and visual mapping transformation. Data transformation turns raw data into mathematical forms. Visualization transformation establishes a visual–spatial model of the data. Visual mapping transformation determines the appearance of the visual–spatial model to the user. On the other hand, if the data is quantitative in nature, researchers and designers are in a better position to capitalize on this valuable given connection. The connection between scientific and artistic aspects of information visualization is discussed in terms of functional information visualization and aesthetic information visualization. The primary role of functional information visualization is to communicate a message to the user, whereas the goal of aesthetic information visualization is to present a subjective impression of a data set by eliciting a visceral or emotive response from the user.
Finally, as for data, while scientific visualization is applied to scientific data, information visualization is often applied to abstract data. Scientific data are often physically based (the human body, the earth, molecules, etc.), whereas abstract data are non-physical information and may not have obvious spatial mapping (financial data, business information, collections of documents, and abstract conceptions).
2.3.2.GEOVISUALIZATION
Visualization in scientific computing emerged from the computer science field along with fields such as scientific visualization and information visualization. Information visualization is documented as having the potential to enable both better understanding of complex systems and discovery of information that might otherwise remain unknown, thus facilitating better decisions (Card et al. 1999). Cartographic research efforts in visualization have been extended to meet other research activities in information science disciplines. This recognition was advanced by the creation in 1995 of a Commission on Visualization (later known as the Commission on Visualization and Virtual Environments) belonging the International Cartography Association (ICA) (MacEachren and Kraak 2001). The research goal of this commission is to cope with the increasing volume of geospatial data by developing theory and practice that facilitate knowledge construction through the visual exploration and analysis of geospatial data. In addition, emphasis is focused on the visual tools necessary to support knowledge retrieval, synthesis and use (MacEachren and Kraak 2001). GeoVisualization (visualization applied to geospatial data) can be considered as the core discipline for understanding complex phenomena and processes, and structures and relationships in complex geospatial datasets. It integrates perspectives on the representation and analysis of geospatial data with recent developments in scientific and information visualization, exploratory data analysis (EDA), GIS, cartography and image analysis (Kraak 2000). GeoVisualization also includes the use of a number of techniques for exploring data, answering questions, generating hypotheses, developing solutions and constructing knowledge. Such a visual exploration of geospatial data (Kraak 1998) can be useful for displaying patterns with interaction and dynamics in order to achieve better decision-making.
Human vision and domain expertise are powerful tools that together with computational tools make it possible to turn large heterogeneous data volumes into information (interpreted data) and, subsequently, into knowledge (understanding derived from integrating information). Visualizing the world through geospatial data has been a cartographic concern for centuries. Still, the ICA recognized a need, in 1993, for a special effort to link cartographic research activities in visualization with those in other information science disciplines, particularly those prompted by the U.S. National Science Foundation (McCormick et al., 1987). The goals of ICA have been to develop both theory and practice to facilitate knowledge construction through visual exploration and analysis of geospatial data, along with the visual tools needed to enable subsequent knowledge retrieval, synthesis, and use. Over the past decade, methods and tools for visualization in support of science have advanced rapidly with demonstrated successes in various areas. In addition, a new discipline of Information Visualization has begun to emerge, with a focus on visualization of non-numerical information (Card et al., 1999). Still, visualization is not being taken advantage of to exploit the full potential of geospatial data. Many core challenges being faced in the natural and social sciences have an inherent complexity and inter-disciplinary nature.
Geovisualization has the potential to provide 'windows' into the complexity of phenomena and processes involved, through innovative scene construction, virtual environments (VEs), and collaboration, thus prompting insight into the structures and relationships contained within these complex, linked datasets (Alan M. MacEachren and Menno-Jan Kraak, 2001). Current visualization methods and tools have not been designed to deal with the unique geospatial characteristics of data critical to these problems nor to take full advantage of georeferencing as a mechanism for fusing data from diverse sources. Geospatial data and the geospatial information resulting from them are essentially different from other kinds of data and information in at least three ways.
First, geospatial data are inherently structured in two (latitude and longitude), three (position above or below the Earth’s surface), or four (time) dimensions, while often unstructured in others with no set relationship among non-spatial variables. Thus, distances and directions among entities and locations have real meaning in geographic space. The inherent structure can be exploited to enable efficient data access with very large databases. That same spatial structure poses problems for traditional statistically based methods of analysis (used either alone or in conjunction with visualization, i.e., problems of spatial autocorrelation). Thus, different approaches must be developed for integrated visual-computational analysis of these data.
Second, many objects in geospatial databases have meaningful and useful names that can be taken advantage of in both database access and analysis. As with inherent structure of geospatial data, however, the match between geographic names and objects is complex and varies in explicitness. Geographic names for human constructed objects (e.g., county, road) have precise matches with location in the world while those for natural objects (e.g., mountain, flood plain) often do not. Third, geographic scale is a critical but complex issue, with different geospatial datasets often containing emergent behavior at different scales. To capture scale-dependent phenomena and processes, geospatial data are typically collected at multiple scales, with fundamental differences in entities and their semantic structure across scales. For example, things defined as objects at one scale (e.g., residential buildings or a thunderstorm event) may be conceptualized as fields at another (e.g., a land use zone or an average precipitation surface), or not represented at all. While multi-scale data integration and analysis is a common problem in science, the diversity in kinds of phenomena brought together in geospatial analysis (for example, modeled climate data, aggregate demographic statistics, highway and river networks, soil classifications, quantitative and qualitative field survey data, satellite remote sensing) makes geospatial scale issues particularly challenging
2.4.EXTRACT INFORMATION FROM COMPLEX GEOSPATIAL DATA
Take out information from large geospatial data is a major issue in GIScience research. Many efforts across such disciplines as machine learning, statistics, and database and information visualization have underlined different aspects of exploratory analysis and knowledge discovery (Gahegan 2001) for uncovering structure within geospatial data and producing hypotheses with which to explain the patterns (Agrawal et al. 1993; Gahegan and Takatsuka 1999; MacEachren et al. 1999). Several techniques are used, including artificial intelligence (AI) and machine learning techniques (Openshaw and Openshaw 1997; Openshaw 2000; Gahegan 2000a). AI is a domain of computer science dealing with the automation of intelligent behavior for solving complex tasks. The experts define the field as "the study and design of intelligent agents" where an intelligent agent is a system that perceives its environment and takes actions that maximize its chances of success [Poole, Mackworth & Goebel 1998]. AI is an inclusive term for several areas of computing that attempt to mimic processes that humans carry out without much conscious thought (Mallach 1994). Major areas covered by artificial intelligence include artificial neural networks, robotics, machine vision, speech recognition, interpreting sentences in natural languages, and expert systems. In GIScience, there are many complex tasks related to data processing and manipulation for which a number of applications of artificial intelligence have been used. Expert systems or rule-based knowledge engineering systems have been used to design geoinformation systems (Openshaw 1997) to automate either highly skilled tasks such as map generation and name placement on maps in cartography, or rules for selecting good locations in complex planning situations. Neural networks are also applied in various areas of geoinformation science, including mapping, data classification and prediction.
In the following subsections the attention is focused on two research themes which, although originated from a different context, have recently acquired a relevant role for the domain of geographic applications, namely Visual Analytics and Knowledge Discovery & Decision-Making.
2.4.1.GEOVISUAL ANALYTICS
Geovisual Analytics is an emerging interdisciplinary field that integrates perspectives from Visual Analytics, grounded in Information and Scientific Visualization, and Geographic Information Science, growing particularly on work in geovisualization, geospatial semantics and knowledge management, geo-computation and spatial analysis. We can define Geovisual Analytics as a new paradigm for how information technologies can be used to process complex geospatial information to facilitate decision making, problem solving, and insight into geographical situations. Geovisual Analytics can be used for situation awareness, supporting collaboration, decision making, and evaluating the analytical process itself. Nowadays there are a lot of Geovisual Analytics tools that help to identify significant geospatial information, data, and knowledge by supporting analytical processes that join innate human abilities of vision and cognition with computer-based visual interfaces. They are specifically designed to provide support for analytical reasoning and provide flexible connections to relevant data and supporting knowledge (Tomaszewski et al 2007).
Frequently, the activities that Geovisual Analytics is directed toward involve recognizing relevant information in huge datasets that make what is relevant difficult to determine by using traditional techniques. Geovisual Analytics is an increasingly important tool for activities ranging from counter-terrorism and crisis management, through environmental science, to strategic business decision making.
Conceptually, Geovisual Analytics system design efforts can build from the following guidelines for visual analytics generally, as outlined in Thomas and Cook (2005):
•Use sense making, cognition, and perception foundations for tools that support reasoning for complex tasks
•Address issues of analytical scale and the interplay between complexity and urgency that dictates and determines the scale
•Synthesize different types of information from different sources into unified representations to find meaning
•Integrate views of large-scale information spaces, coordinated views of information in context, and overviews and details
•Leverage innate human abilities to reason about time and space
Geovisual Analytics investigation requires tools that are highly interactive and support exploration (Allendoerfer et al., 2005), that work with end-users previous experience and mental models, and that allow for evidence to be assessed and hypotheses to be easily evaluated. Thus far, Geovisual Analytics tool development has focused on information analysis relevant to domains such public health threat analysis (Proulx et al., 2006) and historical geography of fragmentary archival documents (Figure 2.2) (Weaver et al., 2006).
Fig 2.2 The ‘Hotels Viz’, a Geovisual Analytics application built in the Improvise interactive visualization construction system (Weaver, 2004). Users can explore spatial and temporal aspects in past travel behavior based on historical registry entries from historic hotels.
The ultimate end goal of Geovisual Analytics investigation is the dissemination of results to decision makers who need a succinct communication of the interpretations made by an analyst or group of analysts. Geovisual Analytics tools must support visual outputs that can be used as artifacts of persuasion in whatever medium is used to convey the story (Gershon and Page, 2001).
In this thesis, GeoVisual Analytics techniques combine methods from knowledge discovery and interactive visualization in an integrated framework to facilitate decision makers in their knowledge creation and sense making process. These GeoVisual Analytics techniques aims at utilizing the strength of
a) knowledge discovery which allows for fast analysis of spatio-temporal data and pattern recognition,
b) interactive geovisualization which represents data in a way that affords seeing and interacting and enable thought processes to translate from data to information, and
c) the human’s knowledge, assessment and reasoning potential that helps to refine and organize information more appropriately in an analytic discourse.
2.4.2.KNOWLEDGE DISCOVERY &DECISION-MAKING
In the broader framework of modern thought an early formulation of knowledge was put forward by Descartes to relate “knowledge” to “models”. It defined “real knowledge” as concerned with spatiality or extension, in the sense that what could be scientifically known was restricted to what could be called “things”, meaning it can be seen (perhaps with the help of instruments) and measured. The world was divided into “thinking substances”--the phenomena of mind--and “extended substances”--the phenomena of bodies or matter, with extension, shape and dimensions. Due to knowledge, humans can solve many problems by using “common sense”. Domain-specific knowledge is in the mind of an “expert” because of perception, learning and reasoning, but it can be difficult to communicate and use it. Increasingly, humans use computer technology to store existing knowledge in databases, digital libraries and on the web. Peuquet (2002) examined the background of spatial knowledge and its relation to the nature of space and time. She links the long tradition of human thought about space and time to the GIScience.
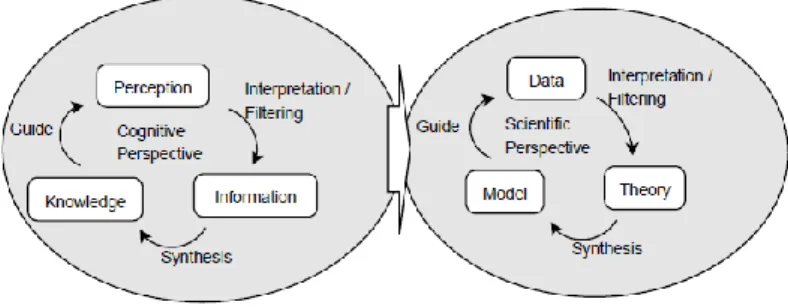
Regarding knowledge acquisition she distinguishes between the cycles from the cognitive perspective and from the scientific perspective shown in Figure 2.3. Peuquet suggests that, “In the scientific context theories are formulated via filtering the data to select those observations considered relevant or “interesting”. This selection tends to reveal patterns or consistencies in an observed phenomenon.
Figure 2.3. Cycles of knowledge acquisition from the cognitive perspective and from the scientific perspective, based on Peuquet (Peuquet, 2002)
Situations where decisions should be taken can be related to different levels of tasks such as mapping, monitoring, management and specific problem solving. When geospatial data are involved, it is recognized that the use of maps and visual representations derived from geospatial analysis operations leads to decisions (Kraak et al. 1995).
Information visualization techniques are increasingly used in combination with other data analysis techniques. Recent works in knowledge discovery in databases (KDD) have provided a window for geographic knowledge discovery. Data mining, knowledge discovery and visualization methods are often combined to try to understand structures and patterns in complex geographic data (MacEachren et al. 1999; Wachowicz 2000; Gahegan et al. 2001). One way to integrate the KDD framework in geospatial data exploration is to combine the computational analysis methods with visual analysis in a process that can support exploratory and knowledge discovery tasks.
Decision making is one of the main goals of geospatial data analysis. It requires a series of steps in order to evaluate possible alternatives and decide upon specific actions. Malczewski (1999) suggested three phases in the geospatial decision-making process:
- Intelligence (searching for conditions calling for a decision) - Design (finding and evaluating decision alternatives) - Choice (choosing between decision alternatives).
The first phase of the process (intelligence) is devoted to retrieve appropriate information. This phase is particularly important and requires the transformation of appropriate data into relevant information for finding, evaluating and choosing decision alternatives, in a way that effectively facilitates knowledge acquisition. The process of automatically searching large volumes of data for patterns is known as Knowledge discovery. Two basic topics can be considered for this goal, namely what kind of data is searched and in what form the result of the search is represented. The knowledge obtained through the process may become additional data that can be used for further usage and discovery.
The last two phases of the decision-making process (design and choice) may be attributed in certain conditions to human intelligence or other support tools helping the decision making process.
C
HAPTER
3
A
NALYZING LARGE GEOSPATIAL DATASETSIn the last decades, researchers from many disciplines have tried to facilitate people's use of computers and provide ways for scientists to make sense of the huge amounts of data they can manage. However, the inconsistency and the disorder which typically exist in huge volumes of data may compromise their analysis, which is a crucial task in many application domains and essential for decision makers and analysts [75]. Moreover, when a large amount of data is available, activities such as synthesizing information, discovering hidden information, deriving insight from it and performing specific analytical tasks may result time-consuming and expensive, because large and rich databases easily overwhelm mainstream geospatial analysis techniques oriented towards the extraction of information from small and homogeneous datasets (Gahegan et al. 2001; Miller and Han 2001). As a consequence, this awareness by the GeoVisualization community has stimulated researchers from different disciplines to interact in order to devote their efforts towards the design of effective visualization environments for analyzing large geospatial datasets.
Some methods recalled in this dissertation, devoted to make sense of the huge amounts of data, can be used both to extract features from complex data and represent them by applying appropriate visualization techniques capable to derive information in a way that allows better understanding of the underlying structures and processes [37], [34], [35], [38]. These techniques originate from the InfoVis research field where the recent attention of researchers has been encouraged by the necessity to support humans in solving problems through highly interactive visualization tools able to both synthesize information from large datasets and perform complex analytical tasks. To this aim, information spaces may play a relevant role by offering visual representations of data that bring the properties of human perception to bear (Card et al. 1999). In fact, spatial metaphors are often used to facilitate the representation and understanding of information in such spaces (Fabrikant et al. 2002).
The idea that, when dealing with scenarios describing complex issues, visual representations may provide useful support in locating facts and new patterns, has also inspired our research whose aim is twofold. We are investigating the definition of cartographic solutions for geospatial data, capable to better represent geographic information extracted from (spatial) database contents, referring both to static objects and dynamic phenomena. Then, we aim to extend the applicability of these solutions by embedding them within a complete process ranging from visualization to analysis of geospatial information. In order to reach this goal, several issues have being faced which overlap and affect each other. Among the others, to improve visual experience of interfaces organized to display and synthesize large amounts of data, our research aims to support users’ daily activities by means of solutions which also include principles of human-computer interaction and usability. Moreover, specific objectives embrace providing appropriate tools and interfaces that facilitate the development of problem solutions by combining the potential of augmented reality with the ability to visually analyze and present spatial data. Finally, data exploration represents an additional relevant goal of our research which is targeted to provide expert users with compact and interactive user interfaces able to manage large numbers of items extracted from huge datasets, and therefore contribute to enhance the understanding of geographic processes and knowledge construction.
In the following, a description of results of our research is presented in terms of methods and techniques originated by investigating both the geovisualization field and the visual analytics domain. In particular, the goal of this chapter is to describe my contribution and highlight how each specific result has a proper
collocation within the whole management process of geospatial data. These results represent the juxtaposition of theory and methods along with development activities which have led to the realization of effective tools for expert users which take advantage of novel technologies, such as augmented
reality, Global Positioning System (GPS) and synthesis techniques that create visual screens of information.
3.1.ENHANCING MOBILE USERS’ CAPABILITIES THROUGH CUSTOMIZED GEOVISUALIZATION TECHNIQUES
The pervasive nature of mobile devices has stimulated developers to realize applications useful for human daily activities, whose interests are focused on supporting users and improving their life style through immediate and light solutions. In particular, the availability of pervasive integrated tools capable to send, receive and handle information has encouraged the development of advanced solutions in several application domains, ranging from cultural heritage to environmental protection, to emergency management to entertainment and edutainment.
Within this scenario, the goal of the research we are carrying out is meant to design and develop advanced user interfaces to support users’ exploration activities. In particular, we aim at providing users with services where mobility comes into play. This is the case for user’s navigation services, where advanced functionalities are devoted to capture a qualitative global view of a scenario, by simplifying the detection of relevant elements.
The following subsections introduce my contribution to these research activities, namely an innovative paradigm for human-(geo)information discourse which integrates different modalities of visualization and navigation with visual metaphors associated with both geospatial data and their aggregations / syntheses. In particular, the result consists of interactive views of a scenario each visualizing complementary information in terms of maps, geospatial data, and information. The proposed paradigm has been exploited as a basis for advanced navigation techniques, named Framy-Augmented Reality (Framy-AR, for short) and Link2U, which incorporate novel technologies and human-computer/GIS interaction criteria. In general, they combine the pervasiveness of mobile devices, the visual metaphor capability to convey information, and criteria derived from usability studies, in order to define a new modality for navigating and accessing geospatial data. In particular, given the previous features, Framy-AR adds them the augmented reality potentiality, and Link2U takes advantage of the ability to “communicate” of the social network.
3.1.1.FRAMY-AR: BEYOND THE SCREEN MAP EXPLORATION
Our previous work in the area of mobile interaction was aiming to overcome screen limitations of mobile devices by representing, through a qualitative metaphor, the geographic distribution of elements located outside the visible space. In [6-7] an innovative visualization technique, named Framy, has been introduced which exploits an interaction metaphor for picture frames to provide hints about off-screen objects. The idea is to visualize a frame along the border of the device screen, where the colour intensity of each frame portion represents a visual summary of data located besides the visualized map area. By embedding Framy within a mobile application, an appropriate tradeoff is achieved between the zoom level needed to visualize the required features on a map and the amount of information which can be provided through a mobile application. Framy-AR represents my current contribution to this research activity. Framy-AR is meant to both capture relevant features of a geographic space and convey such an information through the functionality of an augmented reality environment to enhance user’s navigation activities with
mobile devices. In Framy-AR a semi-transparent coloured strip is used to summarize information on Points of Interest (POIs) located inside the camera visual cone, and augmented reality techniques are used to emphasize those POIs in the current field-of-view. A customizable multimodal interface which includes visual, audio and tactile interaction modes characterizes the system, in order to fully exploit the communication potentials of current mobile technology.
The main advantage users may gain by Framy-AR is that they can immediately obtain hints about objects located around them, independently of the visualization modality they are adopting. This represents one of the most sought-after goals of a system targeted to support users' navigation and here it is achieved by defining a geovisualization technique where a geospatial data representation is included within a real scenario enriched by a visual metaphor associated with heterogeneous information.
Chapter 4 provides for a detailed description of the Framy-AR visualization technique.
3.1.2. LINK2U:CONNECTING SOCIAL NETWORK USERS THROUGH MOBILE INTERFACES
Traditionally, social networks have focused on building online communities of people who communicate and share interests and/or activities. The technological revolution determined by the advent of ubiquitous IP networks combined with the advanced features of mobile interfaces has motivated a gradual transformation of social networks and of the services they provide towards mobile social communities. The most tangible effect of such a revolution is that social network users are now able to connect everywhere and anytime through handheld devices. It has therefore become paramount to study new interaction techniques that suitably exploit mobile technology to convey contextual information about both the physical environment surrounding a user and the (mobile) virtual community characterizing it.
Link2U represents an integrated solution for geo-communities on mobile devices which combines the potential of augmented reality with the ability to “communicate” of the social network. The rationale behind it is to meet mobile users’ requirements of continuously acquiring information about the surrounding environment, essential for their activities. My contribution to this research has been focused on advanced modalities of geo-localization, location based services (LBS) and augmented reality techniques. In particular, by combining the potentials of mobile devices with the augmented reality capability to convey information of interest, the users' requirement of mobility services to improve their activities inside a wide community of people has been satisfied. This result has been achieved by adopting the idea of complementary views of a scenario enhanced by visual metaphors meant to represent synthesized information and preserve relationships among items of different views, thus guaranteeing the interactivity.
Chapter 5 provides for a detailed description of the Link2U visualization and navigation technique.
3.2.BUILDING A HUMAN-(GEO)INFORMATION DISCOURSE THROUGH GEOVISUAL ANALYTICS TECHNIQUES
The previous visualization and navigation techniques represent the contribution of this dissertation to the geovisualization field. Users may benefit from Framy-AR, Link2U and every possible new solution which adopts the proposed approach to support their daily activities of representation of relevant information concerned a territory investigated through a user-centred view.
One of the most interesting properties of the above techniques results from the integration of visual metaphors and different modalities of visualization and navigation. It consists of the capability to preserve the link between a metaphor and data associated to it, while navigating a scenario. This property has been then exploited as starting point for the development of a geovisual analytics technique, the goal we are carrying on in order to complete the human-(geo)information discourse in a seamless manner.
The goal of this Section is to introduce my contribution to this research activity. It is based on the previous geovisualization techniques and exploit them to define a new data-entry methodology useful to access data underlying geospatial information. In order to reach this goal, the proposed visual metaphors, defined to represent data and phenomena of interconnected scenarios, have been syntactically and semantically extended by associating them with both a hierarchical structure and syntheses / aggregations of atomic data. Such an enhancement has allowed for the definition of a geovisual analytics methodology that can be used to investigate cause/effect relationships of phenomena of interest by accessing underlying data. In particular, the spatial manipulation of metaphors and the application of specific operators allow to invoke appropriate analysis functions in order to semantically and visually integrate quantitative, qualitative and cognitive aspects of a domain of interest.
The proposed geovisual analytics methodology has been experimented by including three different visualization techniques, namely maps of chorems, clouds of tags and Link2U. In the following, my contribution to this research activity is described and each following subsection is devoted to describe how the proposed methodology has been properly instantiated within specific domains in order to support analytical tasks.
3.2.1. ACCESSING SPATIAL DATA THROUGH CHOREMATIC MAPS
Chorems are metaphors capable to visually represent geographic database content. In particular, they illustrate a territory in a schematized way, by summarizing items of interest and phenomena related to them [41].
The well-established capability of map of chorems to synthesize and represent relevant information of a territory has stimulated our research to investigate how the rationale behind this geovisualization technique could be exploited to assign chorems an enhanced role and achieve further advances. My contribution to this investigation has been to study how chorems could be used as an innovative means for database-entry, thus increasing the role they can play in geographic domains, from a cartographic solution to a visual analysis tool. To reach this goal, both structure and semantics of chorems has been enriched and a set of operators has been defined meant to both analyze a specific phenomenon and query the underlying data by which it has been determined. Thus, realizing an application which uses chorems both for visualizing and analyzing a territory and its phenomena implies to obtain a tool capable to completely support expert users' and decision makers' activities.
Chapter 6 provides for a detailed description of geovisual analytics applied to maps of chorems. 3.2.2.DELIVERING ADVERTISEMENTS ON MOBILE DEVICES
Advertising is a rapidly growing sector where potentialities of mobile devices are defining new solutions for the geomarketing policies. In particular, customized delivery of advertisements (ads, for short) on mobile devices is recognized to be a promising approach to overcome limits of traditional and digital media and capture users’ interests in certain domains [84], [114].
The geovisualization technique Link2U, described in chapter 5, has been adopted to build a system for delivering personalized ads on mobile devices, based on a user model that takes into account user’s interests over time. The purpose is to create a community of people, who receive information on sales promotions targeted to shops that have an agreement, directly on their mobile device, also by using advanced techniques of geo-localization and augmented reality. As a result, services where mobility comes into maybe then provided through the Link2U visualization and navigation technique, such as geographic distribution of POIs and traceability of users' movements within a given area. Moreover, each metaphor representing both users, paths and sites is associated with a rich set of structural and semantic information, useful when an analysis function is requested. These functionalities allow expert users to perform analytical tasks and recognize possible relationships between user's interests and potential products.
Chapter 7 provides for a detailed description of these results.
3.2.3.TAGAMAP:VISUALLY ANALYZING GEOGRAPHICAL INFORMATION THROUGH TAG CLOUDS
In this dissertation, a GeoVisual Analytics technique is introduced, named TagaMap, which is based on a recent InfoVis technique, known as Tag Cloud. Clouds of tags summarize the content of a text by a set of differently-sized/coloured keywords. The method I propose adopts the Tag Cloud rationale and extends it by exploiting techniques for summarizing datasets and simplifying their geographic representation, such as cartograms [49] and chorems [80]. Starting from a geographic dataset, the proposed method extracts relevant information about a geographic area by counting and/or summarizing data, and generates a simplified map containing a georeferenced cloud of tags, located within the geographic area which original data are related to. The resulting representation is a sensible map which both conveys to the users qualitative and quantitative features related to the dimension, and their relationships with territory, and allows them both to access underlying geospatial data and then analyze them through semantic and geographic operations.
C
HAPTER
4
A
UGMENTEDM
AP NAVIGATION THROUGHC
USTOMIZABLEM
OBILEI
NTERFACESThe interest toward mobile applications useful for human daily activities is leading researchers to new challenges, embracing the adoption of suitable technology, the identification of efficient and effective algorithmic solutions and the design of usable and powerful user interfaces.
The system described in this Chapter [35], Framy-Augmented Reality (Framy-AR, for short), is meant to support users' exploration activities including the fruition of navigation services. Framy-AR suitably combines the benefits of the Framy visualization technique [92] with those of the augmented reality (AR) to enhance user’s navigation activities with mobile devices. In the new combined visualization method a semi-transparent colored strip is used to summarize information on POIs located inside the camera’s visive cone, while the augmented reality techniques are used to emphasize those points in the current field-of-view. A customizable interface characterizes the system, thanks to the definition of a new technique for computing the best user-adaptive pedestrian route. In particular, the support to the pedestrian navigation is achieved by considering specific features of the pathway under exploration weighting them against user’s profile. Moreover, in order to fully exploit the communication potentials of current mobile technology, a multimodal interface has been designed, which includes visual, audio and tactile interaction modes.
The remainder of the Chapter is organized as follows. In Section 4.1 related work is discussed. Section 4.2 briefly recalls salient aspects of the original Framy visualization technique and shows the new Framy-AR multimodal technique. In Section 4.3 the customization model of Framy-AR is described. Section 4.4 presents a working example which illustrates the Framy-AR functionality.
4.1.RELATED WORK
A valuable work in the area of mobile GIS accessibility has been carried out by Yairi and Igi, who followed a universal design approach to develop their Mobility Support GIS targeted to a variety of pedestrians including elderly, disabled, pregnant, and infant users [67]. The routes in their system are represented by lines and nodes. Lines are associated with attribute data of barrier/barrier-free features often found on sidewalks, while nodes are points indicating a link with lines carrying different attributes. The gained know-how is proposed as useful guidelines for the development of pedestrian oriented accessible GIS.
An interesting application targeted at physically disabled users was presented in [71]. The authors describe a Web GIS providing impaired people with pedestrian routes. Each route is divided into segments, so that each segment has homogeneous characteristics. The overall characteristics of a route are determined by taking into account the difficulties of each obstacle as well as psychological factors related to the specific user. Obstacles are mapped onto a database and a weight is assigned to each of them, so that users can plan the route and analyze the obstacles carefully. This approach turned out to be appropriate for a mobility support GIS, thus we have decided to apply a similar technique for the customization model of Framy-AR, which also retains the distinction between discrete and continuous obstacles. Moreover, in Framy-AR weights depend on both user’s ability, her/his interest in the target destination and degree of disability. Finally, the addition of the tactile and auditory interaction modalities makes our system also suitable for visually impaired users.
Recently, growing attention is being devoted by researchers to the adoption of AR techniques for mobile devices, as a means both to guide users and assist them in the recognition of objects [16], [62], [19].
The AR technique embedded in Framy-AR is based on both user's position and sensors providing orientation on mobile devices. It was partially inspired by the pedestrian navigation system presented in [16], where the user is capable to see the POIs superimposed on the captured video image, and s/he can recognize their location outside the view limits of the camera. The same technique is adopted in Framy-AR, better targeting the use of the original Framy orientation technique to all kinds of mobile pedestrian users. In [34] the authors exploit technologies related to AR and geo-localization to provide visually impaired users with pedestrian routes. The equipment used for this purpose consists of a wearable computer, a microphone and a headphone. While outdoor user's position is provided by a GPS receiver, the indoor position is retrieved through the ultrasonic receivers. Similarly, our prototype uses a GPS receiver in outdoor areas, while it uses a WI-FI hotspot triangulation technique for indoor areas. Finally, the system is smart-phone based.
Also inspired by the benefits of AR, it is worth mentioning the system presented in [62]. The authors propose a walking guide on mobile devices presented as a sequence of “augmented photographs”. Geo-tagged photographs are retrieved from a database and are automatically augmented with navigational instructions.
Finally, a domain-specific AR application is described in [19]. The authors propose a software for mobile devices capable of recognizing cataloged objects in a museum. The technique is based on user's position and image recognition algorithms.
4.2.THE FRAMY-AR MULTIMODAL TECHNIQUE
The Framy visualization technique is explicitly targeted to enhance geographic information visualization on small-sized displays. The rationale behind Framy is to display a semi-transparent colored frame along the border of the device screen to provide information clues about different sectors inside or outside the screen. For a given query, the color intensity of each frame portion is proportional to the number of resulting objects located in the corresponding map. Thus, the frame may indicate both the distance and the direction of specific POIs. It may also represent the amount of POIs located toward a specific direction. In general, the frame portion color intensity represents a summary of data located besides the screen border. Moreover, the number of frame portions can be interactively increased so as to refine the query results, indicating, e.g., the direction where certain objects can be found. More details can be found in [85].
Framy-AR represents a project which merges the concepts introduced with Framy into an AR environment to improve the perception of the objects or objects properties on a mobile application characterized by a strong geographic component.
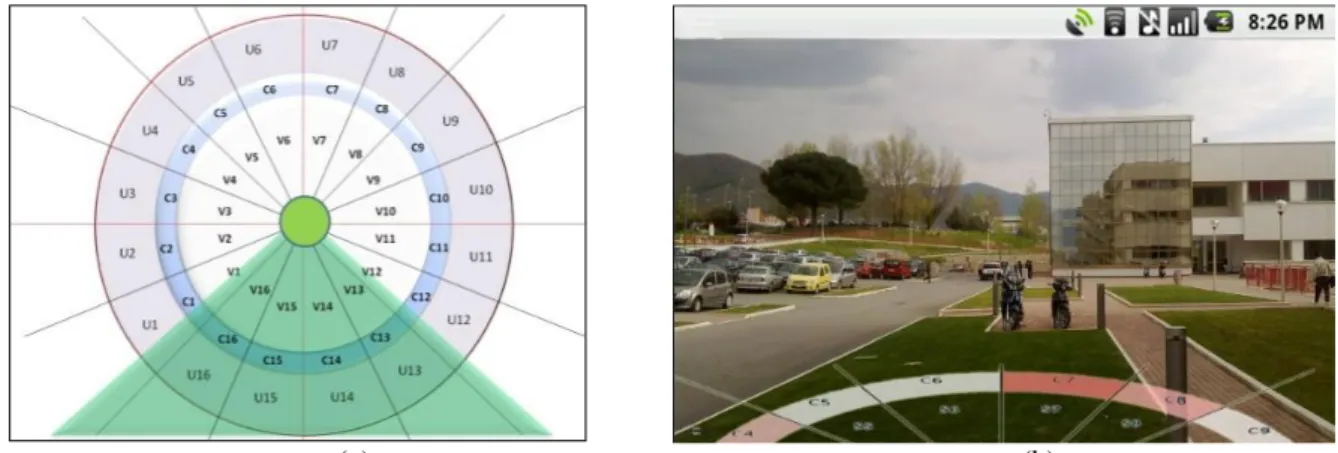
Recent advances in technology have encouraged Information technology (IT) researchers to investigate innovative multimodal interfaces and interaction paradigms, able to exploit the increased technological power as explained in [48]. In Framy-AR, users may benefit from two different visualization modalities, namely Basic and Augmented. The former corresponds to the basic two-dimensional view, the latter exploits augmented reality features to improve users’ sensory perception of the context. Users can switch between the Basic Mode and the Augmented Mode by laying down and drawing up the device (see figure 4.1).
![Fig. 6.6 A manually made Chorematic Map (a) about USA and its legend (b) taken from [109]](https://thumb-eu.123doks.com/thumbv2/123dokorg/7194466.75045/65.892.182.803.245.478/fig-manually-chorematic-map-usa-legend-b-taken.webp)